Strategy Inc (NASDAQ: MSTR)
Bitcoin Treasury × Software Platform × Capital Structure Analysis — Capitulation Update
Executive Summary
Strategy Inc closed July 2, 2026 at $93.39 — a fresh 52-week low, breaking below the $104.17 floor that had held since the March 2026 report on this name. That print did not go unanswered. The lower-timeframe terminal fired SD2L EXTREME, now reading ACTIVE with +2 bullish factors, and the tape responded immediately: the daily bar closed +7.43% off the low, the weekly bar is +13.46%, and pre-market trades $98.45 — a further +5.4% above the close. This is the sharpest snapback signature MSTR has produced since the November 2025 cycle low.
Every timeframe still reads BEARISH bias with the Dev Filter FAILING — Weekly at -41.67%, Daily at -62.56%, and the zoomed daily view at -32.01% below AVWAP. Cantillon Flow reads DISTRIBUTION (Liquidity ✗ | Equities ✓ | Risk ✗) with Composite pinned at +0/9 across all three reads. None of that has changed. What has changed is that price is now so extended from every institutional reference point that the framework's mean-reversion layer — not its trend layer — has taken over the signal.
Section 1: Institutional Volume Structure — Three-Timeframe Read
Terminal Dashboard — July 2, 2026, Daily
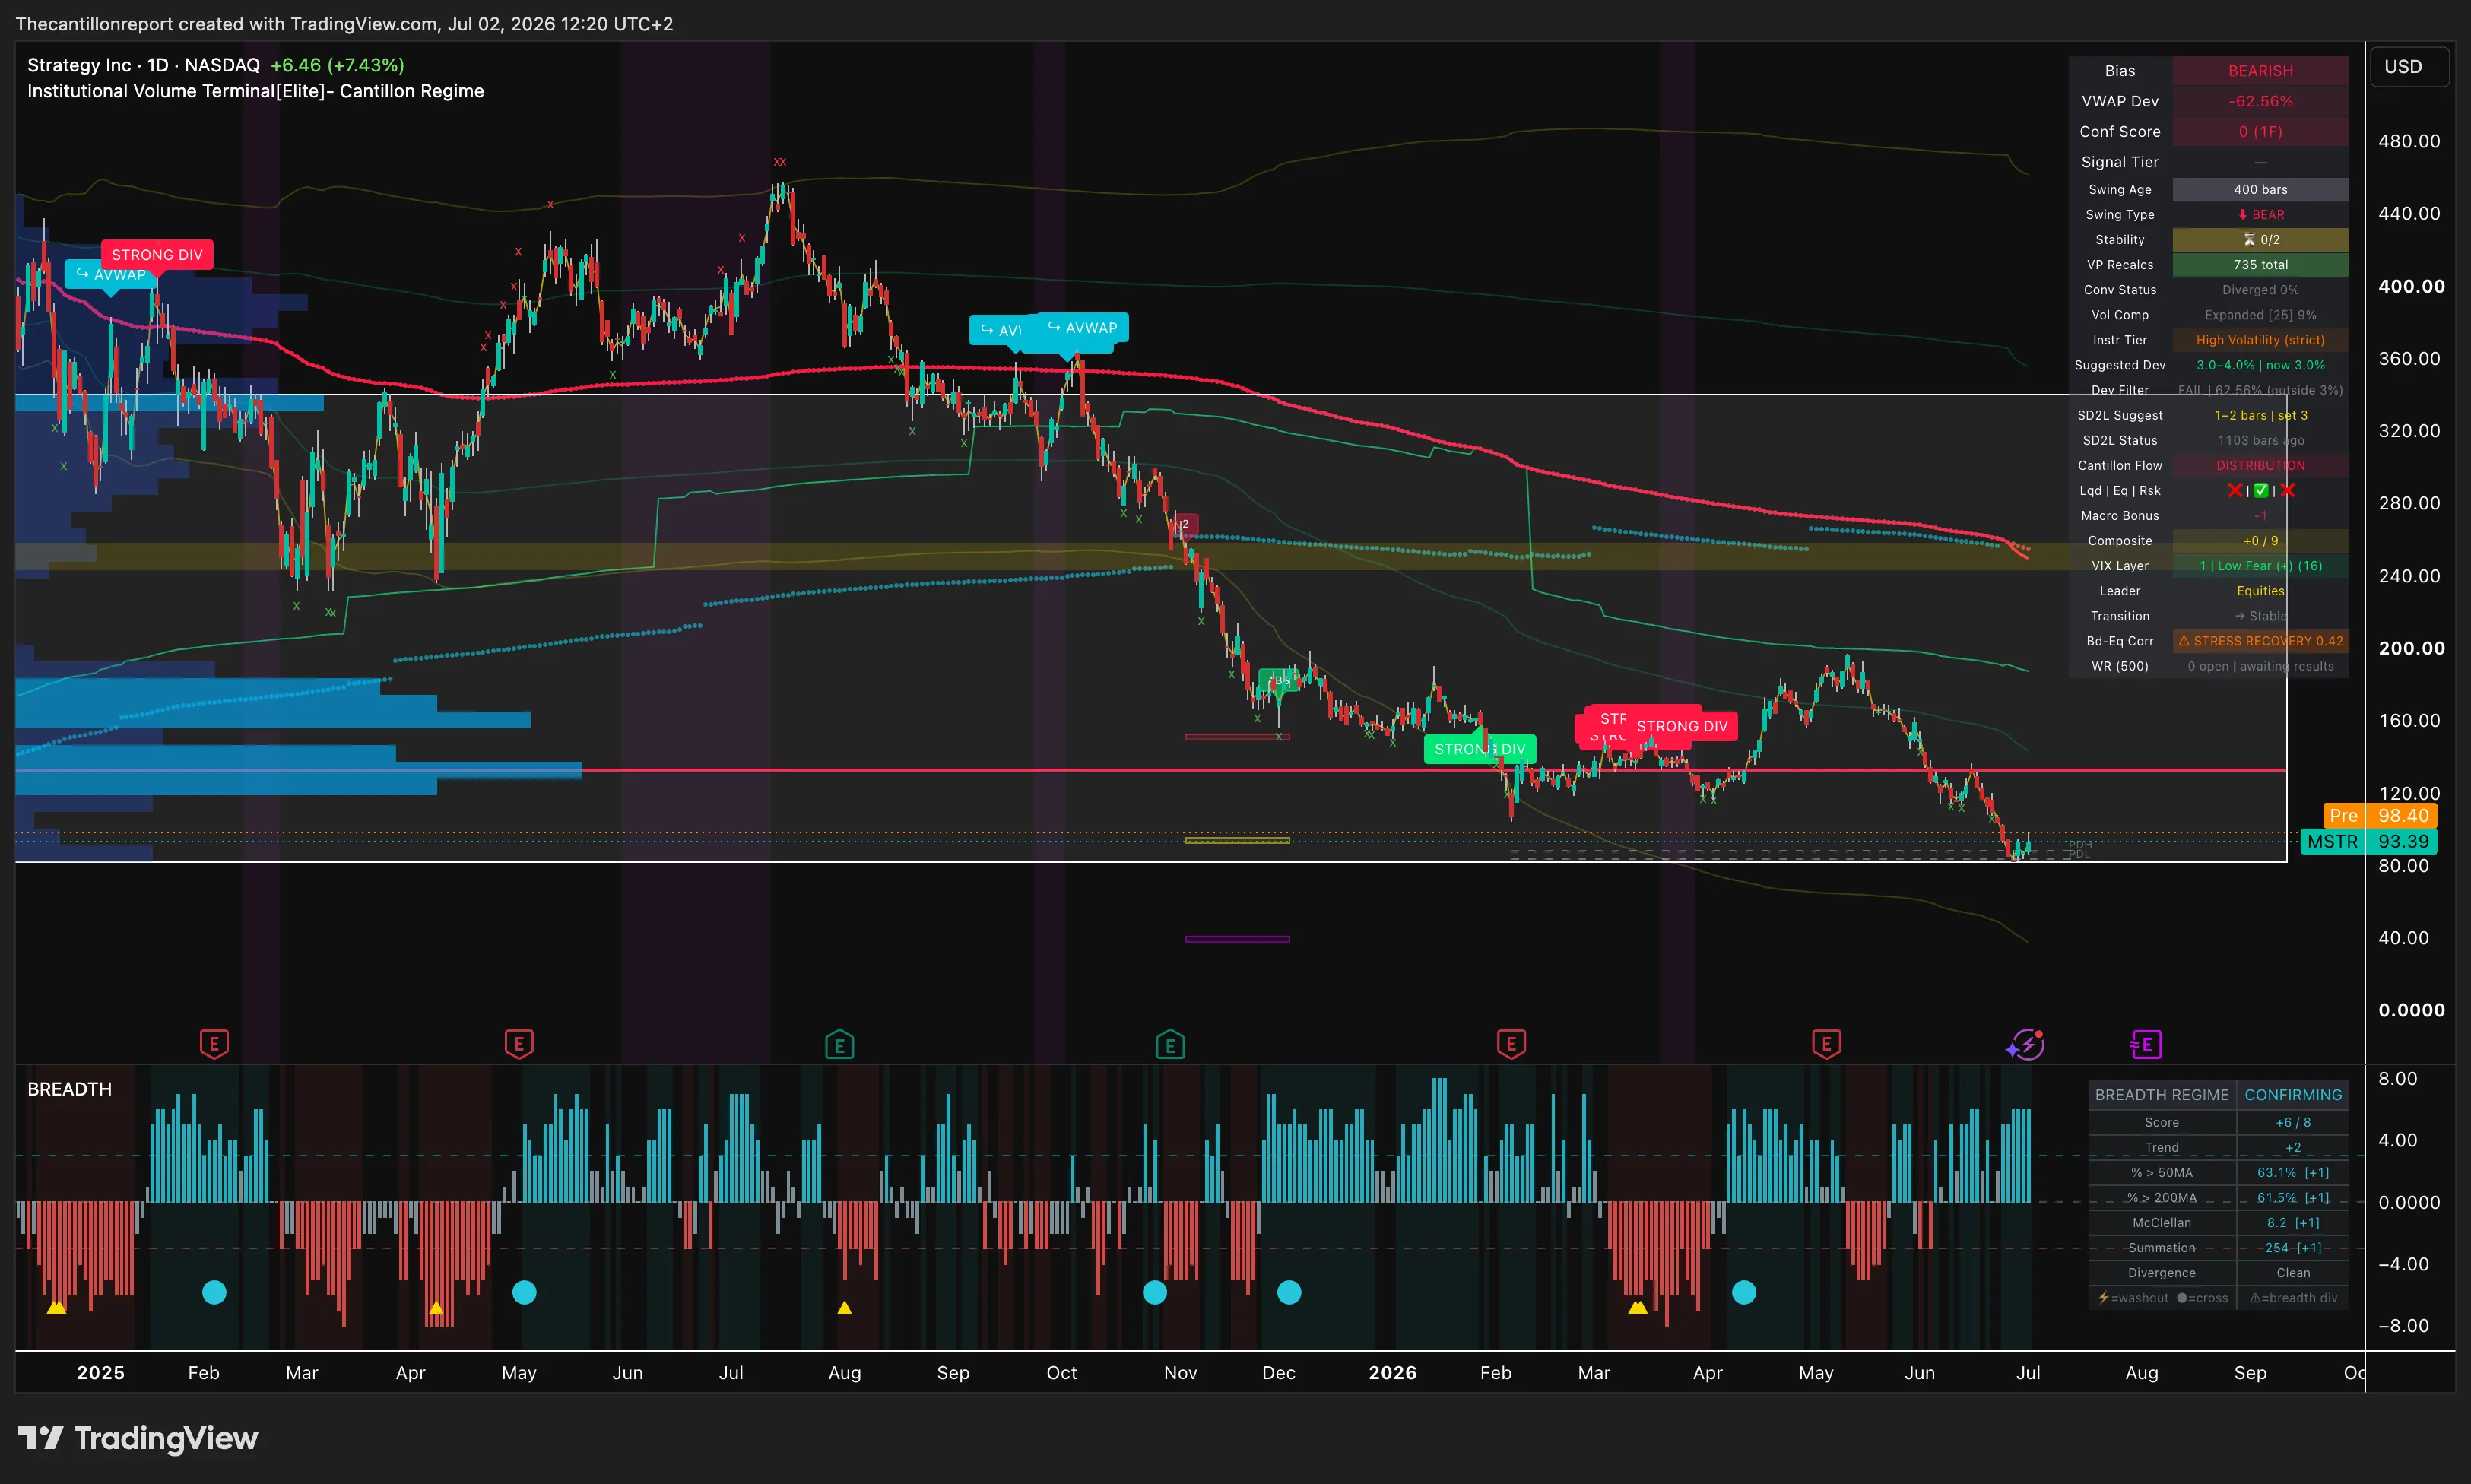
| IVT Parameter | Reading |
|---|---|
| Bias | BEARISH |
| VWAP Deviation | -62.56% |
| Conf Score | 0 (1F) |
| Swing Age | 400 bars |
| Swing Type | BEAR |
| Stability | 0 / 2 |
| VP Recalcs | 735 total |
| Conv Status | Diverged 0% |
| Vol Comp | Expanded [25] 9% |
| Instr Tier | High Volatility (strict) |
| Dev Filter | FAIL | 62.56% (outside 3%) |
| SD2L Status | — (fires on zoomed/lower read, see Fig. 2) |
| Cantillon Flow | DISTRIBUTION |
| Lqd | Eq | Rsk | ✗ | ✓ | ✗ |
| Macro Bonus | -1 |
| Composite | +0 / 9 |
| VIX Layer | 1 | Low Fear (+) (16) |
| Leader | Equities |
| Transition | → Stable |
| Bd-Eq Corr | ⚠ STRESS RECOVERY 0.42 |
| WR (500) | 0 open | awaiting results |
Volume Structure Interpretation
The daily chart is the cleanest picture of what happened: a straight-line decline from the ~$440 highs of mid-2025 through a series of STRONG DIV distribution flags, a brief green STRONG DIV bull-divergence cluster in the $120–$190 range during Q1 2026 that failed to hold, and a final capitulation leg into the low $90s. The VWAP deviation of -62.56% against a still-falling AVWAP means the institutional reference point itself keeps resetting lower — this is not a level defended by buyers, it is a level abandoned by them, until today.
The one data point that breaks the pattern is the Bond-Equity correlation flag: ⚠ STRESS RECOVERY at 0.42 on the daily read, above the 0.35 threshold that neutralizes the Cantillon ACCUMULATION bonus. Compare this to the weekly (Normal 0.14) and the zoomed daily (Normal 0.31) — the daily timeframe alone is flashing macro stress. That divergence between timeframes is itself information: the stress reading is a short-horizon artifact of today's volatility spike, not yet a structural regime characteristic confirmed across the higher timeframe.
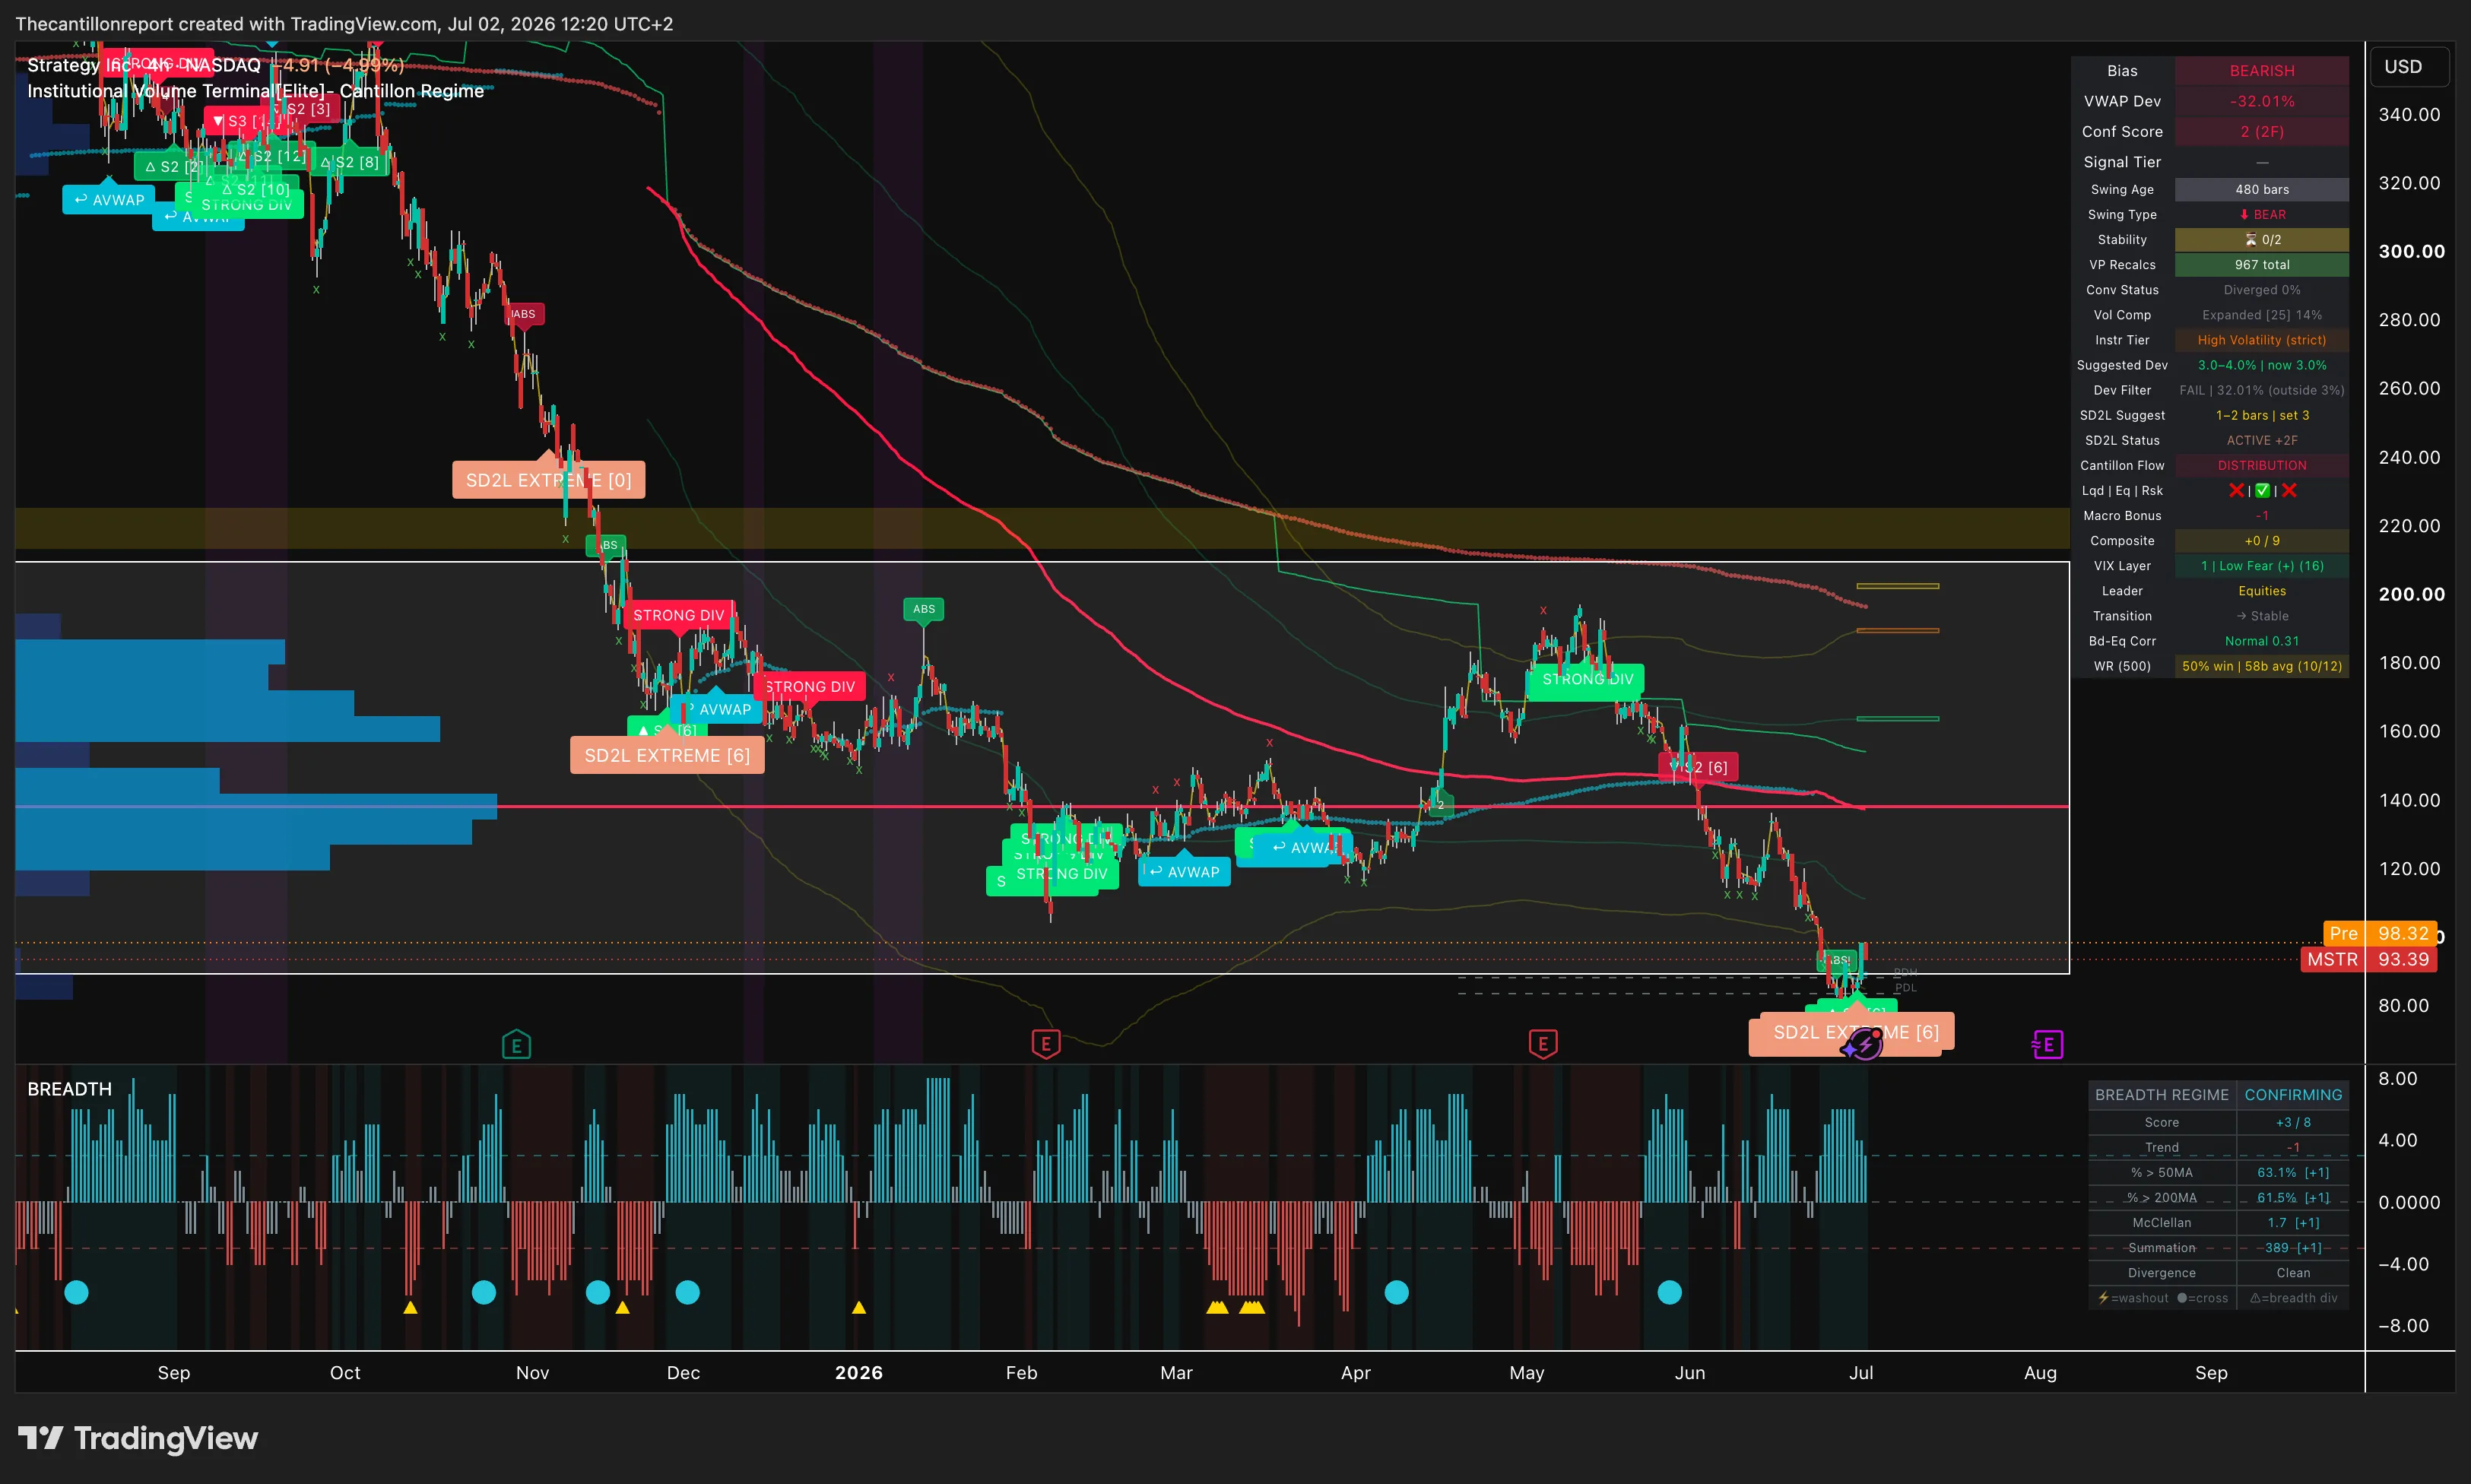
SD2L Extreme — The Signal Doing the Work Today
Per the IVT framework, SD2L Extreme is a mean-reversion snapback signal, not a trend signal — it exists specifically for moments like this one, where price has moved so far from AVWAP that the momentum-confirmation layer (Dev Filter) locks out entirely. The general SPX baseline for this signal is a strong 72% win rate with a +2% average 10-bar return. MSTR's own track record on this exact signal is materially weaker: 50% win, 10/12 closed. That gap matters — a leveraged, single-name Bitcoin proxy does not mean-revert as reliably as the index the base rate was built on. Treat the SD2L fire as a real, tradable signal, not as a guaranteed bounce. Size for a coin-flip with a favorable average, not for a 72% edge.
Stability remains 0/2 on every timeframe — the definitive anti-accumulation read. No institutional base has formed at any level on the way down, including the current one. That is consistent with a capitulation bounce (violent, fast, unconfirmed) rather than the start of a basing process (slow, absorptive, Stability-improving). The distinction matters for how long this trade is held.
Section 2: Fundamental Analysis — Is the Thesis Only Bitcoin?
The short answer: no. The long answer is that Bitcoin is 95%+ of what drives MSTR's price action — but the underlying architecture is more sophisticated than a spot BTC vehicle. This section carries forward the fundamental picture from the March 2026 report (last confirmed disclosure); no new 10-Q has been filed since, so treat the BTC holdings, cost basis, and revenue figures below as last-known, not as of today's print.
The Bitcoin Treasury Machine
Strategy holds approximately ~717,000 BTC acquired at a total cost of approximately $54.56 billion, at an average price of $66,385 per coin. The company's proprietary KPI is BTC Yield — the change in BTC-per-diluted-share over time. FY2025 BTC Yield was achieved at 22.8% against a 25% target, with an approximate $13.2B BTC $ Gain through the last reported period.
The financing structure remains the central mechanism: common stock ATM issuance, ~$8.2B in convertible notes, and a stack of preferred equity — STRK (8% coupon), STRF/STRIFE (10% coupon), and later series. The arbitrage only works while MSTR trades at a premium to its BTC NAV (mNAV). The last confirmed mNAV reading was ~1.15x in March 2026, already down from 3x+ at the November 2024 peak. With MSTR equity down a further ~26% since that reading and BTC itself under Cantillon RISK-proxy pressure (Rsk ✗ across all three timeframes today), mNAV has almost certainly compressed further — plausibly toward parity. The exact current ratio requires the next disclosed NAV mark; do not assume the arbitrage engine still has the fuel it had in March.
The Software Business — Underappreciated
The enterprise analytics segment generated approximately $490–510M in FY2025 estimated revenue, with subscription services growing 61.6% year-over-year off a legacy-license base. Strategy Mosaic — the AI-powered Universal Semantic Layer launched June 2025 — remains the flagship product, distributed in part through the HCLTech partnership (226,000+ professional services staff, 60 countries).
This business does not move the stock. It matters for two reasons that are more relevant today than they were in March: (1) it generates real operating cash flow independent of BTC price, and (2) in a scenario where mNAV compresses toward or through 1.0x, it is the difference between a company that can service its preferred and convertible obligations organically and one that is forced to sell BTC into a falling market to do so.
| Metric | Value | Context |
|---|---|---|
| Software Revenue (Q3 2025) | $128.7M | +10.9% YoY |
| Subscription Services (Q2 2025) | $40.8M | +61.6% YoY |
| Total Software Revenue (FY2025 est.) | ~$490–510M | ~5–6% YoY |
| FY2025 BTC Yield Achieved | 22.8% | vs. 25% target |
| FY2025 BTC $ Gain | ~$13.2B | Last reported YTD |
Balance Sheet & Capital Structure
| Balance Sheet Item | Value | Context |
|---|---|---|
| BTC Holdings (last disclosed) | ~717,000 BTC | March 2026 figure, carried forward |
| Total Cost Basis | ~$54.56B | $66,385 avg price/BTC |
| Convertible Notes (Debt) | ~$8.2B | Multiple tranches 2027–2030 |
| Preferred Stock Series | STRK 8% / STRF 10% / others | Fixed obligations |
| mNAV Premium (last confirmed) | ~1.15x (Mar 2026) | Likely compressed further since |
| Market Cap (at $93.39) | ~$31.9B | ~342M diluted shares |
| 52-Week Range (updated) | $93.39 – $457.22 | -79.6% from high |
| Shares Outstanding (approx.) | ~342M diluted | Including preferred converts |
The debt and preferred structure remains the primary institutional risk. $8.2B in convertible notes maturing 2027–2030 convert cleanly if BTC holds well above current levels at maturity; if not, Strategy refinances or pays cash. The preferred stack (STRK 8%, STRF 10%), with a heavily retail holder base, creates fixed cash obligations that sit ahead of common equity — and a retail-heavy yield-seeking holder base is the more likely source of forced selling in a drawdown than an institutional one.
Section 3: Strategic Catalysts & Risk Architecture
The Bull Case: The Snapback Has Started
SD2L Extreme Is Already Firing. Unlike the March report, where the setup was "COILED and waiting," today's setup is live: ACTIVE +2F, and price has already moved +13.46% off the weekly low and +5.4% further in pre-market. The mean-reversion engine does not need a future catalyst to work — it is working right now. The question is duration and magnitude, not whether it starts.
Breadth Is Not Confirming the Damage. Broad market breadth reads CONFIRMING across every timeframe (Score +3 to +6/8, McClellan positive, clean divergence). MSTR's collapse to a 52-week low is idiosyncratic — a function of its own leverage and mNAV compression, not a broad risk-off market dragging every equity down with it. A name falling in isolation while the tape holds up is a more repairable technical situation than a name falling with the market.
BTC Yield Compounding, If mNAV Holds Above Parity. As long as Strategy trades above 1.0x mNAV, the equity-for-BTC arbitrage still functions, even at reduced scale. The 21/21 plan's multi-year capital deployment continues to compound BTC-per-share exposure through the drawdown, positioning existing holders for outsized leverage if BTC itself turns.
The Bear Case: The Regime Has Not Confirmed a Bottom
Every Trend Metric Still Reads Bearish. Bias BEARISH, Composite +0/9, Cantillon Flow DISTRIBUTION, Stability 0/2 — all three timeframes, unchanged by today's bounce. A one-day (or one-week) snapback inside a structurally bearish regime is, by the IVT framework's own definition, a counter-trend trade, not a reversal confirmation.
MSTR's Own SD2L Track Record Is a Coin Flip. 50% win, 10/12 closed. This is the single most important risk-management fact in this report. The generic 72% SPX baseline for this signal does not transfer to a 3–5x leveraged, single-name proxy. Half of MSTR's own SD2L Extreme fires have failed.
mNAV Compression Toward Parity. If mNAV breaks below 1.0x, the equity-issuance-to-buy-BTC flywheel stops entirely — removing the mechanism that has driven per-share BTC growth since inception. This is a structural, not cyclical, risk, and it gets closer with every additional point of decline in the equity price relative to BTC.
Daily-Timeframe Stress Flag. The Bd-Eq Corr reading of 0.42 (STRESS RECOVERY) on the daily chart, even while the weekly and zoomed reads remain Normal, is worth monitoring into the next session — if it persists and spreads to the higher timeframe, it neutralizes any developing ACCUMULATION read and keeps Cantillon Flow anchored in DISTRIBUTION regardless of price action.
Section 4: Volume-Fundamental Convergence Assessment
| Dimension | Volume Structure | Fundamentals | Status |
|---|---|---|---|
| Near-Term Direction | SD2L snapback ACTIVE +2F, +13.46% wk | No new fundamental catalyst | WATCH |
| Trend Structure | BEARISH, Composite +0/9, all TF | DISTRIBUTION Cantillon Flow | ALIGNED |
| Volume Base Formation | Stability 0/2, no accumulation confirmed | mNAV likely compressing toward parity | DIVERGED (both bearish) |
| Macro Context | Breadth CONFIRMING, VIX Low Fear | Broad tape healthy; MSTR idiosyncratic | NEUTRAL |
| Signal Reliability | SD2L: 50% WR on MSTR (10/12) | Leverage amplifies both directions | WATCH |
The convergence picture today is cleaner than the March "COILED and waiting" setup, but not more bullish. In March, the compression had not resolved — direction was unknown. Today, direction has resolved: down, hard, to a fresh low, followed immediately by the framework's designated mean-reversion response. That is not a new bull thesis; it is the expected mechanical behavior of an oversold signal doing its job inside an unchanged bearish regime.
Section 5: Position Management Framework
Structural reference levels from the IVT volume profile — not trade recommendations.
| Level | Price / Trigger | Significance |
|---|---|---|
| SD2L Extreme Zone | ~$91 – $95 | Where the ACTIVE +2F signal fired — reference, not a fresh entry price after the bounce |
| Pre-Market / Current | $98.45 | +5.4% above Tuesday's close |
| First Resistance Shelf | ~$104 – $110 | Prior 52-week low / PDL — first real overhead test |
| Structural Resistance | ~$120 – $130 | Q1 2026 failed STRONG DIV bull-divergence cluster |
| Invalidation | Daily close < $91 | Below the SD2L print — signal failure, no shelf beneath |
| Bull Trigger (L1) | Daily Bd-Eq Corr back under 0.35 | Removes the STRESS RECOVERY flag currently unique to the daily read |
| Bull Trigger (L2) | Stability improves off 0/2 on any timeframe | First evidence of actual base formation, not just a bounce |
| Bull Trigger (L3) | Composite flips positive from +0/9 | Regime-level confirmation — the condition this report has not yet met |
There is no volume shelf below $91 in this dataset — the July 2 print is a fresh 52-week low into open air. That is precisely why the invalidation is tight and mechanical: a daily close back below the SD2L print is a clean signal failure, not a level to average into. Above $104–$110, the trade is fighting the prior 52-week floor turned resistance; above $120–$130, it is fighting the same supply that killed the Q1 2026 bounce attempt.
None of the three bull triggers above have fired yet. This report is a snapback read, not a bottom call. Treat the position accordingly: the SD2L signal earns a trade on its own mechanical terms, sized for its 50% MSTR-specific win rate, with the tight invalidation below $91 doing the risk management the regime itself is not yet willing to do.