Institutional Order Flow — Not Signals
Institutions move markets in a sequence — liquidity first, then equities, then risk. By the time price confirms your setup, the institutional position is already built. The IVT Terminal maps that sequence in real time, so you know whether you're entering with the flow or walking into their exit.
Each call below was posted on Substack before the position was taken. Entries, signals and outcomes, winners and losers. No cherry-picking, no hindsight.
How to read this. These are individual call returns, not a portfolio return. Each figure is the result of one position measured on its own, so they are not added together. Position sizing is your own decision and no capital base is assumed. Twelve calls remain open and are excluded from every figure above. Open calls are not marked to market here and are closed when price breaks the AVWAP anchor on either side. Returns are concentrated: the five best calls account for roughly half of the total gain. Past results do not indicate future performance.
Institutional liquidity follows a predictable sequence: from central bank reserves, through bonds, into equities, risk assets, and finally crypto. Knowing where in that sequence the flow currently sits tells you what's next — before price reflects it.
Macro LayerPrice above AVWAP = buy dips. Price below AVWAP = sell rallies. This one rule, applied with discipline, eliminates the majority of counter-trend losses that destroy retail accounts. The regime is the filter. Everything else is noise.
Primary SignalVolume Profile, CVD, compression readings, and confluence scoring reveal what institutions are doing — not what retail thinks they're doing. Distribution looks like rallies. Accumulation looks like weakness. Volume tells the truth that price conceals.
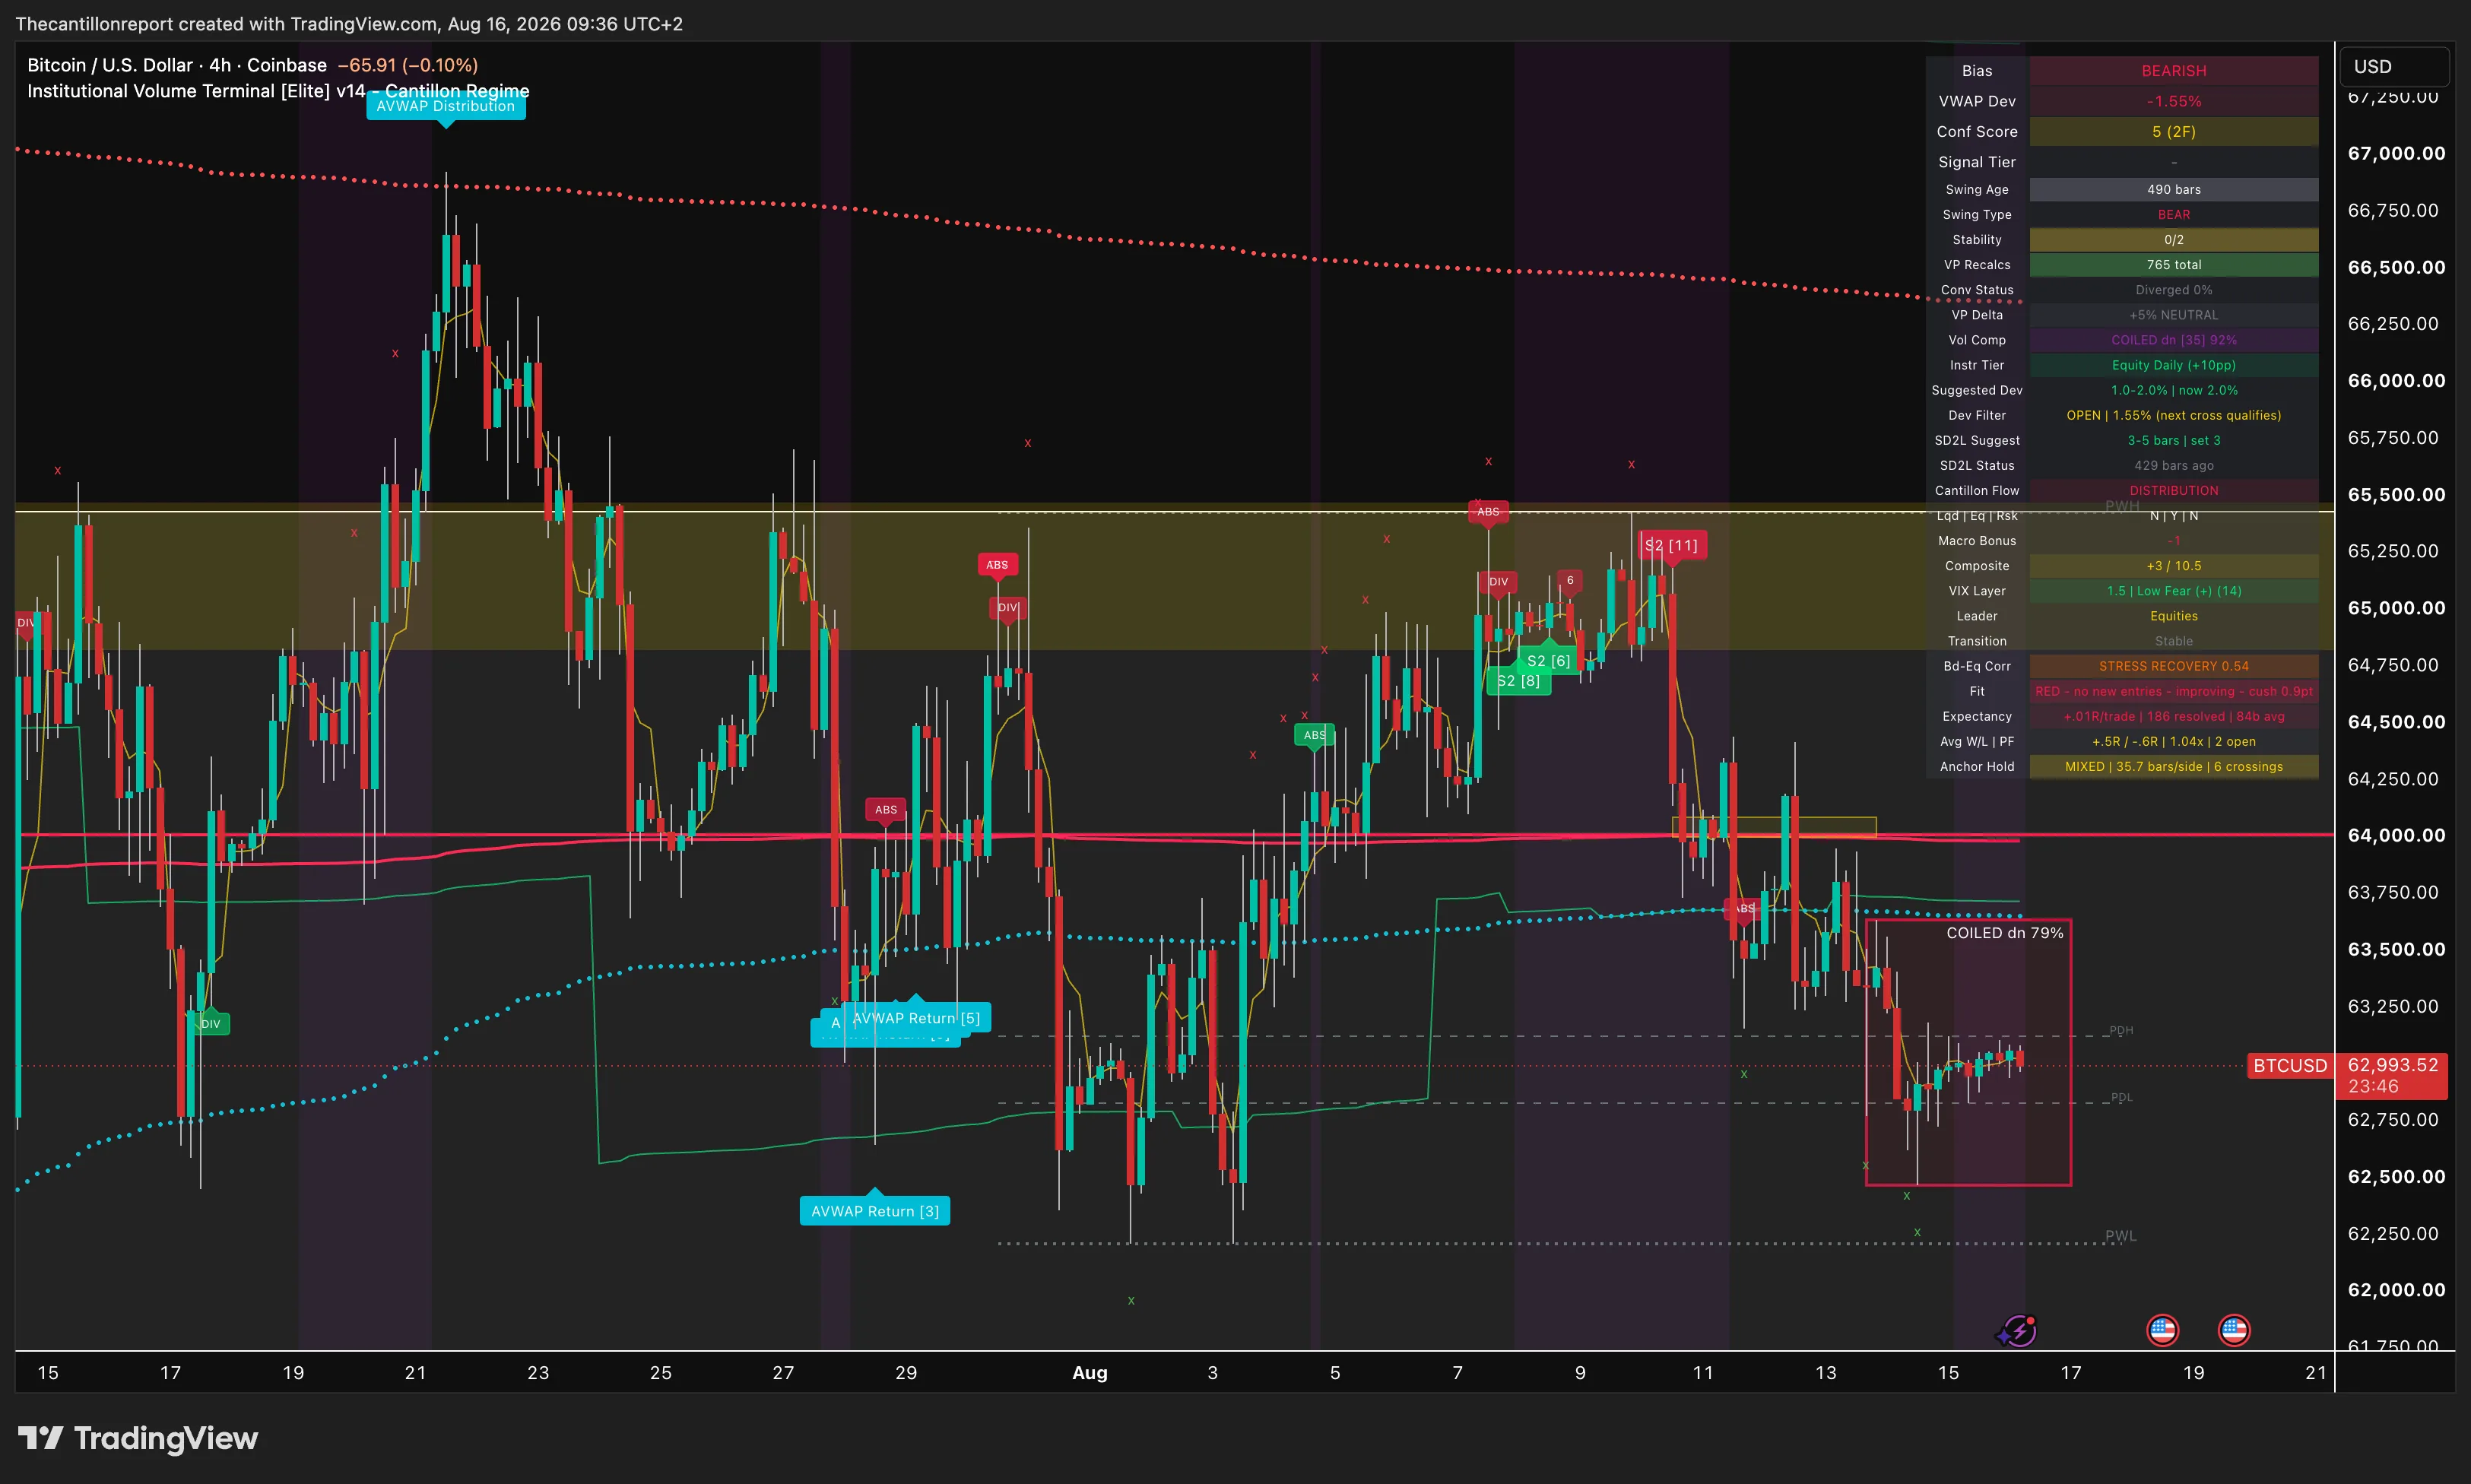
Execution LayerEvery session: regime classification, AVWAP deviation across 40+ instruments, volume compression, and Cantillon flow state — all in one view.
Updated every session. Available to Monthly and Yearly subscribers.
Access the IVT Terminal →Volume Profile, CVD, Anchored VWAP and the deviation zones. How each one works, how they interact, and how institutions use them to position before price moves. Written for traders who already read a chart and want to read the flow underneath it.
Every paid subscriber gets it. Monthly is $39 and the book is $39, so subscribing costs the same as buying it once and includes the daily brief, the IVT indicator and the full archive.
IVT Indicator on TradingView + daily Cantillon brief applied to 100+ instruments every session. Monthly for ongoing access. Yearly adds Elite Research Reports. Lifetime for those who want it once.
Full daily intelligence — IVT indicator access and the Cantillon brief applied to live markets every session. Cancel anytime.
Everything in Monthly — plus IVT Elite Research Reports: deep institutional convergence analysis on high-conviction setups, delivered as full PDF reports.
Everything in Yearly — paid once, accessed forever. No recurring charges, no Substack required. Processed directly via Stripe.
Coinbase presents one of the most compelling structural divergences in markets today — but not in the direction most investors expect. The company is building the definitive infrastructure layer for the next financial system. The long-term thesis is real. The problem is timing.
The VWAP deviation of -2.91% appears modest compared to Bitcoin's -11.81% or Solana's -45%, but this metric must be contextualized. COIN's AVWAP has been resetting lower as the bearish swing matures meaning the institutional reference point itself has been moving down. A -2.91% reading against a falling AVWAP is not the same as -2.91% against a stable one. Below $157.20, the bearish thesis accelerates. The gap between $157 and $139 represents a thin-volume zone similar to air pockets identified in Bitcoin's structure.
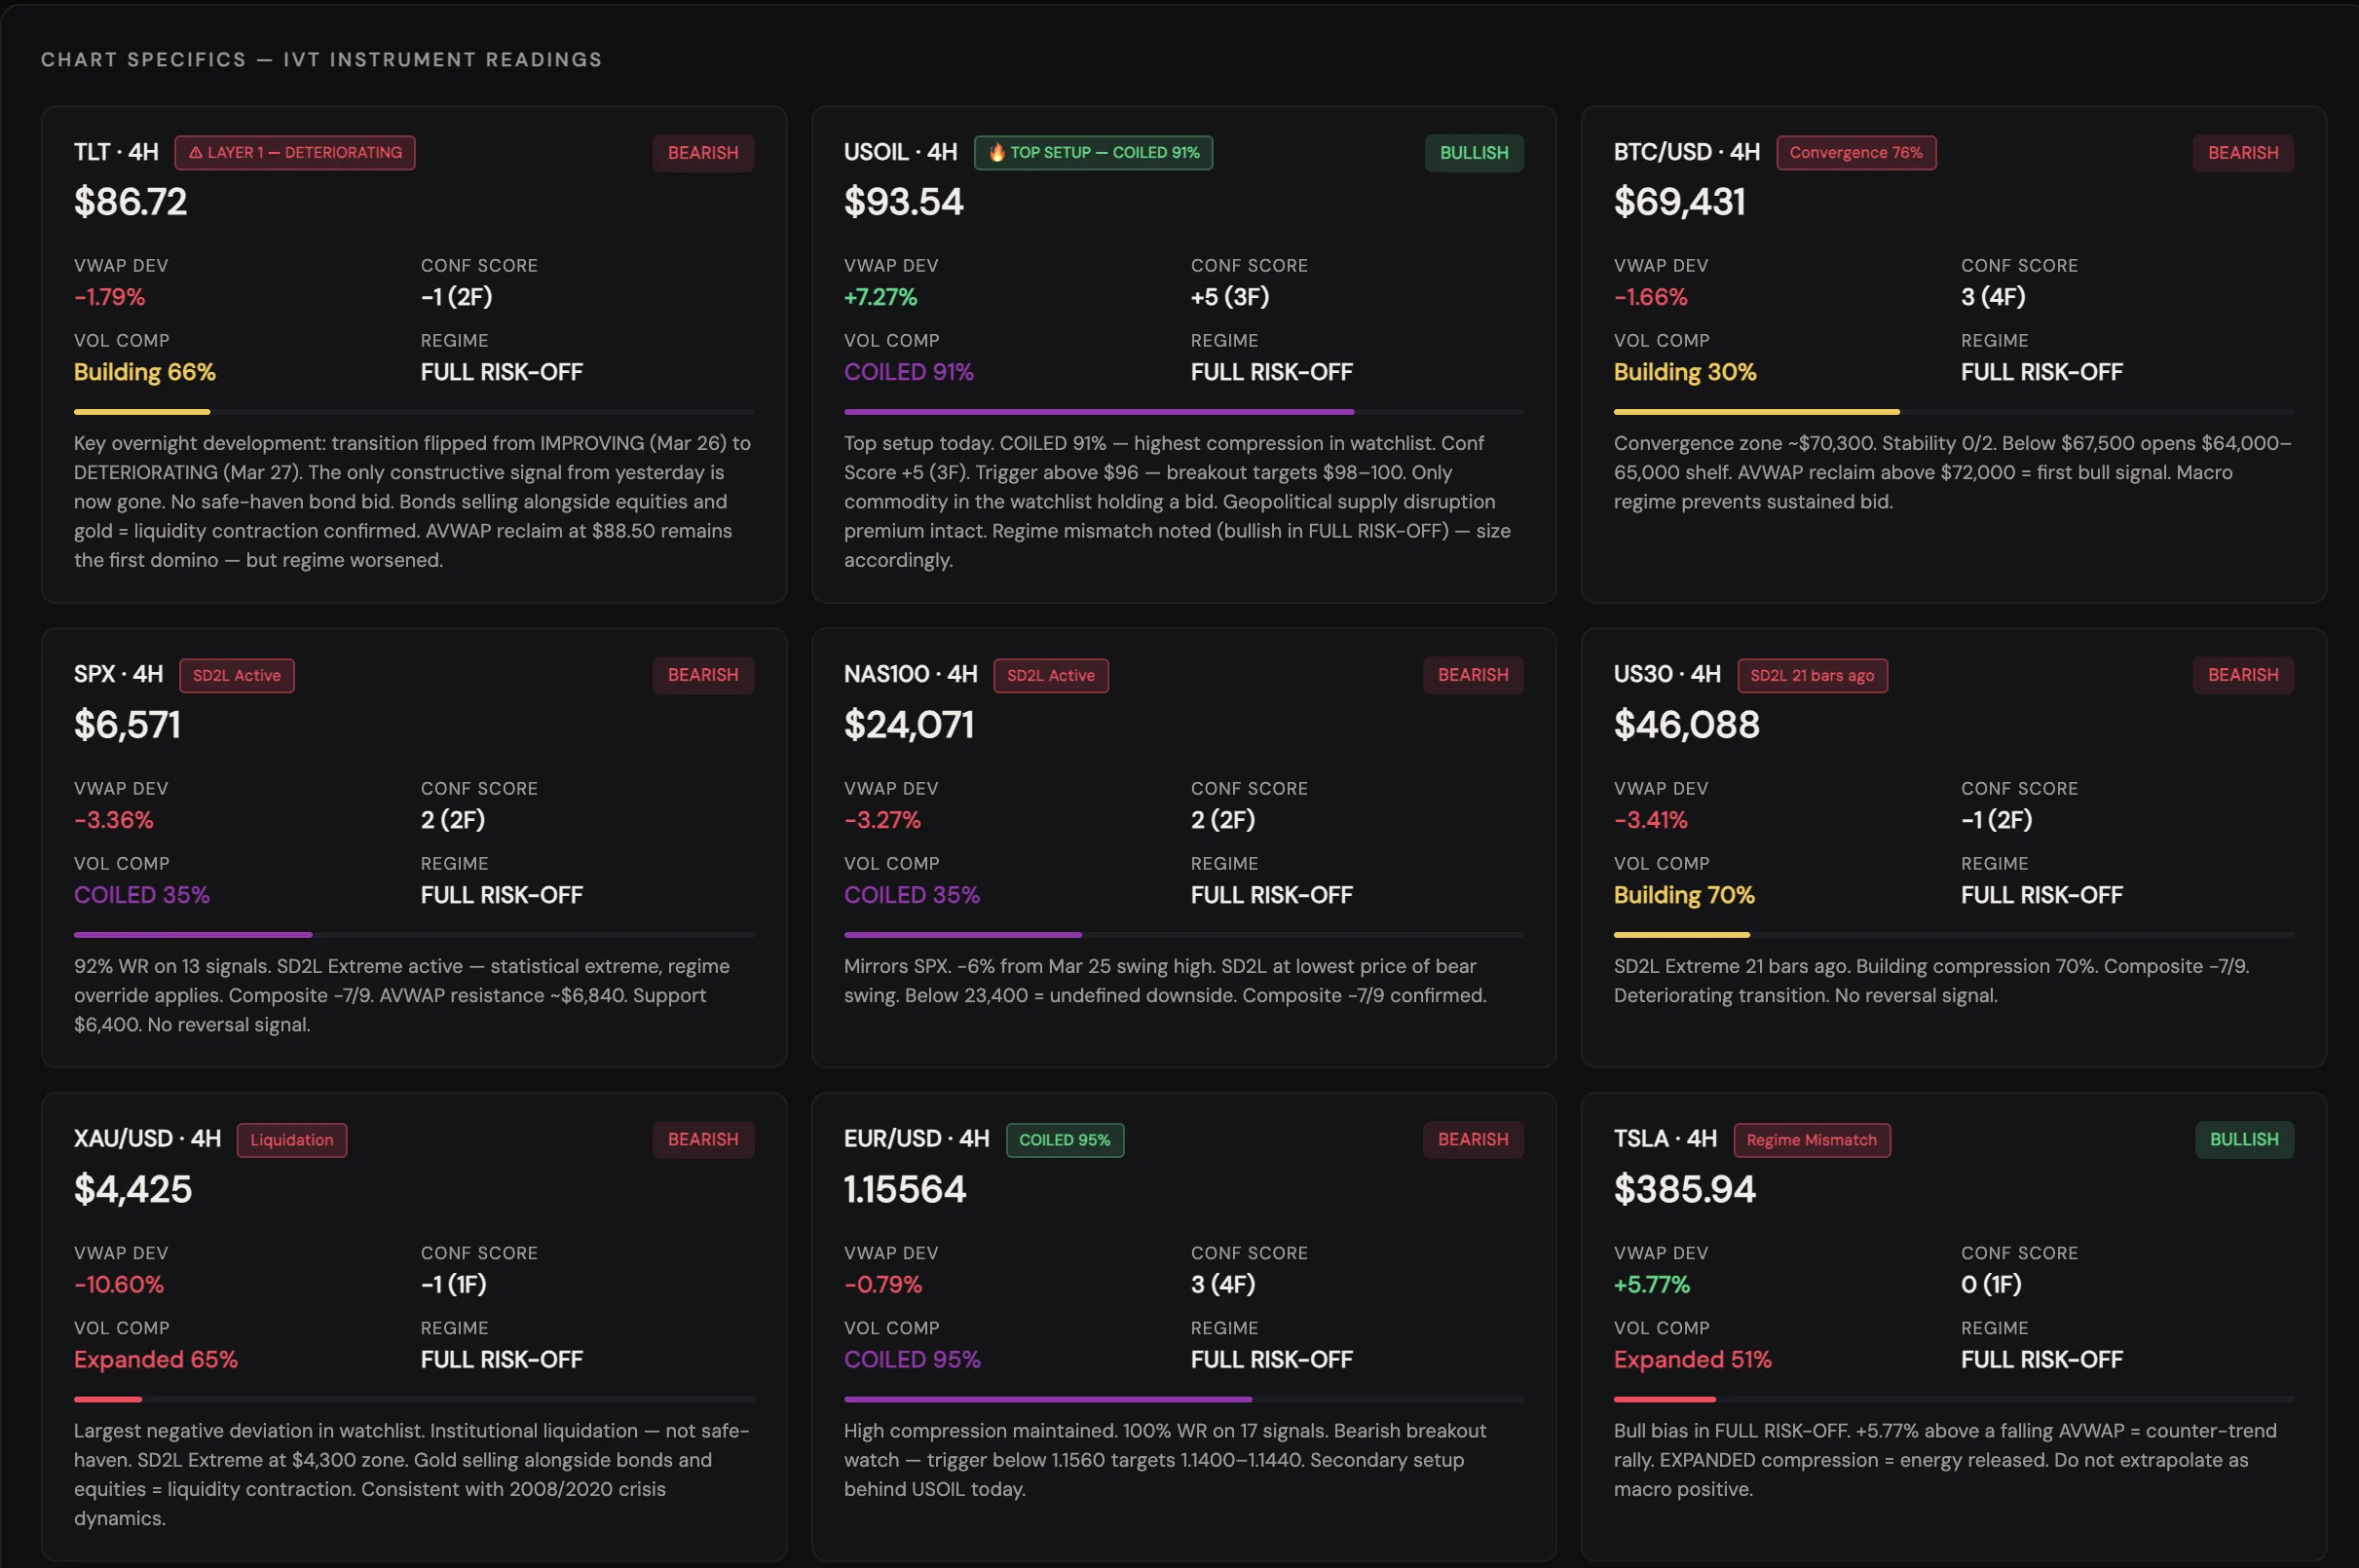
Every parameter from the live terminal — VWAP deviation, confluence score, volume compression, stability readings, Cantillon flow state — contextualized for the specific instrument.
Where volume structure and business fundamentals align or diverge. When both point the same direction, conviction is high. When they diverge, the analysis tells you why and what to watch for regime confirmation.
IVT targets, structural support, risk levels, and the specific triggers that would change the assessment. Not predictions — probability-weighted scenarios with defined conditions for each outcome.
Every report maps the current Cantillon state and how far the liquidity flow has — or hasn't — reached the asset being analyzed. This is the macro filter most analysts completely miss.
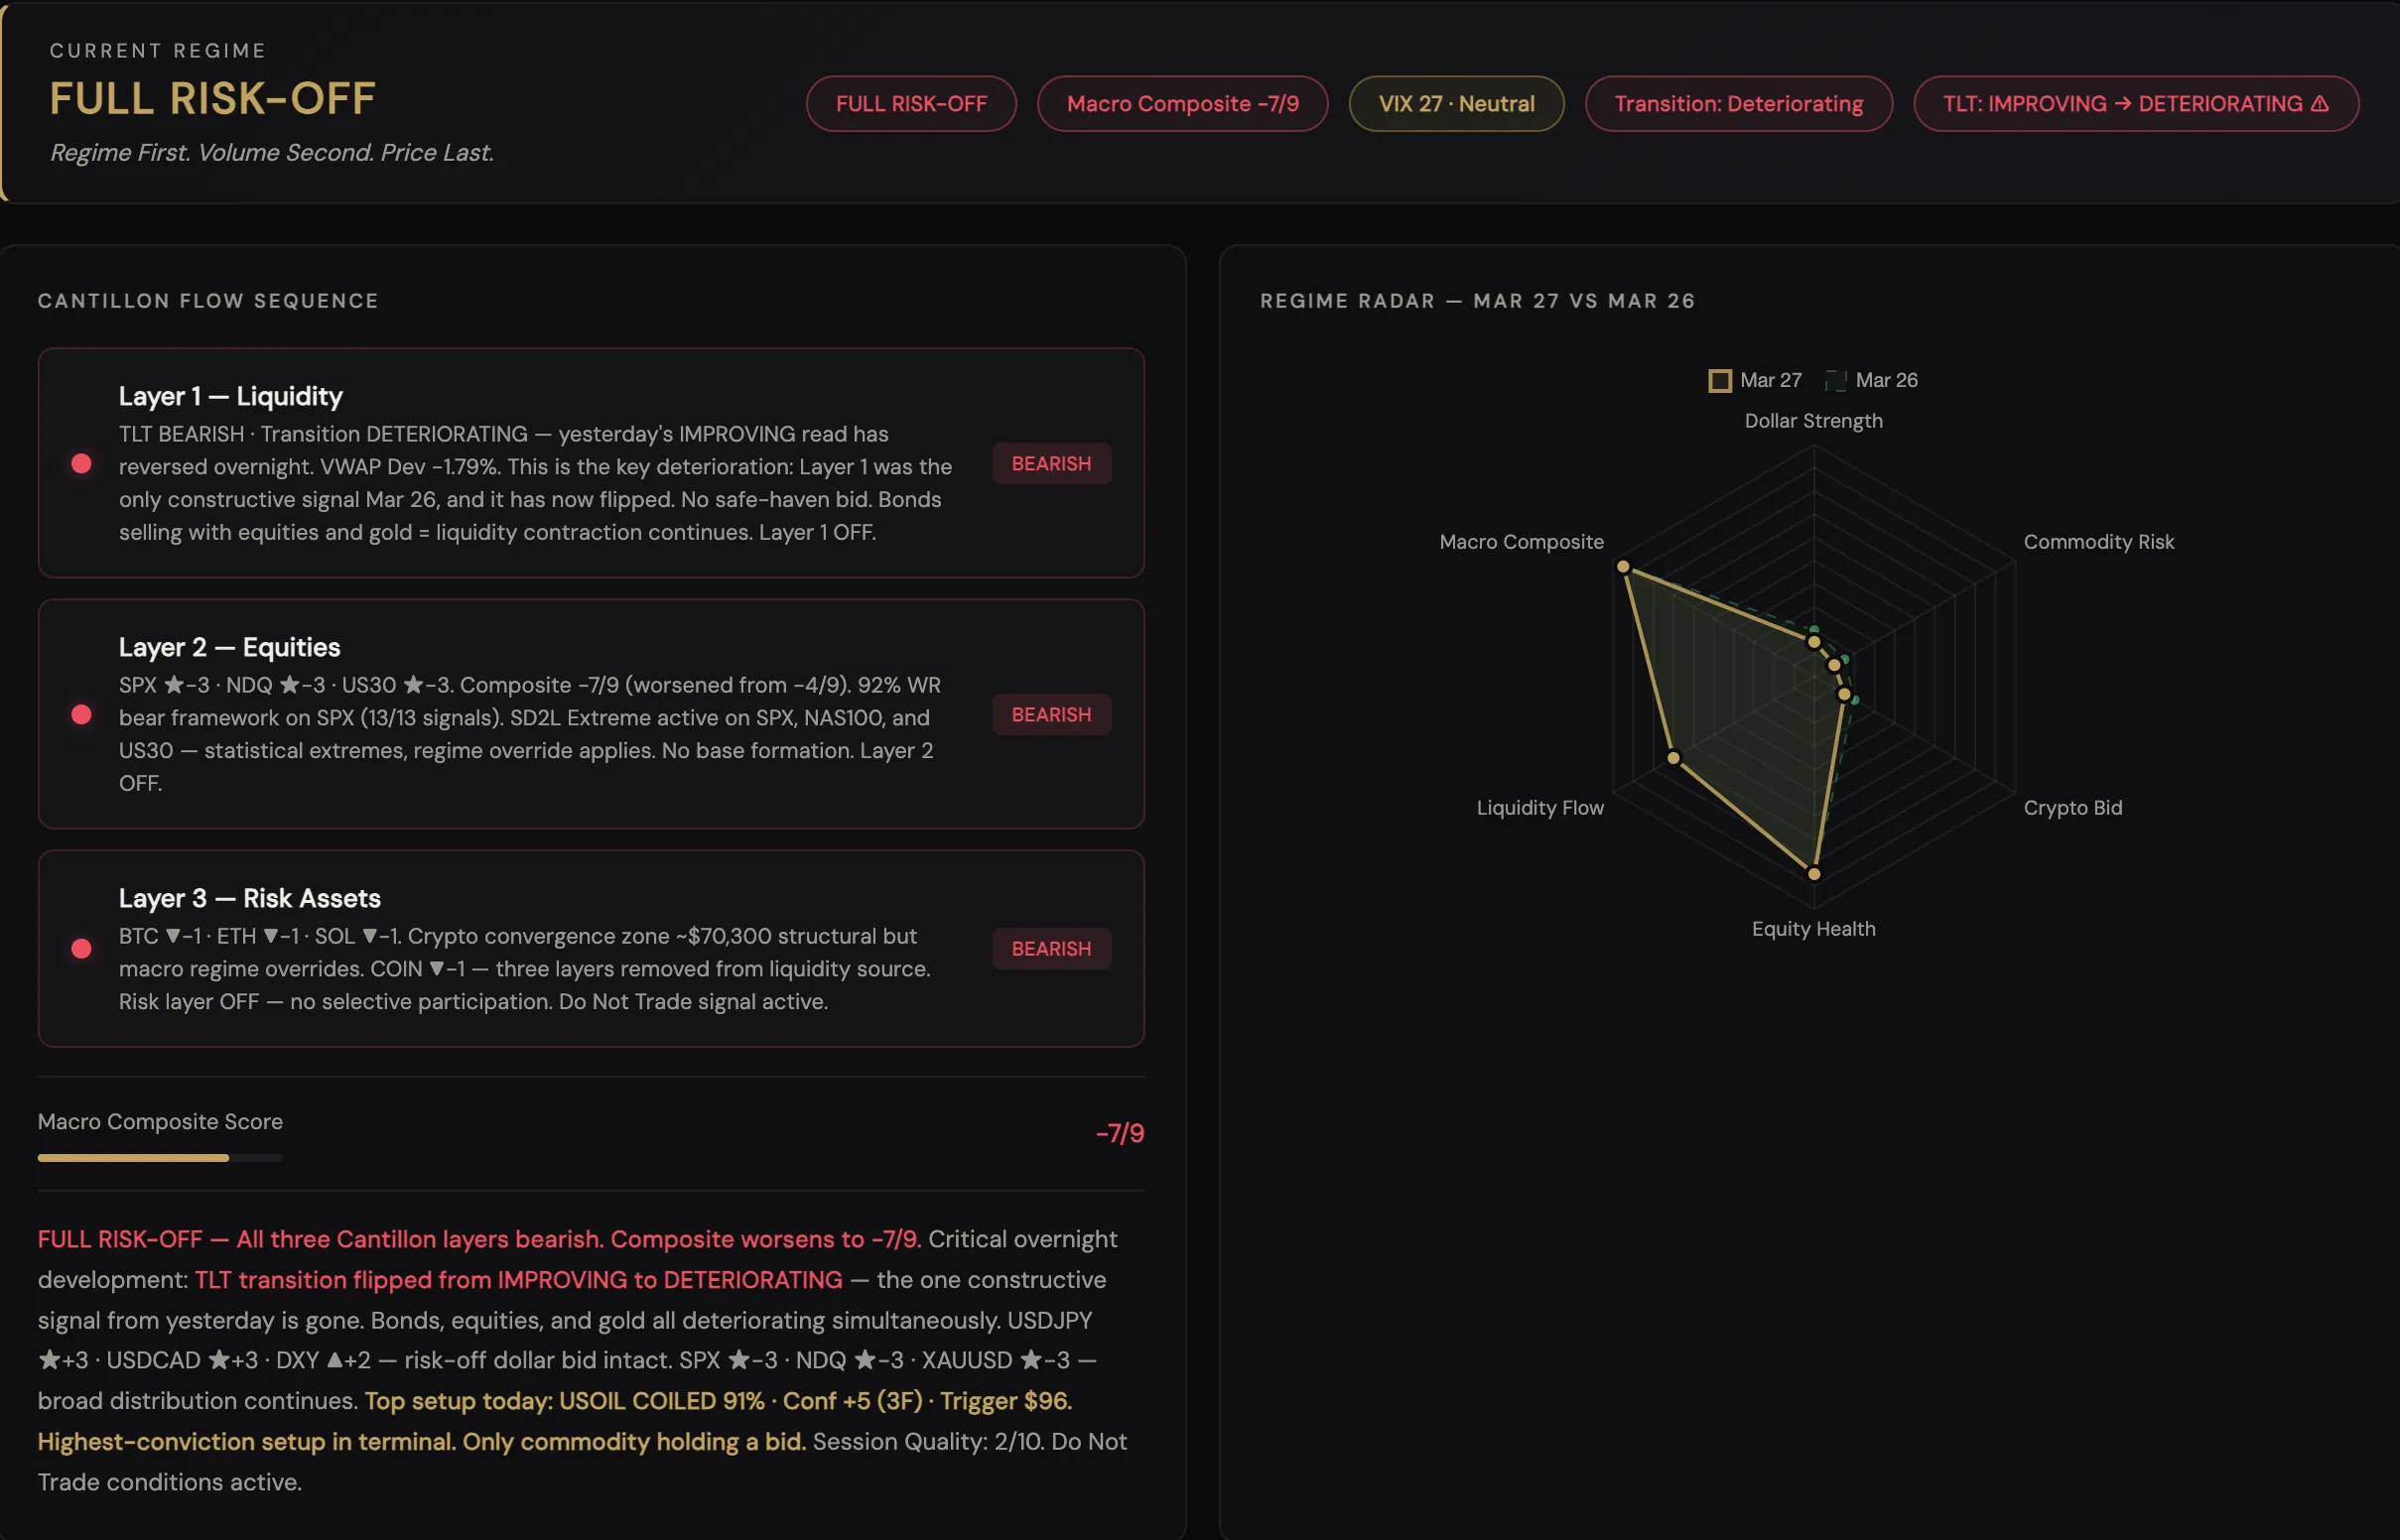
This is what subscribers receive every morning — regime state, instrument readings, and the one setup the IVT Terminal is flagging. No predictions. Just structure.
Free signup includes The IVT Regime Playbook — the 9 regime states and how to trade each one. No spam. Unsubscribe anytime.
I started in 2000 and shorted my way through the dot com bust. It worked, so I decided I was very good at this. Then the market bottomed in 2003 and I did not. I stayed short, month after month, and lost the account.
What rebuilt it was a mentor in Copenhagen who handed me charts with the price stripped out. No open, no close, no patterns. Just where volume had traded and how much sat at each level. Price tells you where the market is. Volume tells you where it agreed. Those are not the same thing.
That principle is now the Institutional Volume Terminal, v14: anchored VWAP with deviation bands, delta weighted volume profile, cumulative volume delta, a compression layer, and a macro regime overlay built on the Cantillon Effect. It tracks 100+ instruments every session. The method is simple to state and hard to hold: regime first, volume second, price last.
The Institutional Volume Terminal is a proprietary TradingView indicator (v14) combining AVWAP regime classification, Delta-Weighted Volume Profile, Cumulative Volume Delta, Cantillon Flow scoring, and a multi-factor confluence engine. It runs on any instrument and timeframe available on TradingView.
The daily brief and indicator are designed for traders who already understand basic market structure. If you're newer to institutional analysis, start with the free newsletter — each brief walks through the methodology applied to live markets, which is the fastest way to learn it in context.
The IVT tracks 100+ instruments across equity indices (S&P 500, NASDAQ, DAX), commodities (Gold, Oil, Silver), crypto (BTC, ETH, SOL), FX (EUR/USD, DXY), and individual equities including the MAG7 and high-conviction individual names.
Monthly gives you the daily application — the indicator, daily brief, and live regime readings. Yearly adds the deep-dive Elite Research Reports: fundamental analysis, volume–fundamental convergence assessments, institutional cost basis mapping, and full position management frameworks for specific high-conviction instruments.
No. All content is educational and analytical in nature. The IVT Terminal identifies structure and regime — it does not make trading decisions. You apply the framework to your own situation, risk tolerance, and capital. Always trade responsibly.
Yes. Monthly subscribers can cancel anytime — no lock-in, no questions. Yearly access runs for 12 months from purchase. Lifetime is a single payment with no recurring charges and no Substack account required after setup.