Most traders have VWAP on the chart. Very few have thought about where it starts.
That sounds like a detail. It is the whole thing.
Session VWAP resets at every open. What it prints is the average price paid today, weighted by volume. That is useful if you are scalping the next two hours. It is close to useless if you want to know what a fund that has been building a position since April is thinking.
Because the fund did not start buying at 9:30 this morning.
The anchor is the question
Anchored VWAP lets you pick the starting point yourself. Choose a date, and the line becomes the volume-weighted average price paid by everyone who transacted from that moment forward.
Choose the right moment and that line approximates somebody's cost basis. Choose a random moment and you have drawn a squiggle.
The moments worth anchoring to are the ones where a lot of capital made a decision at the same time:
- the swing low of a selloff, where accumulation happened
- the swing high of a rally, where the last buyers got filled
- an earnings gap
- a macro event that reset how everyone was positioned
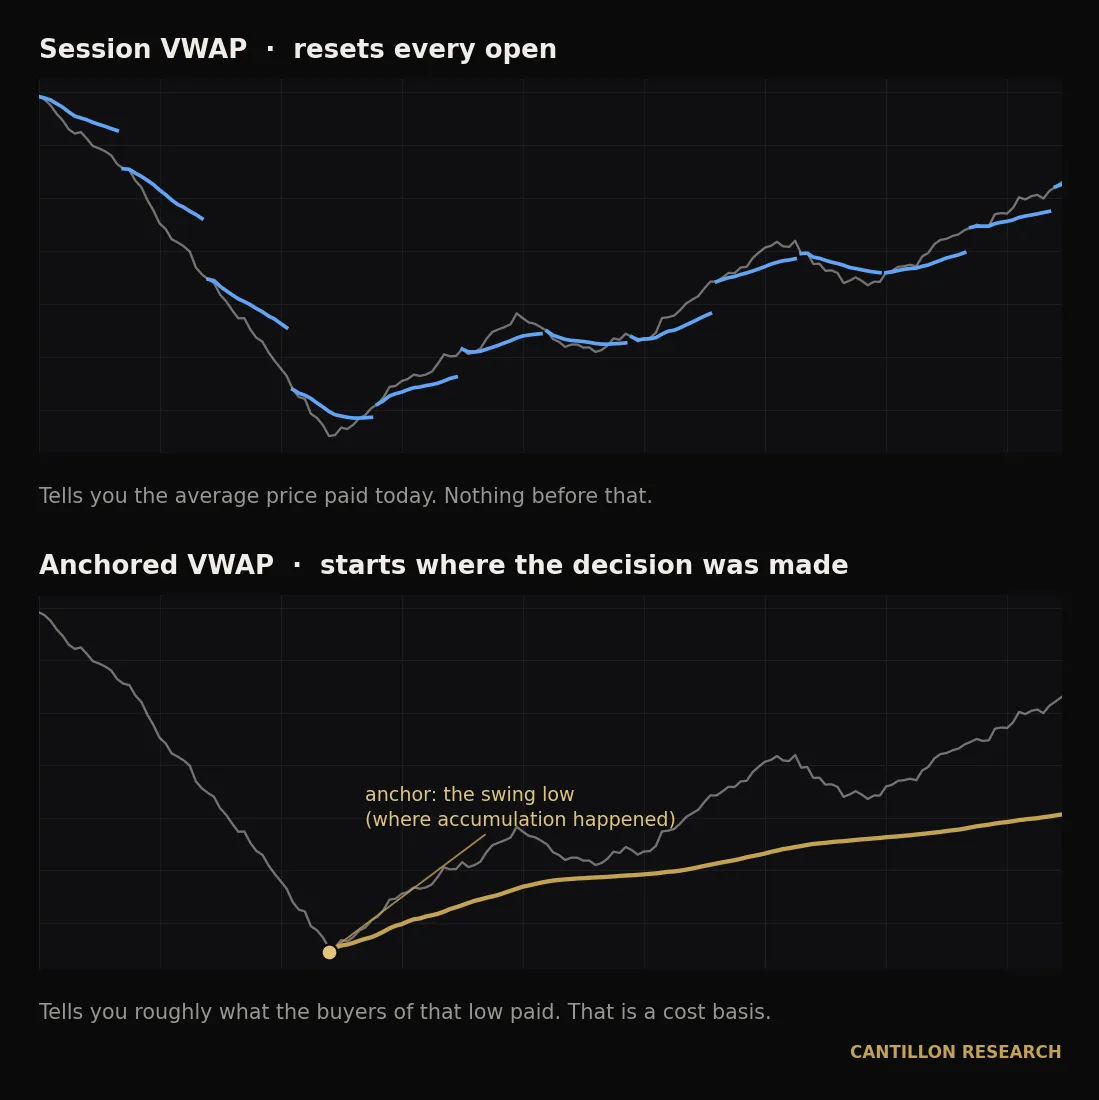
Anchor to the low of a flush and the line tells you roughly what the buyers of that flush paid. Anchor to the high of a failed rally and it tells you what the trapped longs paid. Same tool. Completely different information.
Why a cost basis line behaves differently than an average
A moving average is a smoothing function. It has no memory of who did what. Price crossing it means arithmetic changed, nothing else.
An anchored VWAP from a real event is different, because there are people sitting on the other side of it.
When price comes back down to the level where a large buyer accumulated, that buyer has two options. Defend the position, or fold it. There is no third choice. So the behaviour at that level is a readout on institutional resolve, and you get to watch it happen in the volume.
The mistake almost everyone makes
They redraw the anchor when the line stops working.
Price breaks below, the level looks wrong, so the anchor gets moved to a more flattering low. Now the chart agrees with the position again. This is the technical-analysis version of moving the goalposts, and it is the single most common way anchored VWAP gets misused.
The fix is to make the anchor a rule instead of a judgement call.
My own version: anchor to the lowest low of the past 500 bars, and let it roll. It only moves when a genuinely lower low prints. There is no discretion in it, which means the line is never adjusted to suit an open position. On the daily chart that is roughly two years of context. On a 4-hour crypto chart it is a few months. The lookback stays the same, the meaning scales with the timeframe.
That line is doing two jobs at once. It confirms the trend, and it gives you the level.
What this looks like in practice
Here is the sequence that matters, and it has three parts. All three have to be true.
Structure. Price has been holding above that rolling anchor consistently, not just poking above it once. Seven of the last ten closes above is a reasonable bar.
The pullback. Price comes back down and touches or briefly breaches the line. Most traders see this as the trend breaking.
The reclaim. Price closes back above the anchor, and it does it on at least average volume, with the anchor itself still rising.
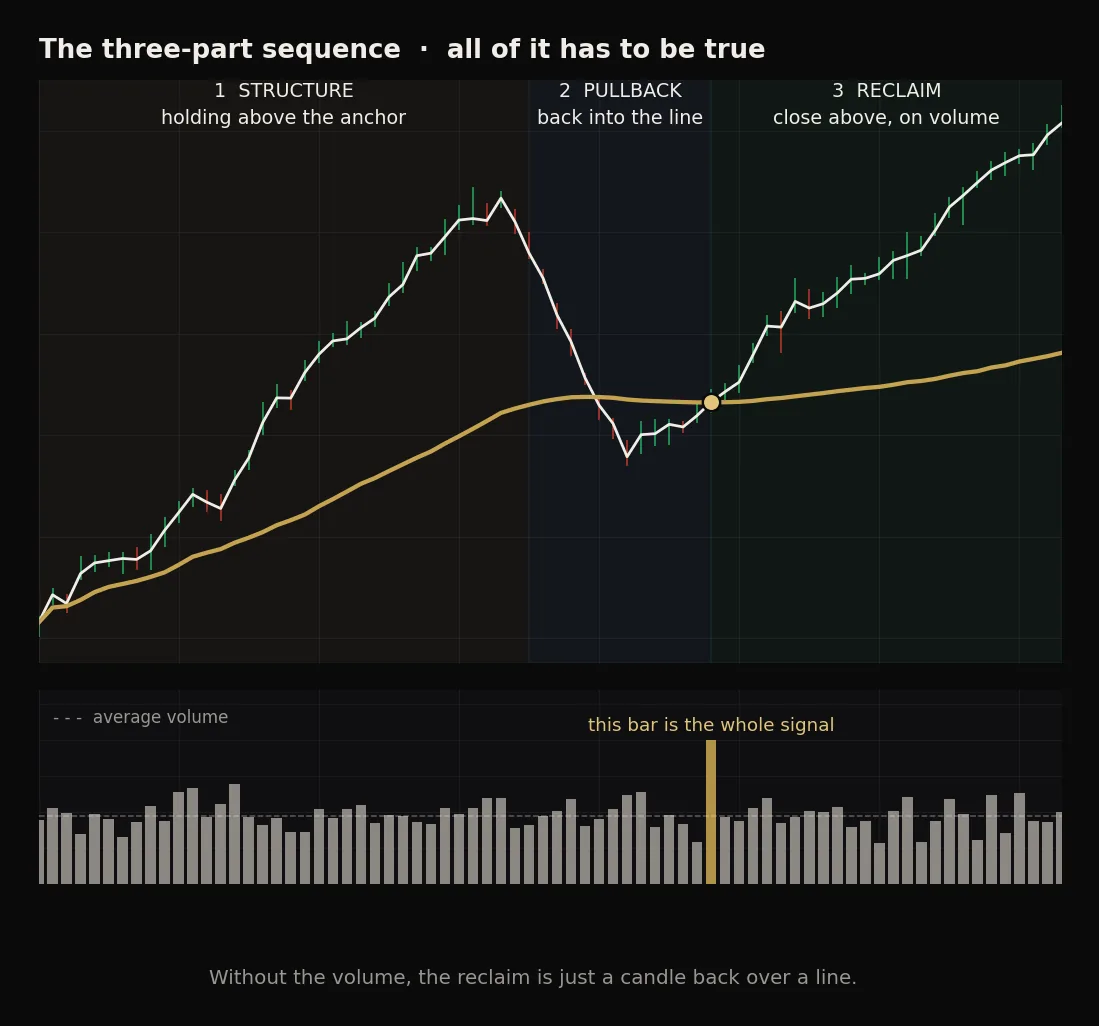
The reclaim is the part people miss, because by the time it happens the candle already looks unremarkable. What actually happened is that price went back to where the institutional buyer's cost basis sits, and that buyer added rather than sold. Volume is how you tell the difference between an add and a dead-cat bounce back over a line.
If the reclaim comes on below-average volume, it is noise. Same shape, no participation, no information.
What to do with this
Pull up any liquid name on the daily. Anchor a VWAP to the lowest low of the past two years and leave it there. Do not adjust it. Then go back through every time price returned to that line and ask one question: what did volume do on the bar that reclaimed it?
You will find that the reclaims on real volume behaved very differently from the ones on nothing. That distinction is available to you for free, on any chart, right now.