The prop firm business model is not a conspiracy. It is a sizing problem.
Around 90% of traders fail the challenge. On the tighter accounts you are asked to make 1.67 times what you are allowed to lose. That is arithmetic, and arithmetic is fixable.
A firm charging $150 for a $50,000 evaluation, with 10,000 applicants a month, collects $1.5 million before a single trade is placed on a live book.
That is the industry in one line. The dominant revenue stream at a challenge-model prop firm is evaluation fees and resets, not trading profits. Published pass rates sit between 5% and 10%. Some firms report that only about 1 in 20 applicants clears the evaluation, and once you account for funded traders who never reach a withdrawal, the share who actually collect a payout is closer to 1 or 2 in 100.
People read those numbers and conclude the game is rigged.
It is not rigged. It is priced. The firm has run the distribution and knows what fraction of applicants will breach a rule. The rules exist because a firm that lets clients size freely goes bust the first time one of them blows up a real book.
Which means the rules are a specification. And a specification can be engineered against.
It also means the fee can be a bargain, but only under a condition most buyers never check. I will do that arithmetic further down.
Most guides quote the loose end of the range: 5% daily, 10% max drawdown. That is FTMO and the classic two-step model, and it is the friendliest structure in the industry.
The accounts most people actually buy in 2026 are tighter than that. Here is where the current programmes sit:
| Programme | Target | Daily loss | Max drawdown | Type |
|---|---|---|---|---|
| FTMO two-step | 10% | 5% | 10% | Static |
| FundedNext Stellar one-step | 10% | 3% | 6% | Static daily, trailing max |
| Blue Guardian | 10% | 3% | 6% | Trailing |
| H2T Alpha One | 10% | 3% static | 6% | Trailing |
| The5ers Hyper Growth | varies | 5% | 6% | Relative to equity high |
| Topstep 50K Combine | $3,000 (6%) | $1,000 (2%) | $2,000 (4%) | Trailing, end of day |
Note what happened to the shape of the problem when the industry moved to one-step.
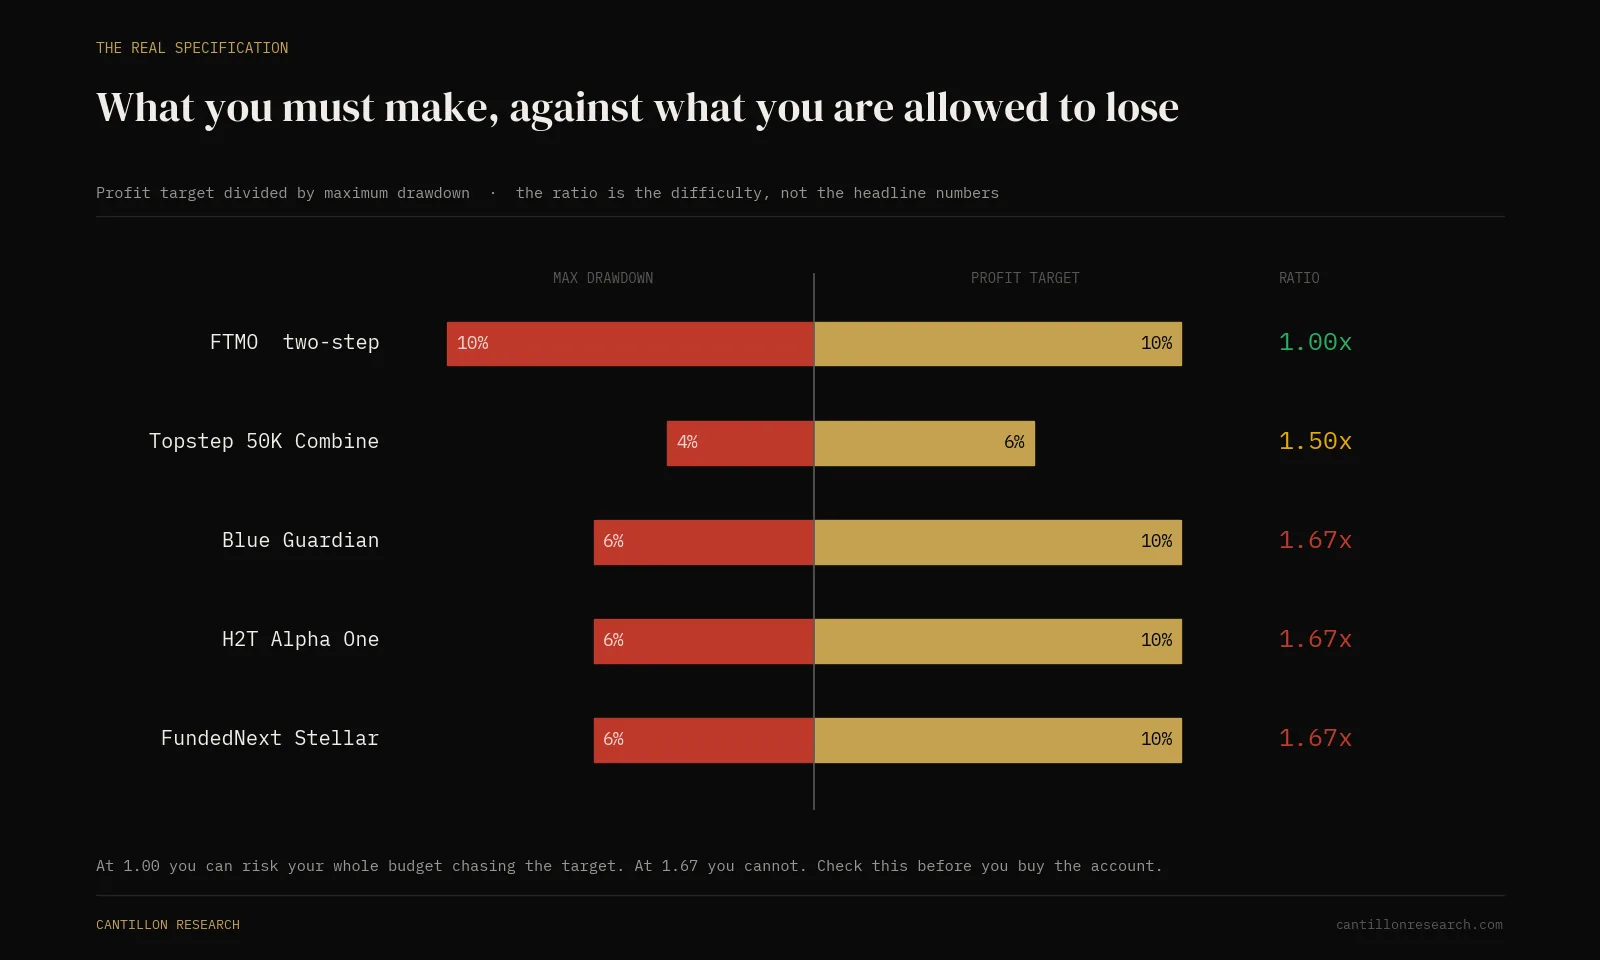
FTMO gives you 10% to make and 10% to lose. You are allowed to risk your entire budget in pursuit of the target. That is a 1:1 gauntlet.
The one-step accounts give you 10% to make and 6% to lose. You now have to produce 1.67 times your entire risk budget in net profit before you are allowed to keep any of it. Topstep is 6% to make against 4% trailing, which is 1.5x. And the Topstep trailing maximum loss limit is described by the firm as the only hard rule in the Combine: hit it and the account closes permanently, no appeal.
That ratio is the real specification. Not the target. Not the drawdown. The relationship between them.
Target: +$10,000. Floor: $6,000 below your highest equity point. Best day capped at $3,000.
Look at that account and decide what you would risk per trade.
Most people answer by looking at the target. Ten percent to make, and 1% or 2% a trade feels reasonable. Six or seven good ones and you are done.
That is the error. The target does not kill you. The floor does. Your position size has to be derived from the floor, backwards, before you have looked at the target at all.
Start with the simplest version of the question. Over 100 trades at a 45% win rate, what are the odds of hitting a run of straight losses long enough to eat a $6,000 floor?
This one has an exact answer, so there is nothing to argue about. The figures below come from a closed-form calculation, with a 300,000-trial simulation run alongside it as a check. The two agree to four decimal places.
| Risk per trade | Losses needed to breach | Chance of that run in 100 trades |
|---|---|---|
| 2.00% | 3 | 100.0% |
| 1.50% | 4 | 99.4% |
| 1.00% | 6 | 72.9% |
| 0.75% | 8 | 30.5% |
| 0.50% | 12 | 3.1% |
| 0.375% | 16 | 0.3% |
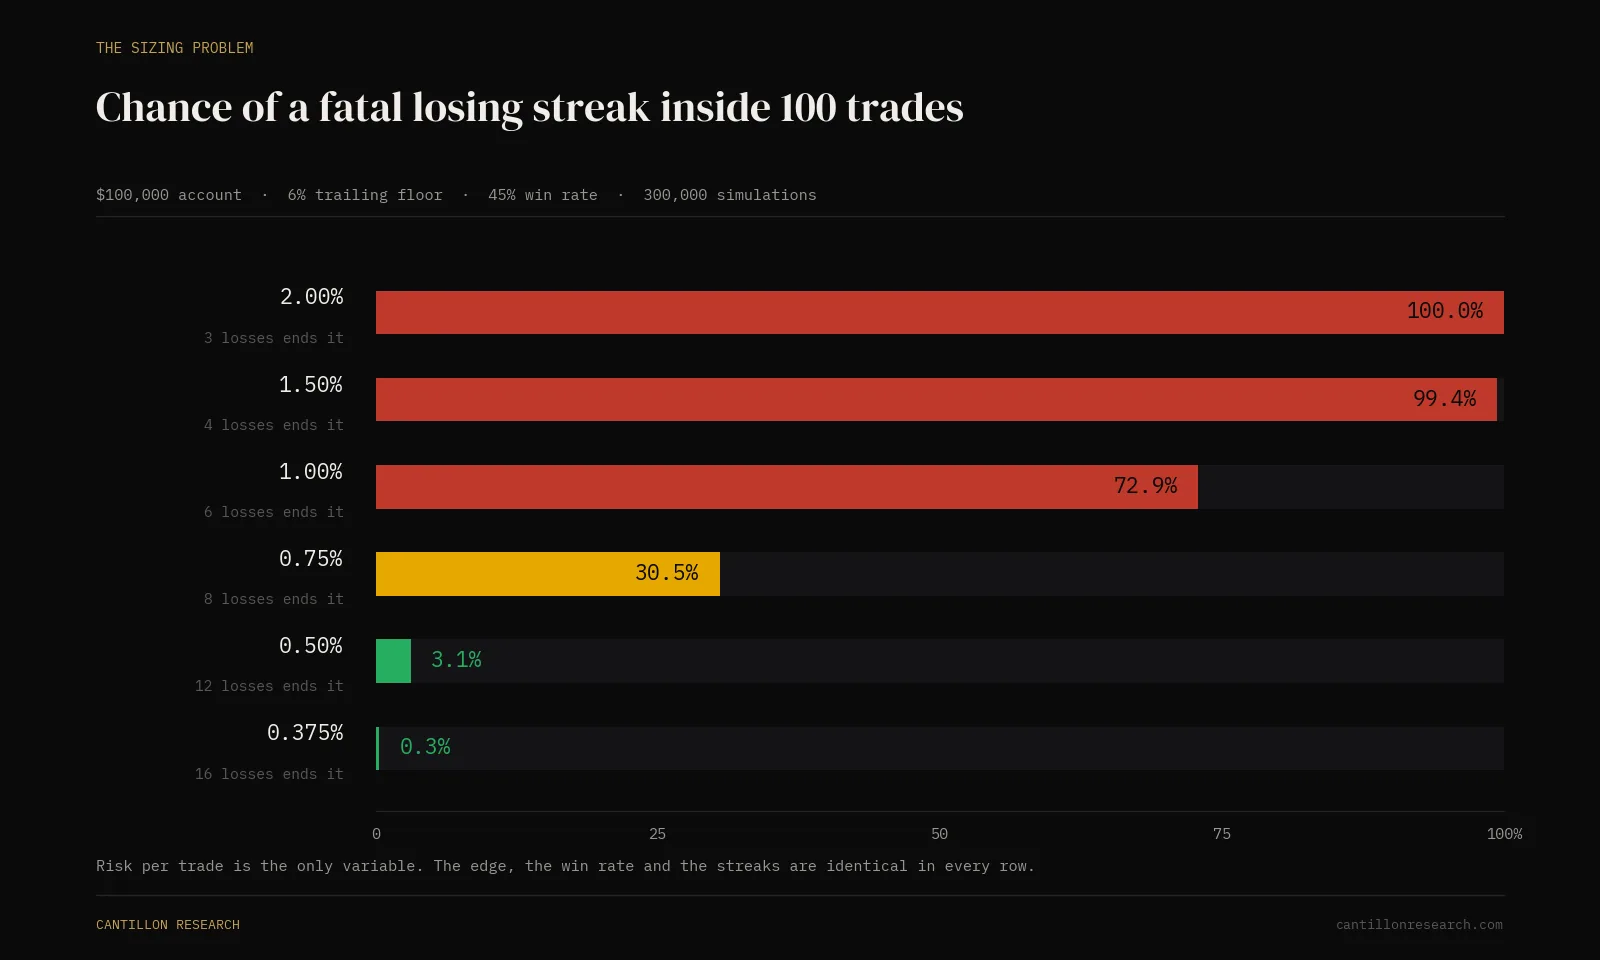
Read the top row again. At 2% risk on a 6% floor, three consecutive losses ends the account. Over a hundred trades at a 45% win rate, three in a row is not a risk, it is close to a guarantee. Survival odds are about 1 in 50,000.
Even 1% risk, which most traders consider conservative, produces a fatal run 73% of the time.
Now the correction, and it matters.
That table answers a narrower question than it looks like it answers. A run of straight losses is one way to breach a trailing floor. It is not the only way, and it is not even the common way. A trailing floor measures the distance between your equity and its own running high, so a scrappy sequence of two losses, a small win, three more losses will chew through the same $6,000 without ever printing a losing streak. Consecutive losses are a lower bound on the real risk.
So here is the same account modelled properly, tracking equity against its peak on every trade, with the reward multiple allowed to vary.
One piece of shorthand before the table, because it runs on it. R just means one unit of risk. If you are risking $375 on a trade, 1R is $375, and a 2R winner makes $750. Traders use it because it lets you compare a gold trade to a Nasdaq trade without converting anything.
| Risk per trade | 1.5R winners | 2.0R winners | 3.0R winners |
|---|---|---|---|
| 2.00% | 100.0% | 100.0% | 100.0% |
| 1.50% | 99.8% | 99.6% | 99.4% |
| 1.00% | 90.8% | 84.5% | 76.3% |
| 0.75% | 68.4% | 52.2% | 37.4% |
| 0.50% | 28.6% | 13.3% | 5.6% |
| 0.375% | 10.4% | 2.9% | 0.7% |
| 0.25% | 1.1% | 0.1% | 0.0% |
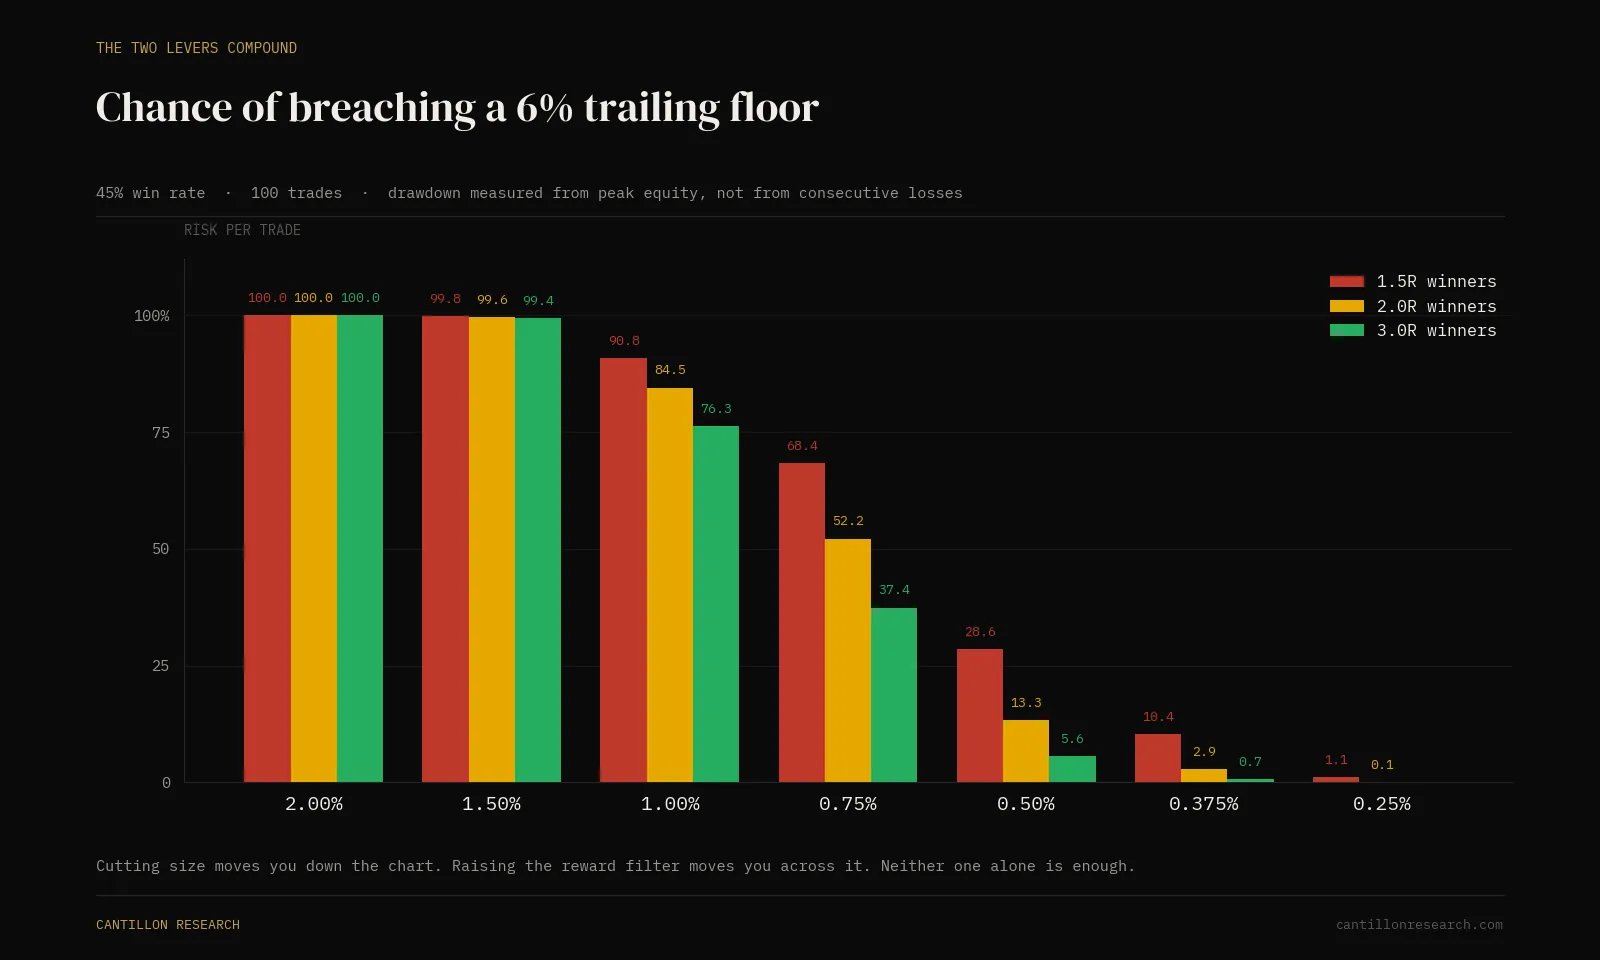
The real numbers are worse than the streak table implied, and they are worse in an interesting way.
At 0.375% risk with mediocre 1.5R winners, you still breach 10.4% of the time. Cut nothing, change nothing about size, and simply refuse to take setups paying less than 2R: it drops to 2.9%. At 3R it is 0.7%.
Which means the two levers are not separate after all. I had them filed as size for survival and selectivity for speed. They compound. A bigger average winner rebuilds the buffer between your equity and the trailing floor faster than a small one, so the floor spends less time within reach. Selectivity is a survival tool as much as it is a throughput tool.
And this is why the trailing floor deserves its reputation. Run the identical model against a static 6% floor measured from your starting balance and the 0.375% row falls from 10.4% to 3.5%. With a static floor, early wins build a cushion that a later bad patch can spend. With a trailing floor the cushion is deleted at every new high. There is no such thing as banked safety.
Then something useful happens further down the rule sheet. At 0.375% risk, breaching a 3% daily loss limit would take eight losses in a single session. If you are sizing correctly, the daily limit stops being a live threat and becomes a rule you simply never touch. One of the four gates disappears.
Small size makes a 10% target slow. That is a real problem, not a hand-wave, so here is the arithmetic on the other side.
Expectancy per trade is win rate times reward multiple, minus loss rate. At 45% wins and 1.5R winners, that is 0.125R. Risking 0.375% of the account, each trade is worth 0.047% on average. To grind out 10%, you need about 213 trades.
That is not a plan. That is a second job with a deadline attached.
Now hold the win rate exactly where it is and take only setups that pay 2R instead of 1.5R:
| Win rate | Reward | Expectancy | Trades to +10% at 0.375% risk |
|---|---|---|---|
| 45% | 1.5R | 0.125R | 213 |
| 55% | 1.5R | 0.375R | 71 |
| 45% | 2.0R | 0.350R | 76 |
| 50% | 2.0R | 0.500R | 53 |
| 40% | 3.0R | 0.600R | 44 |
| 45% | 3.0R | 0.800R | 33 |
| 50% | 3.0R | 1.000R | 27 |
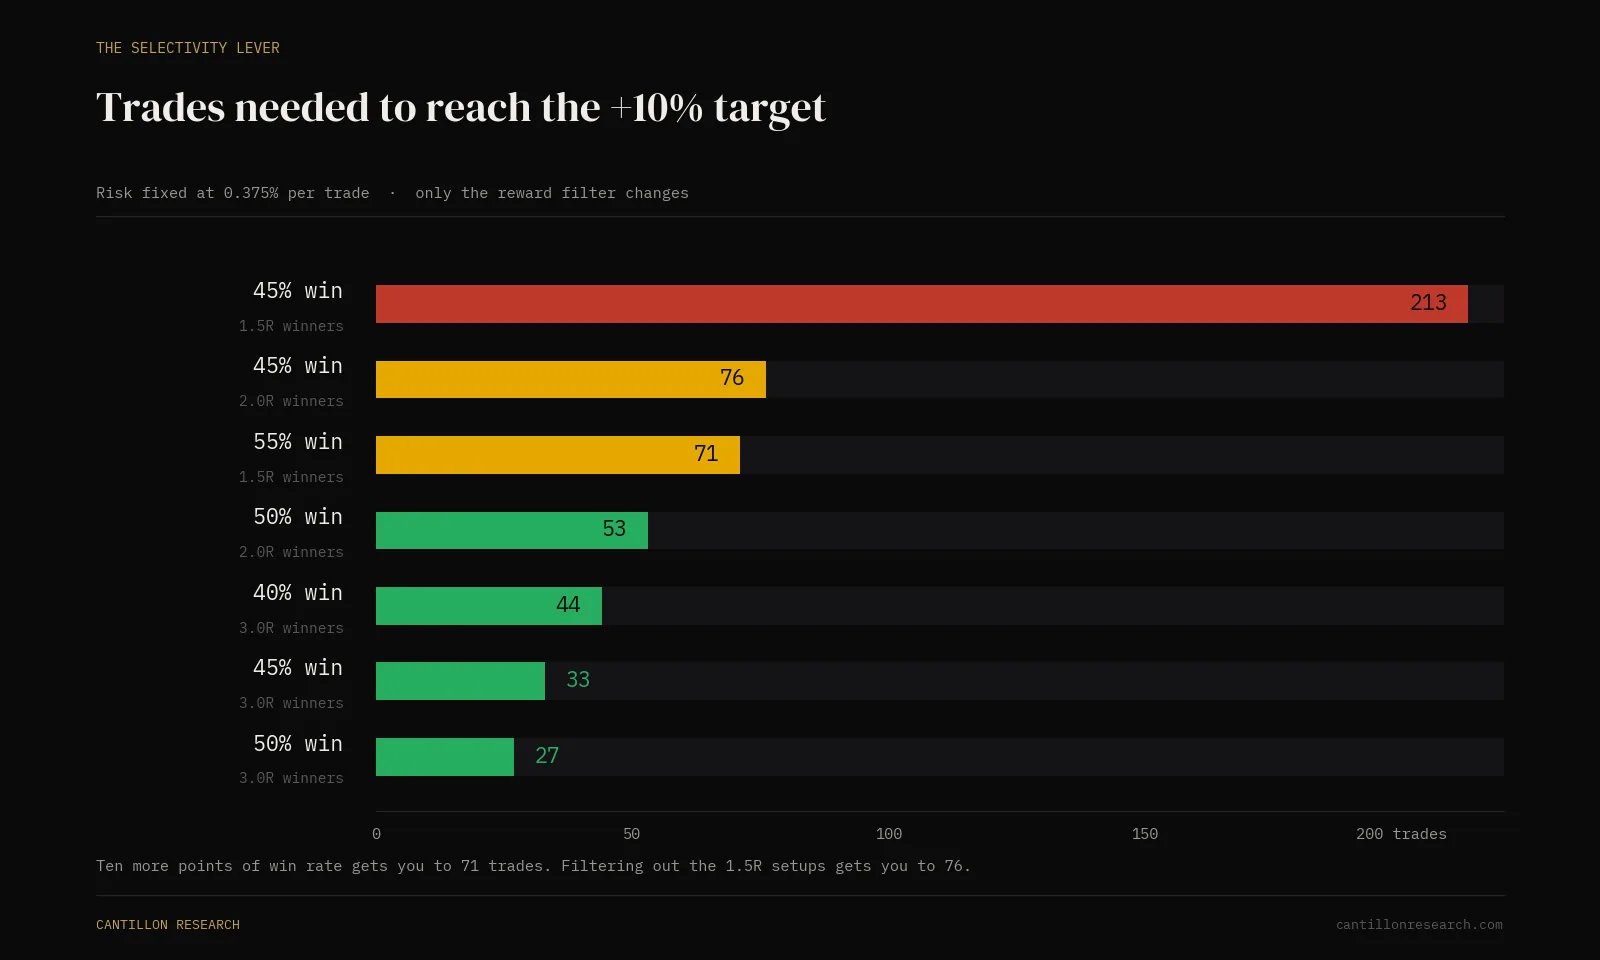
You did not get better at trading. You got more selective about which trades you took. The workload fell by 64%.
Compare rows two and three. Lifting your win rate by ten points is enormously hard and gets you to 71 trades. Lifting your reward from 1.5R to 2R is a filtering decision you can make today, and it gets you to 76. Nearly the same result, wildly different difficulty.
Look at the bottom rows too. A 40% win rate, which most retail traders would call broken, clears a 10% target in 44 trades when the winners are 3R. You do not need to be right often. You need to be right in a shape that pays.
Which closes the loop on the drawdown table. A bigger average winner does not just get you to the target sooner, it keeps the trailing floor further away the whole time you are working. Same filter, two jobs.
Traders reach for size instead, because size feels like the faster lever. Size is precisely the lever the rules were written to punish.
Everything above reads like an argument against evaluations. It is not. The capped downside is real, and it is the actual product you are buying.
A $100,000 challenge runs about $500. FundedNext is near $499, FTMO near $540, and smaller accounts drop toward $150. For that fee you get a $6,000 risk budget. Your money is capped at the fee, and the fee is one twelfth of the capital you are allowed to lose.
Put that next to the alternative. To run a $6,000 risk budget on your own account you need the $6,000, in cash, and every dollar of it is yours when it goes. The evaluation converts an open-ended loss into a fixed premium. That is not a gimmick. It is the single most attractive feature of the entire industry, and it is why the model exists at all.
So it is an option. You pay a premium, your loss is capped, your upside is a funded account. The only question worth asking about an option is whether the premium is below its value.
Here is that calculation. Industry-typical payouts run around 4% of account size per cycle at an 80% split, so a first payout on $100,000 is roughly $3,200. Most firms refund the challenge fee with that first payout, so add $500 back. Call the value of passing $3,700.
Now put the published pass rate next to it. Five to ten percent.
| Your pass probability | Expected value per attempt | Return on the fee |
|---|---|---|
| 5% industry low | -$315 | -63% |
| 8% industry mid | -$204 | -41% |
| 10% industry high | -$130 | -26% |
| 13.5% breakeven | $0 | 0% |
| 20% | +$240 | +48% |
| 30% | +$610 | +122% |
| 40% | +$980 | +196% |
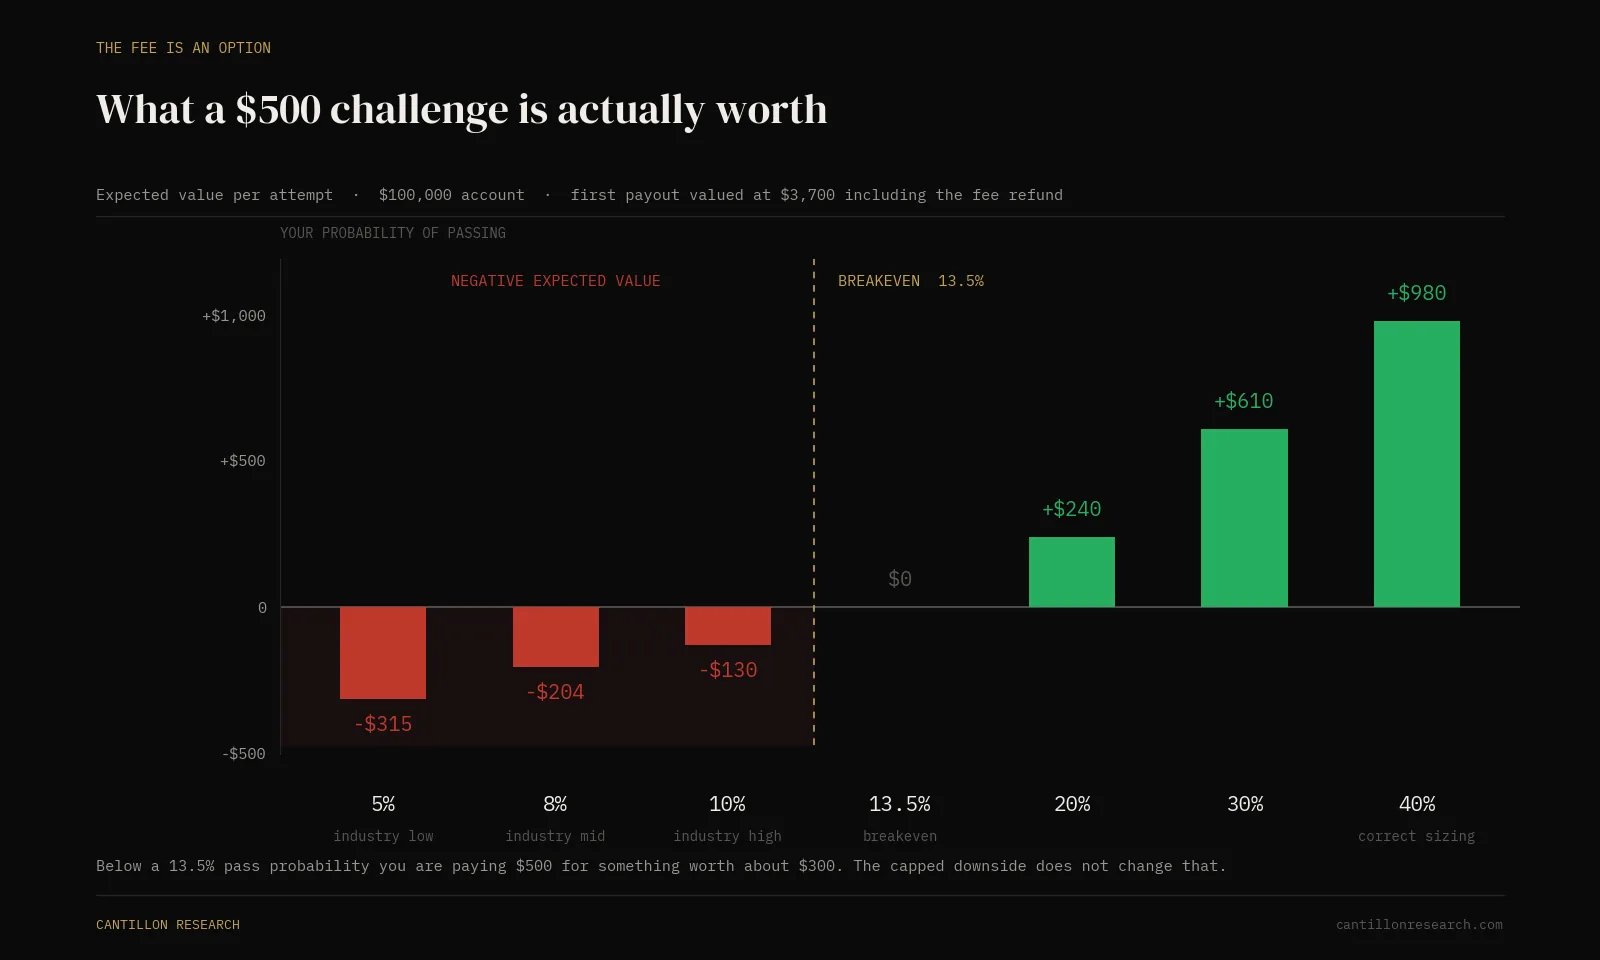
Read that carefully, because it is the least discussed number in this industry. At industry-average behavior, buying a challenge is negative expected value. The average buyer is paying $500 for something worth about $300. That is not a scandal and it is not fraud. It is the business model working exactly as designed, and the traders funding it agreed to the terms.
The capped downside does not make it a good trade. It makes it a survivable bad trade. Those are different things, and the difference is roughly thirteen and a half percent.
Which is the whole argument of this piece, arriving from the other direction. The sizing fix is not just about passing. It moves you across the breakeven line and turns the fee from a cost into a position. Same firm, same rules, same fee. Different divisor.
The 40% row is an assumption, not a measurement. Nobody publishes pass rates broken down by how the trader sized, so I cannot tell you what correct sizing does to your specific probability. What the streak table does establish is the direction and roughly the scale: going from 1% to 0.375% takes your chance of a drawdown breach from 73% to under 1%, and drawdown breach is the most common way evaluations end. My read is that a disciplined trader with a real edge lands well above 13.5%. I cannot prove it, and you should treat anyone who claims a precise number with suspicion.
Second, the $3,700 assumes you reach a first payout, and a large share of funded traders never do. Haircut for that and true breakeven sits higher than 13.5%. Probably meaningfully higher. The consolation is that it is not a separate problem, because the sizing and selectivity that get you through the evaluation are the same two things that get you to a withdrawal.
The sentence that costs the most money
"I only lose $400."
That is true once. It is the reasoning that produces $400 spent nine times.
Run it. At an 8% pass rate across five attempts you are 34% likely to get funded, you have spent $2,500, and you are down about $1,239 in expectation. At 40% across three attempts you are 78% likely, you have spent $1,500, and you are up about $1,401.
Resets do not fix probability. They repeat it. If nothing about your sizing changed between attempt one and attempt two, you did not buy a second chance, you bought the same chance twice.
Two rules follow, and they are cheap to adopt:
Decide your attempt budget before you buy the first one. Two or three, in writing, with a total dollar figure. When it is spent, you stop and go work on the strategy off a demo account, where the feedback is free.
Never reset without naming what changed. Not "I will be more disciplined". A number. Risk per trade went from 1% to 0.375%. The reward filter went from anything to 2R minimum. If you cannot name the change, the reset is just a repurchase.
The daily stop is not the daily loss limit. The firm says 3%. Yours should be 1.5%. At 0.375% risk that is four losses, and after four losses you have learned something about the day. Set the number before the session and treat it as a circuit breaker. The reasoning is not discipline theatre. On a 6% floor, two limit-hitting days is your entire account, so the daily limit and the max drawdown are not independent constraints. They are the same constraint sampled twice.
The consistency rule quietly rewrites your exit plan. On our account a 30% rule caps your best day at $3,000 against a $10,000 target. So one enormous session does not accelerate you. It locks you. If your best day is $5,000, you now need $16,667 in total profit before that day stops blocking your payout, and you only needed $10,000 to begin with.
The practical consequence is strange the first time you meet it. On a day that is running very well, stopping is the correct trade. Most people have never had to build that reflex, because in a normal account it would be irrational.
Work it in this sequence. The order is the point.
- Find the floor. Max drawdown in dollars. On our account, $6,000. If your firm uses a trailing floor, that number climbs against you at every new equity high, so it is never further away than it is right now.
- Choose survivable streak depth. Sixteen. Not three.
- Divide. $6,000 ÷ 16 = $375, which is 0.375% per trade. Fixed from here. Not a function of how good the setup in front of you looks.
- Halve the firm's daily limit and make that yours. Here, 1.5%, which is four losses. Then stop for the day.
- Set a minimum reward filter. If a setup does not offer 2R against a real invalidation level, it is not a trade. This turns 213 trades into 76, and it cuts your breach probability from 10.4% to 2.9% at the same position size. It is also the step people quietly skip.
- Cap the best day. Consistency threshold times target. Here, $3,000. Walk away when you touch it.
- Size from the stop distance, never from conviction. Risk dollars divided by distance to invalidation. Wider stop, smaller position. Always.
- Check the gauntlet ratio before you buy anything. Target divided by floor. At 1.0 you have room to be wrong; at 1.67 you do not. Some evaluations are simply harder products, and it is worth knowing which one you are holding before you place a trade in it.
Every rule in that list is derived from a rule the firm wrote. Nothing in it is a preference.
Steps 1 through 4, plus 6 and 8, are arithmetic. You can implement them today, on paper, for free, and they will do most of the work.
Step 5 is the hard one, and it is the one that separates traders who pass from traders who reset. Selectivity is easy to write down and brutal to execute, because selectivity means sitting out setups that look fine. Nobody sits out a setup that looks fine on willpower alone. Not at 3pm on a slow Thursday in week three with the target still 6% away. You need something external telling you no.
That is the problem I built the Institutional Volume Terminal to solve. It is a confluence engine, not a signal generator.
Twelve independent factors feed a tier. A signal only escalates when enough of them agree, so a clean chart with nothing underneath it stays at tier one and you leave it alone. There is a deviation filter that kills an entry outright if price has run too far from the institutional cost basis, which is the single most common way a good setup becomes a bad entry. And one rule I am still slightly proud of: if a long reaches tier three or four while the VIX layer reads below minus 1.5, the tool downgrades it by a full tier. Strong signal, frightened tape, smaller conviction. Automatically.
Most days, on most instruments, it produces nothing.
That is the feature. On a 6% floor, the trades you skip matter more than the trades you take.
I am not going to tell you it passes challenges. Nobody honest can say that about any tool, and anyone who does is selling you the 1-in-20 outcome as though it were a subscription. What a system does is remove the discretionary moment where a tired trader looks at a mediocre setup and decides this one is probably fine.
Remove enough of those moments and the arithmetic above starts working for you instead of against you.
The firm is not betting against your strategy. It is betting against your sizing, and the historical record says that is an excellent bet.
Fix the sizing and you remove most of the mechanism that produces the 90% number. Then get selective, which finishes the job twice over: it reaches the target before the calendar runs out, and it holds the floor at arm's length while you do it.
That is the entire problem. Two variables, and they multiply. Neither one is your entry signal.
All nine regime states and how to trade each one. Free PDF, no email required.
Download the Playbook