Ford And Rivian Are The Only Convergence Names. Both Of Them Read Short.
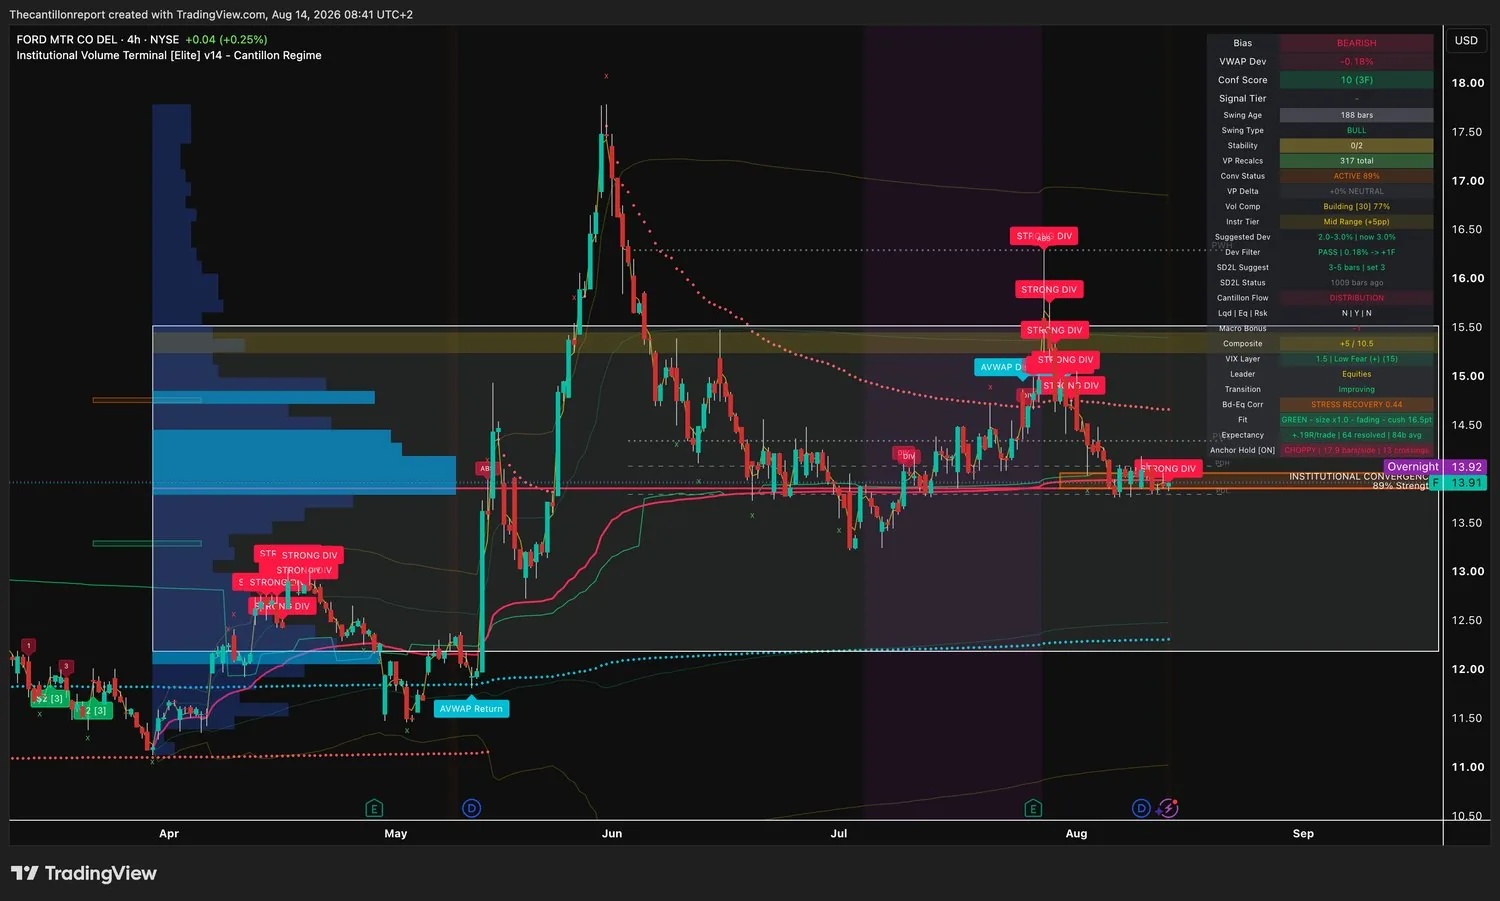
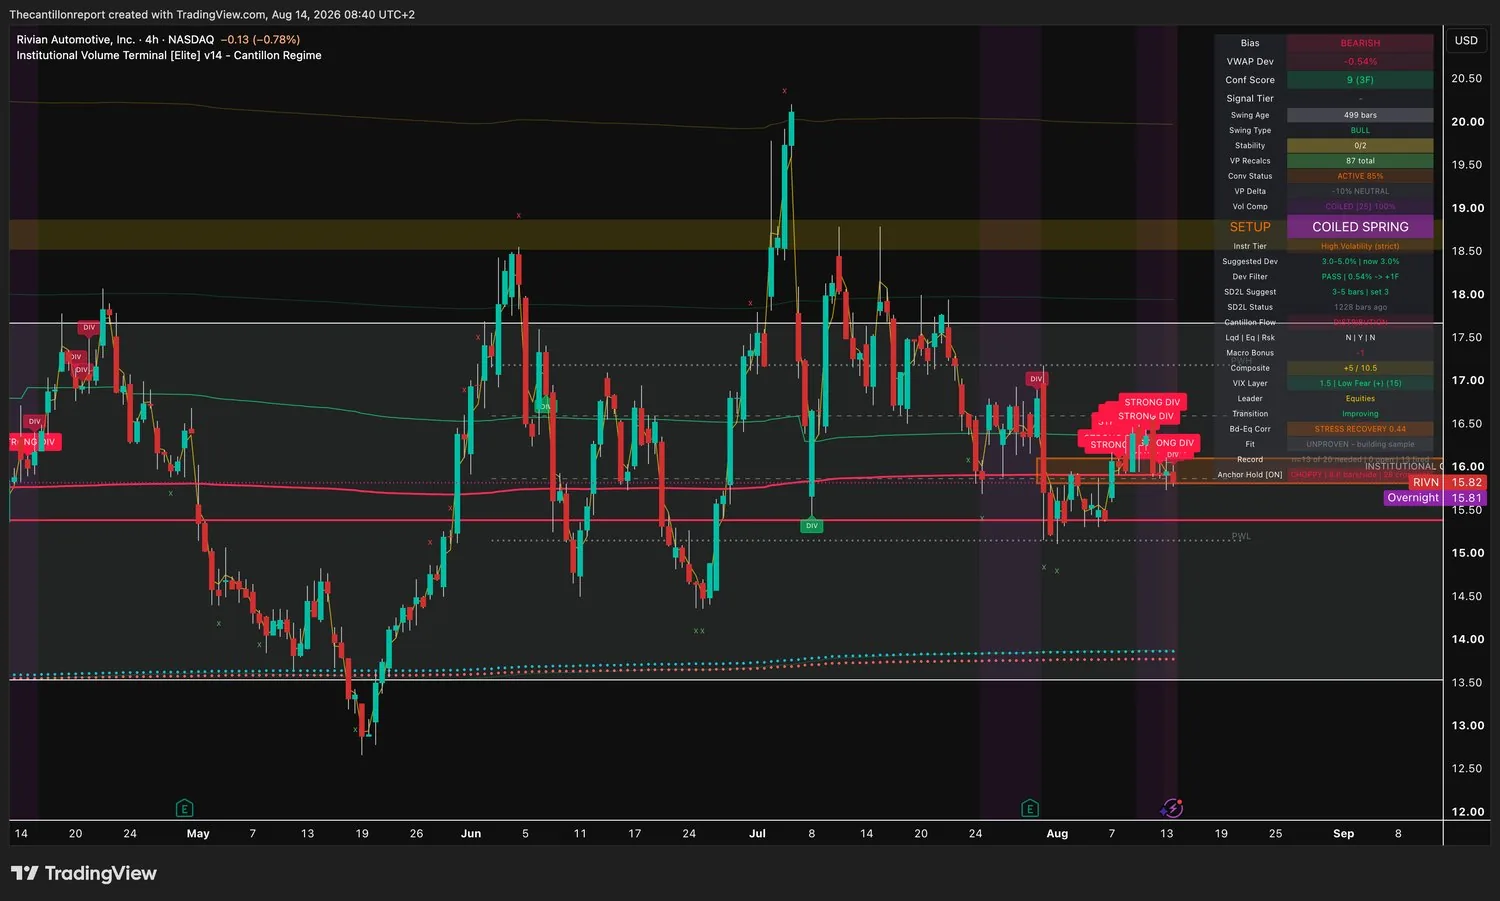
Two instruments in this scan carry institutional convergence live, and they are the same sector. Ford reads confidence 10 across three timeframes at 89% convergence, the highest score anywhere here. Rivian upgraded on every single field overnight and is the only COILED SPRING flag in the terminal, at 100% compression with convergence at 85%. Both pass the deviation filter. Both are short. All four US indices fail the filter again, and the flow reading is DISTRIBUTION on every feed for the first time this week. The only long on the sheet has eight cents of gate left. Full levels below, no paywall.
July retail sales land this morning and the consumer is now the swing input. Consensus looks for +0.1% on the headline after +0.2%, with the ex-autos core at +0.2% after a −0.2% June. This follows two soft inflation prints in a row: CPI at +0.1% on the month and 3.4% on the year, then producer prices below expectations with core slowing on both the monthly and annual reads. September hike bets came off hard on that pair. The S&P closed at a record 7,801.84, up 0.69%, the Nasdaq added 0.95% and the Dow finished flat at 53,784.87. A weak consumer print is the third leg that turns the September debate into a decision.
- Record quarter, tepid tape Applied Materials posted record results and raised its outlook, and the stock got a muted reception after running roughly 190% over the past year. Cisco and Cerebras both fell hard on their own numbers earlier in the week. Good semiconductor numbers are no longer buying much.
- The Hormuz premium drained Gold fell 1.24% to $4,412.20 and crude eased as Washington shifted toward economic pressure rather than escalation over the strait. The input that was going to put the inflation headline back above 3.5% just got cheaper.
DISTRIBUTION at +5/10.5 with a −1 macro headwind is the first uniform flow reading of the week, and it is the defensive one. Every feed agrees today, which is new: Monday through Thursday the index and single-name feeds returned different regimes on the same morning. Equities are the only layer on. Bonds and risk assets are both off, which is why long setups score against the regime rather than with it and why both top rows below are shorts. The structural caveat sits on the correlation split: single names read STRESS RECOVERY 0.44, well through the 0.35 line where bonds stop hedging equities, while the index feeds read a normal 0.34. Every tradeable row in this brief is a single name, so every tradeable row is on the unhedged side. Size for that.
The strip runs today because it reversed. Yesterday every one of the seven measures fell together for the first time in the sequence. This morning five of them are back up, and the divergence flag is still flying.
| Metric | Universe scan | Change vs yesterday |
|---|---|---|
| Divergence flag | STILL ACTIVE | Eighth session. Price rising, participation lagging. |
| A/D net | +16 on 45 advancing | Up from +6 on 40. |
| A/D ratio | 1.55 | Up from 1.18, the best reading in the sequence. |
| McClellan | −41.6 | Still negative, improved from −53.1. |
| A/D line | +1,456 | Down from +1,488. |
| Summation | +11,372 | Down from +11,414. Eighth day lower. |
| % above 50-day | 60.8% | Up from 54.1%, recovering 6.7 points. |
| % above 200-day | 59.5% | Up from 56.8%. |
Participation came back and the two cumulative measures did not. The A/D line and the summation index are the slow ones, and both fell for an eighth consecutive session while the daily counts improved. One good day inside an eight-day divergence is a bounce in the internals, not a repair of them. It is enough to keep owning names on their own signals. It is not a reason to buy an index sitting more than twice its band above cost basis.
| # | Ticker | Dir | Entry (dev · price · anchor) | Trigger | Invalidation | Edge (WR · Conf · Comp) | Size |
|---|---|---|---|---|---|---|---|
| 1 | F | Short | PASS −0.18% · $13.91, anchor $13.94. Overnight $13.92. Band $13.85–13.98. Gate shuts $13.52 down, $14.35 up | 4H close below $13.75 | 4H close above $14.15 | Conf 10 (3F), highest here · Conv ACTIVE 89% · Building 77% · +.19R on 64 resolved · Fit GREEN | Mid-Range, standard. Anchor holds 17.9 bars |
| 2 | RIVN | Short | PASS −0.54% · $15.82, anchor $15.91. Overnight $15.81. Band $15.85–16.10. Gate shuts $15.43 down, $16.38 up | 4H close below $15.50 | 4H close above $16.40 | Conf 9 (3F) · Conv ACTIVE 85% · COILED SPRING 100% · Fit UNPROVEN, 13 of 20 | High-Vol strict, half size |
| 3 | ALGM | Long | OPEN +2.81% · $44.13, anchor $42.92. Overnight $44.20. Reset band $42.90–43.50. Gate shuts $44.21 | None available. Trigger $44.60 sits above the gate | 4H close below $42.00 | +.46R on 20 resolved, best here · COILED 99% · Fit GREEN improving · Conf 5 (1F) | High-Vol strict, half size, on the reset only |
If you watch one: Ford. Confidence 10 across three timeframes is the highest reading in this scan and the widest agreement in it, institutional convergence is live at 89% which is the strongest cluster here, and the deviation filter reads PASS at eighteen hundredths of a percent, so the entry adds a confluence factor rather than merely being permitted. Its record is the deepest thing on the sheet: plus 0.19R per trade across 64 resolved signals. Rivian is the runner-up and it has the better improvement story, because every field on that chart got better overnight and nothing on it got worse. But Rivian's own trend filter still returns UNPROVEN at 13 resolved of the 20 it needs, so the terminal will not print an expectancy for it and there is nothing to size against. Ford has 64 signals of proof behind the same direction.
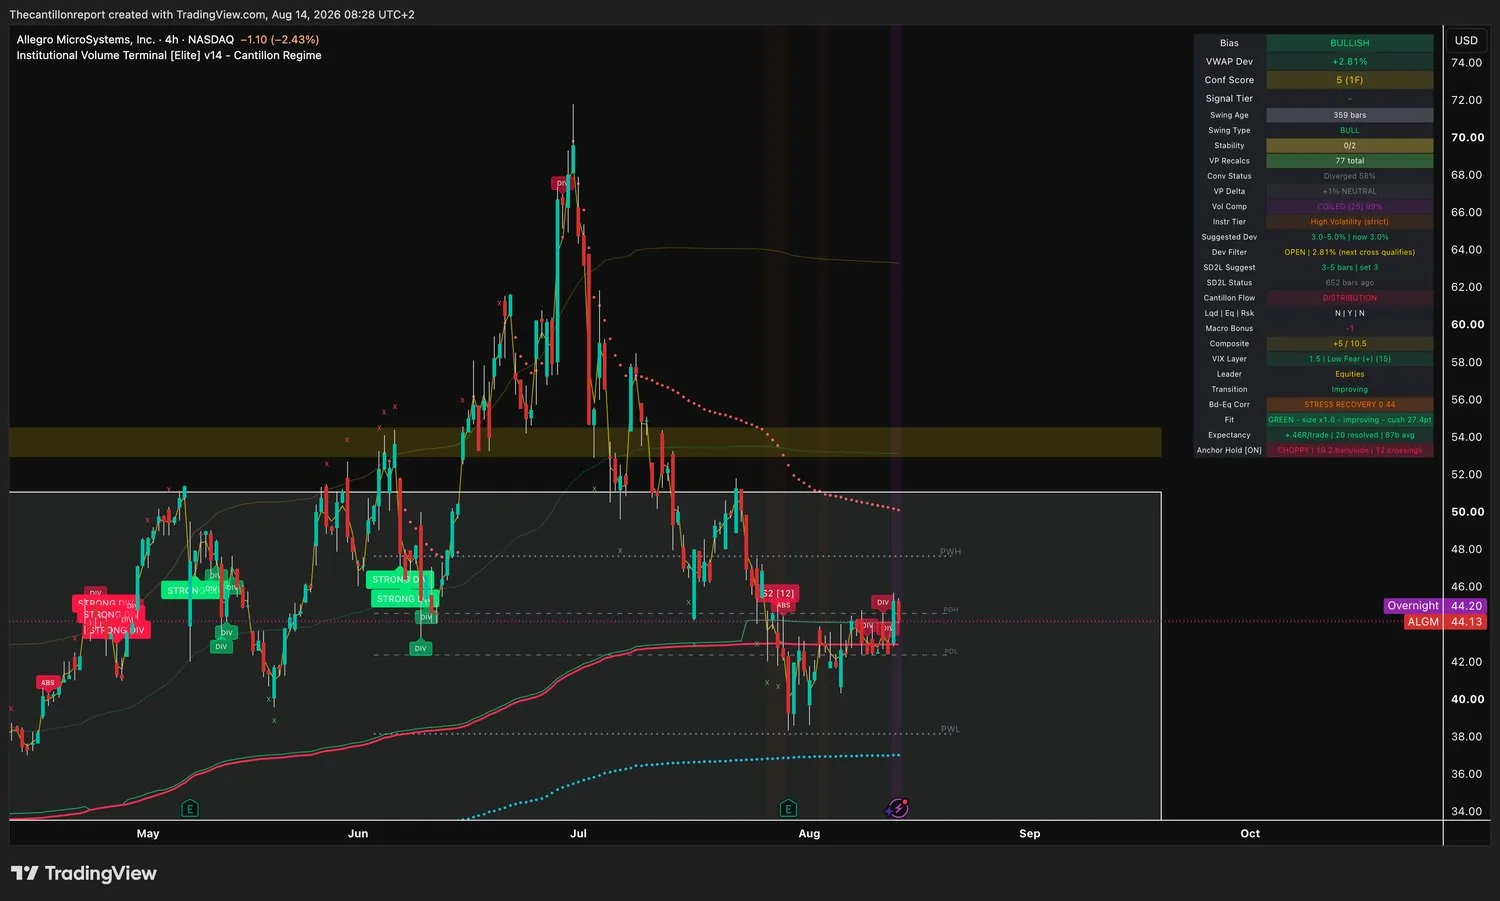
Allegro prints $44.13 with its anchor at $42.92 and a 3.0% band, which puts the gate at $44.21. Price is eight cents inside it. The overnight at $44.20 is one cent inside it. And the level that would confirm the setup, a 4-hour close above the prior-day high at $44.60, sits 39 cents above the gate, so confirmation and disqualification cannot both happen. This is the only long on the board, it carries the best expectancy in the brief at plus 0.46R across 20 resolved signals, it is coiled at 99%, and its own trend filter is the only one here that is improving rather than fading. None of that buys anything above $44.21. One green four-hour bar ends the setup and hands it back to the reset zone at $42.90 to $43.50. On a day where every US index is locked out and the two clean entries are both shorts, the single long available is one cent from being unavailable. That is the tape.
| Ticker | Dev | Reset zone | Why not |
|---|---|---|---|
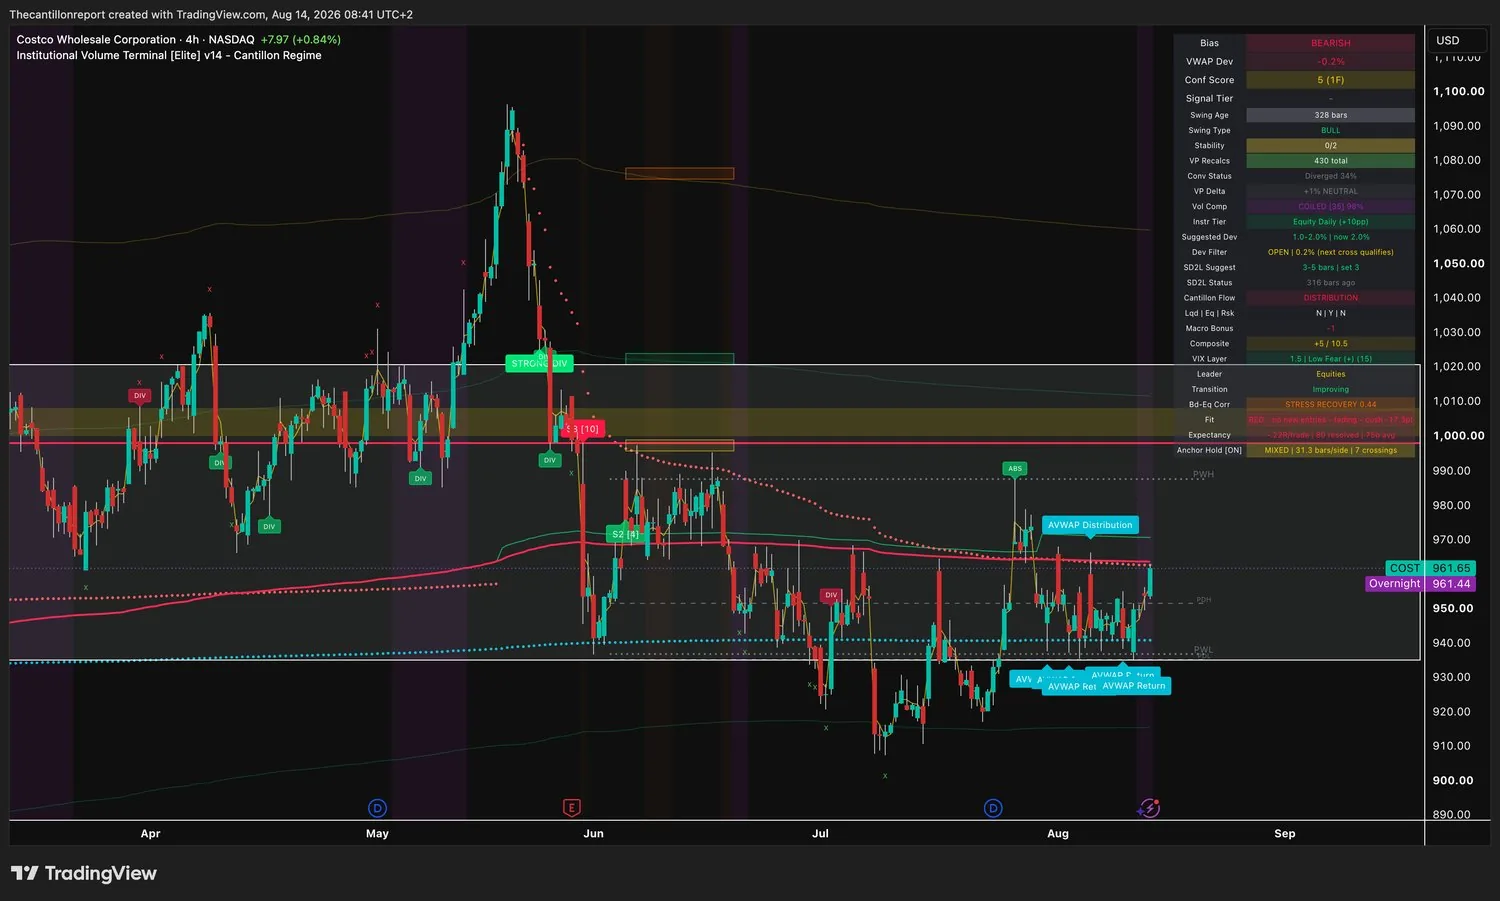
| COST | OPEN −0.20% | $955–963.60 | Best location in the scan and a red light on top of it. Fit RED, no new entries, cushion −17.3 and fading. Expectancy −0.22R across 80 resolved. COILED 98% with nothing you are allowed to do about it. |
| NAS100 | FAIL +3.16% | 28,547–29,712 | The nearest index gate again, and still 338 points and 1.12% away. Conf 9 on one frame is the best index score here. Fit RED holding, expectancy −0.02R across 101 resolved. |
| RUSSELL | FAIL +4.39% | 2,865–2,982 | Twice its band. Conf 1 with zero confirming timeframes, the weakest reading anywhere in this scan, and a strong bearish divergence cluster printing into the prior-day high at 3,055. |
| US30 | FAIL +4.42% | 50,508–52,570 | 1,247 points above its gate. COILED 96% and the worst record on the sheet at −0.23R across 43 resolved. Fit RED and fading. |
| SP500 | FAIL +4.81% | 7,301–7,599 | The widest extension here at more than twice its band, 209 points above the gate. Conf 6 across two frames with no entry attached, and a divergence printed at the record high. |
This one is free. The other four this week were not.
Every Friday edition is published in full: every level, every trigger, every invalidation, no gate. Monday through Thursday the Board goes to members. If today's format worked for you, the daily version is the same brief with the same discipline, four more times a week.
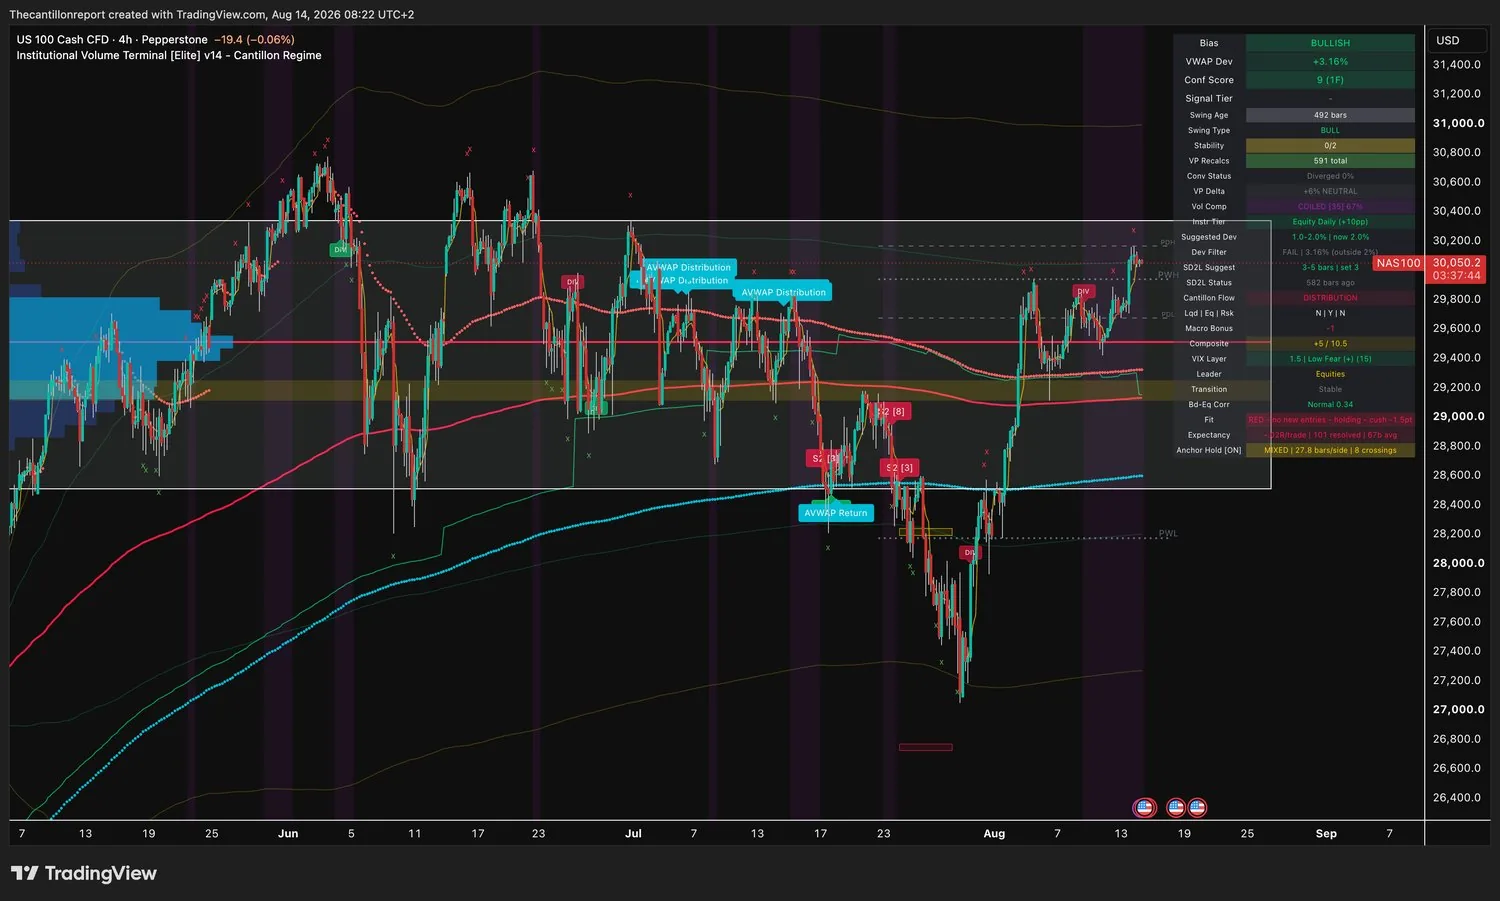
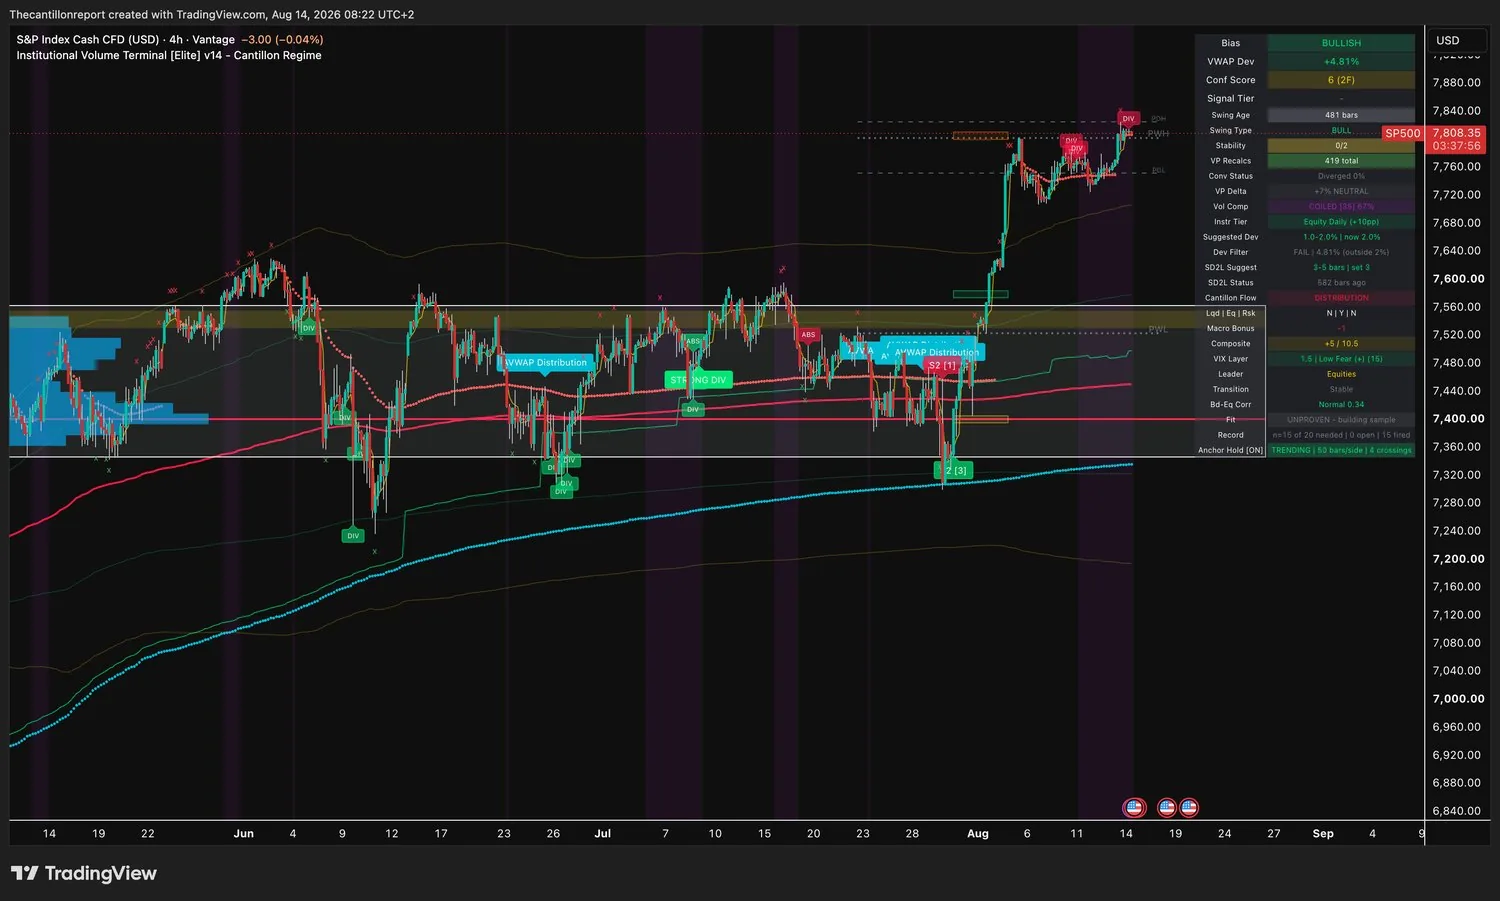
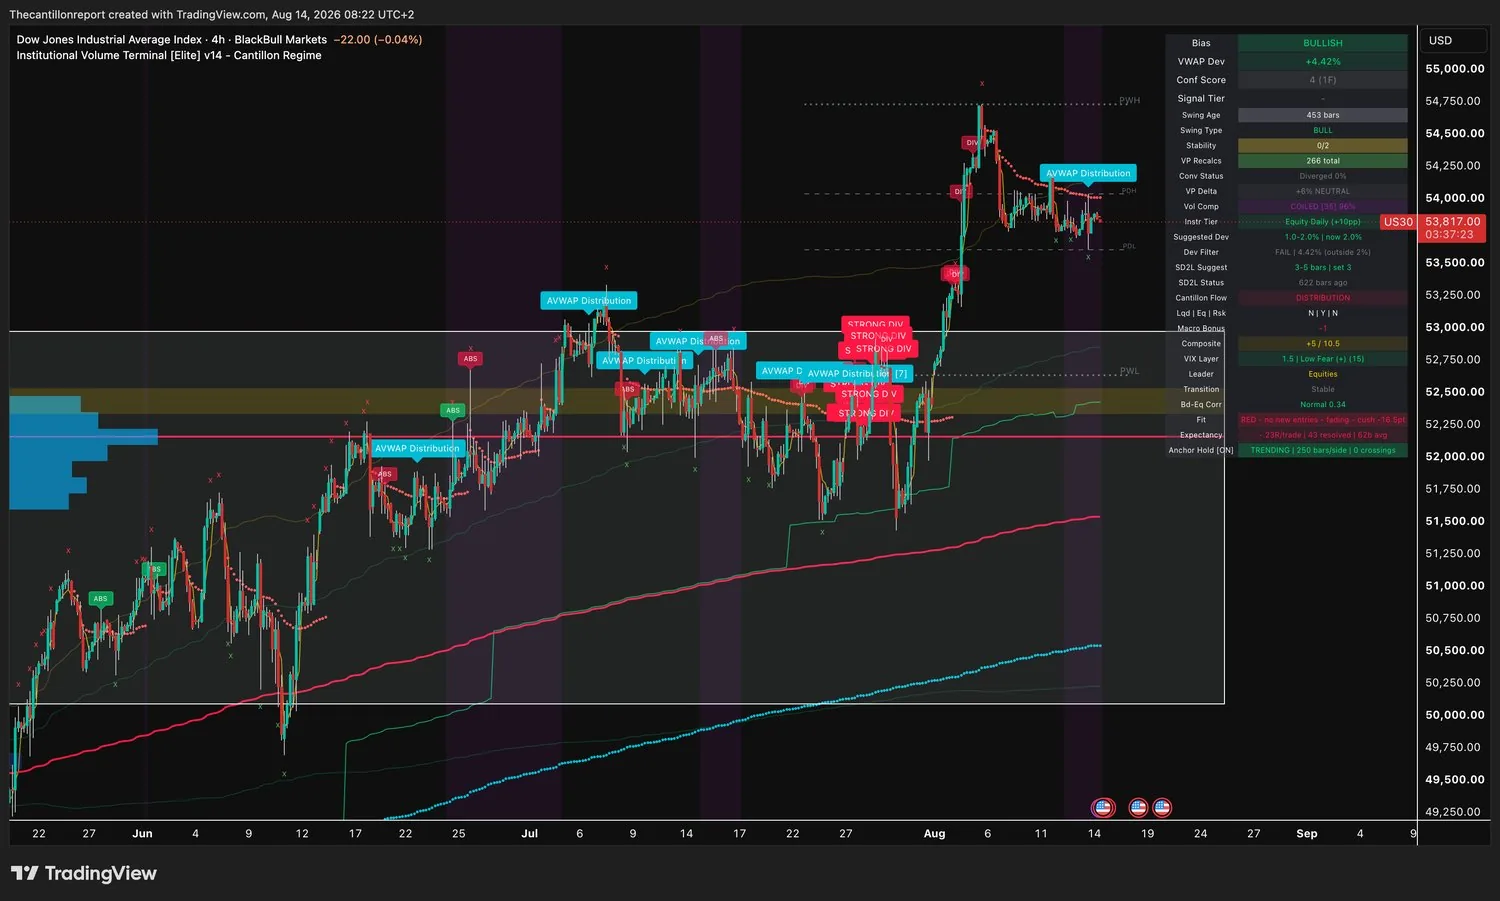
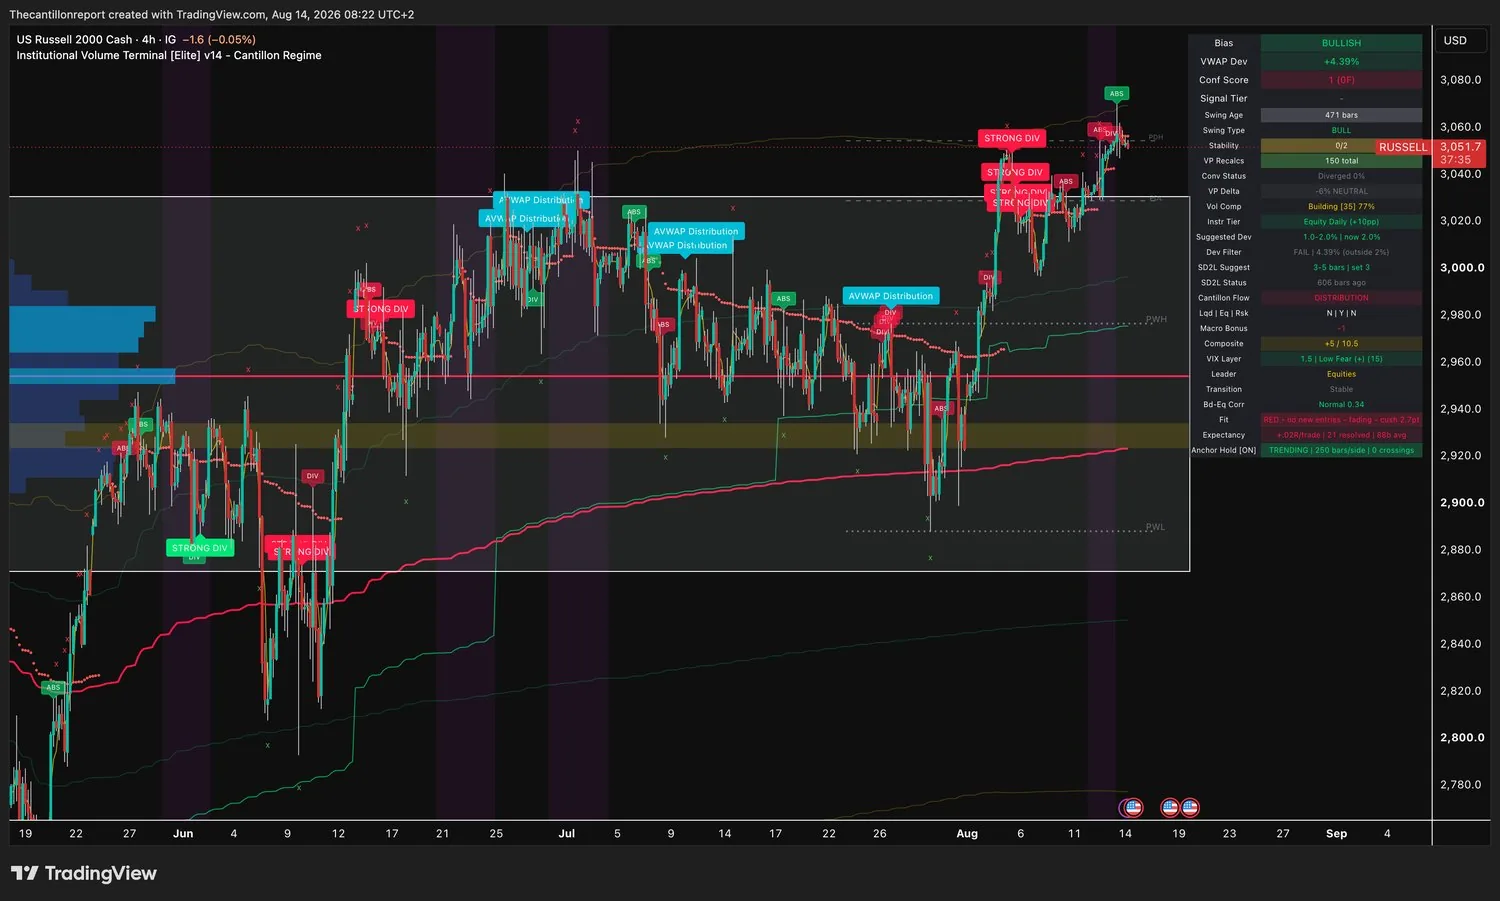
Dev · percentage distance from the institutional VWAP anchor, the volume-weighted price institutions actually paid. Dev Filter · PASS means price is close enough to that anchor that the entry is priced well and the reading adds a confluence factor; OPEN means inside the band but the anchor cross has not registered yet, which the terminal marks as next cross qualifies; FAIL means too extended for a clean new entry. Gate shuts at · the price where the deviation band is exceeded and no new entry qualifies. Conf (XF) · institutional confidence score confirmed across X timeframes. Higher is better, and more timeframes is better at the same score. COILED / Building / Expanded % · volatility compression. COILED is maximum, Building is partial, Expanded means no coil is loaded. Higher means a larger expected move when it releases. None of them state direction, and none of them override the deviation filter. COILED SPRING · a named setup flag the terminal raises when maximum compression coincides with a qualifying location. Conv / Convergence · independent institutional anchors stacked in the same zone, reported as a strength percentage. ACTIVE means a real cluster of cost basis is sitting there now; Diverged means no cluster and the percentage is how far apart they are. Expectancy (R) · average result per signal in units of risk, where a stop is always exactly −1.00R, published with the resolved-signal count. UNPROVEN · fewer than 20 resolved signals, so the terminal refuses to print an expectancy and there is nothing to size against. Fit · the trend and chop filter. GREEN means full size, AMBER halves the position, RED means no new entries whatever the setup looks like. The cushion is how far the light sits from flipping, and whether it is improving, holding or fading. Anchor Hold · how many bars the anchor holds per side before flipping, with the crossing count. TRENDING means it carries a swing; CHOPPY means it does not hold long enough to carry the position it would open. Snapback (SD2L) · the oversold reversal signal fired two standard deviations below the anchor. Bar count is how long ago it fired. Swing Type · the multi-bar structural direction. It can disagree with the intraday bias, and when it does the trade is being taken against the larger trend and is sized down. Composite · the sum of the active Cantillon layers on the v14 scale, maximum +10.5. Macro bonus · the regime's tailwind or headwind applied to every trade. Bd-Eq Corr · 60-bar rolling correlation of bond and equity returns; above 0.35 the two are treated as one risk and bonds stop hedging equities. Tiers · High-Volatility strict, Mid-Range (+5pp band), Equity Daily (+10pp band). The tier sets the base position size before any other adjustment.