Three Names Clear The Gate. The Prettiest Two Do Not.
Rivian is the only buy this morning and it is a half-size one. It has already earned its entry at $16.02 and it carries the best published record in this scan. Astera Labs looks better on every chart and has six finished signals behind it. Six is not evidence.
- BuyRivian (RIVN), half size, anywhere from $15.96 to $16.44. The entry is already qualified. Half size because this stock flips sides constantly and rarely holds a move.
- SellOuster (OUST), full size, from $37.30 to $38.45. The only short today with a green trend light, an open window and enough finished signals to mean something.
- WaitUber (UBER). Alert at $79.06 and nothing before the cross. When it comes this is a full-size short and the structure underneath it is the best on the page.
- AvoidThe S&P 500 and the Dow. Both have run past the point where an entry is fairly priced. They come back at 7,620 and 52,665.
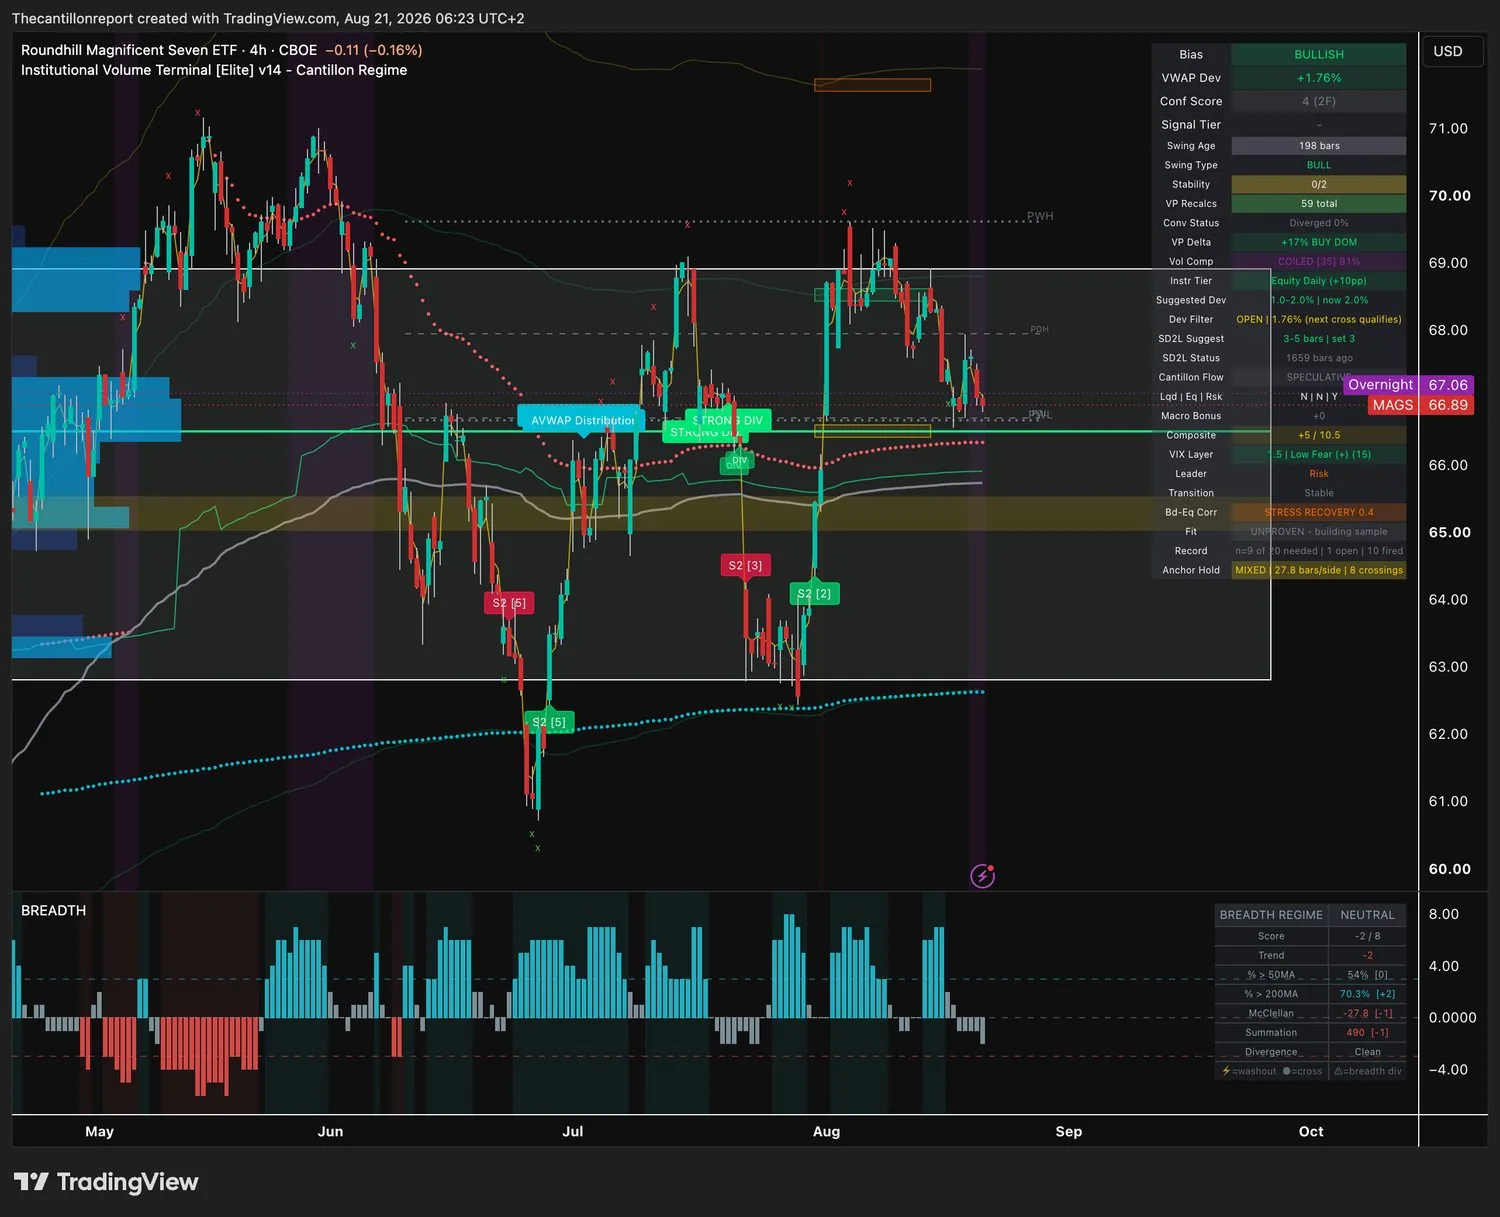
- PaperAstera Labs and the Magnificent Seven ETF. The two best-shaped charts in the scan, with fifteen finished signals between them. Write them down, do not size them.
The Treasury will roughly double its repurchases of longer-dated debt, taking each operation from about $2 billion to $4 billion, in a move led by Secretary Bessent to steady the far end of the curve. Yields dropped on the announcement. By the next session most of that drop was gone and the phrase doing the rounds was limited relief. Strip the language away and one thing is left: the government has become a buyer of its own thirty-year paper, because at these yields not enough other people are. That is the bond layer of every cross-asset model being propped rather than bid. On the US book below, the money leg reads off. On the European book it reads on.
- Crypto is carrying risk alone Bitcoin ran past $71,800 on Thursday, its best level since early June, on a White House push behind the Clarity Act. Coinbase and Circle went with it. Risk appetite is the only one of the three cross-asset legs switched on this morning, and this is what switched it.
- Walmart's 2.6% Walmart beat on earnings, raised its full-year guidance, and still fell about 9%, because US comparable sales growth slowed to 2.6%. A beat and a raise sold that hard tells you what the market is willing to pay for guidance right now.
Two of the three legs are off. Bonds are not working and equities are not joining, so the entire risk appetite reading rests on crypto, which is exactly where Thursday's move came from. Nothing on this page gets extra size for being on the right side of the regime, because there is no right side to be on. Bonds and stocks are still moving together at 0.40, which is the number that has to fall before a long book gets easier to hold.
The terminal returns three different regime readings this morning because these instruments trade on three different clocks. That is not the system arguing with itself. It is the reason Deutsche Telekom is scored against the German book and not against the S&P.
| Book | Reading | What it means this morning |
|---|---|---|
| US single names | Speculative · +5 of 10.5 | Risk appetite on, bonds and equities both off. Fear is low at VIX 15, which is what keeps the score at five rather than three. |
| US indices & crude | Speculative · +4 of 10.5 | Same label, one point worse, and a macro drag of minus one on top. Fear reads neutral here at VIX 16, not low. The index book is a slightly darker version of the stock book. |
| Europe (XETR, LSE) | Late cycle · +6 of 10.5 | The only book where the money leg is switched on. Highest score of the three and the least comfortable label. Late cycle means the liquidity is real and the equity response to it has already faded. |
Seven stocks in ten are above their 200-day line. Only about five in ten are above their 50-day. The structure is intact and the push has stopped. Advancers minus decliners is negative on both continents and more than twice as negative in the US, while Europe holds its short trend line 5.8 points wider. So Europe carries the better breadth and the worse regime label at the same time. That pair is the reason the two European coils below are watch items and not trades.
| Metric | US book | Europe book | Plain read |
|---|---|---|---|
| Overall | Neutral | Neutral | Neither list confirms the bullish index charts sitting above it. |
| Score | −2 / 8 | −1 / 8 | Negative on both, worse in the US. |
| Above the 50-day | 54.0% | 59.8% | Barely half the US list holds its short trend line. |
| Above the 200-day | 70.3% | 72.1% | The long uptrend is still wide on both sides. |
| Short-term momentum | −27.8 | −11.2 | Advancers minus decliners, smoothed. The US is falling away faster. |
Five names out of seventeen carry a size this morning. The other twelve are in the table further down, and two of them have the best-looking charts on the page.
| # | Name | Side | Entry · trigger · get out | Why it is on this list | Size |
|---|---|---|---|---|---|
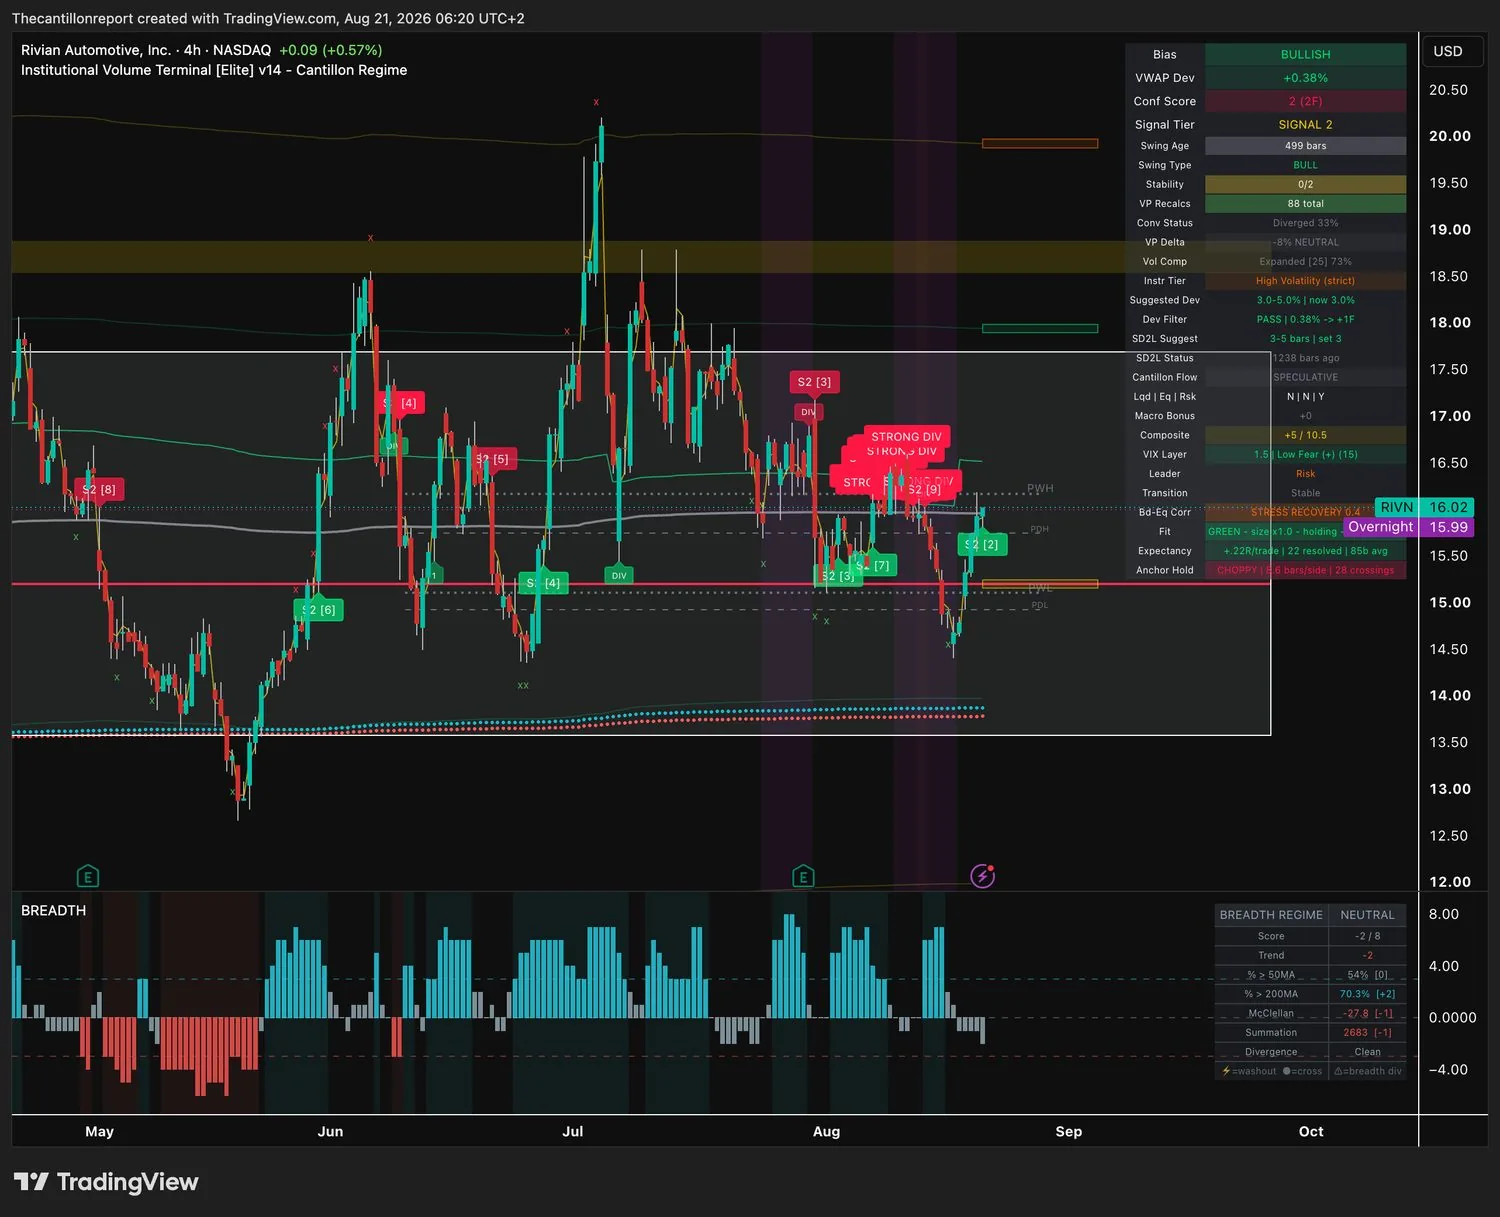
| 1 | RIVN Rivian | Long | +0.38% · $16.02 window $15.96–$16.44 trigger $16.44 · out $15.96 |
The only long here that has already earned its entry rather than waiting for one, and the only one with a record above the twenty-signal floor. Entry qualified · record +.22R on 22 signals · light GREEN, holding · confirmation 2 across 2 timeframes · 28 crossings of its own cost line | Half |
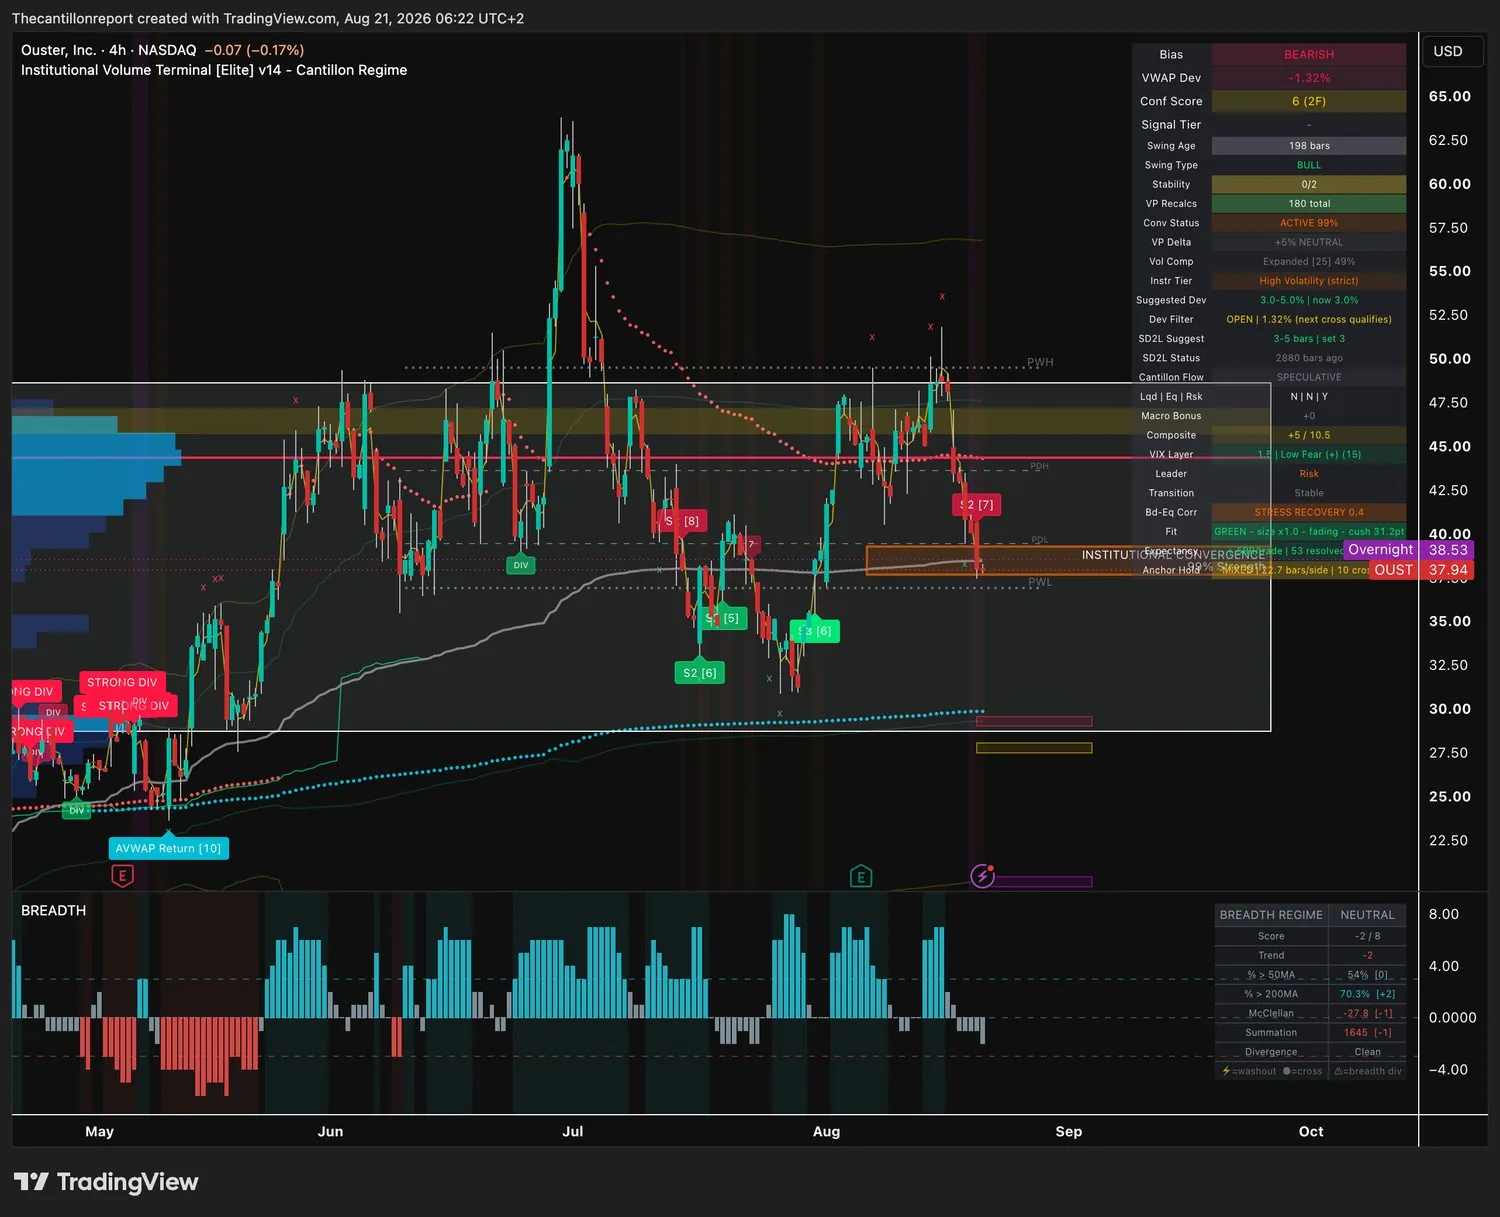
| 2 | OUST Ouster | Short | −1.32% · $37.94 window $37.30–$38.45 trigger $37.30 · out $38.45 |
All three of the institution's cost lines have collapsed onto one price and the stock has already fallen through them. It tested back up to that shelf overnight and failed. Cost lines stacked at 99%, the strongest on the page · light GREEN, 31.2-point cushion, fading · confirmation 6 across 2 timeframes · 53 finished signals, rate not published (see below) | Full |
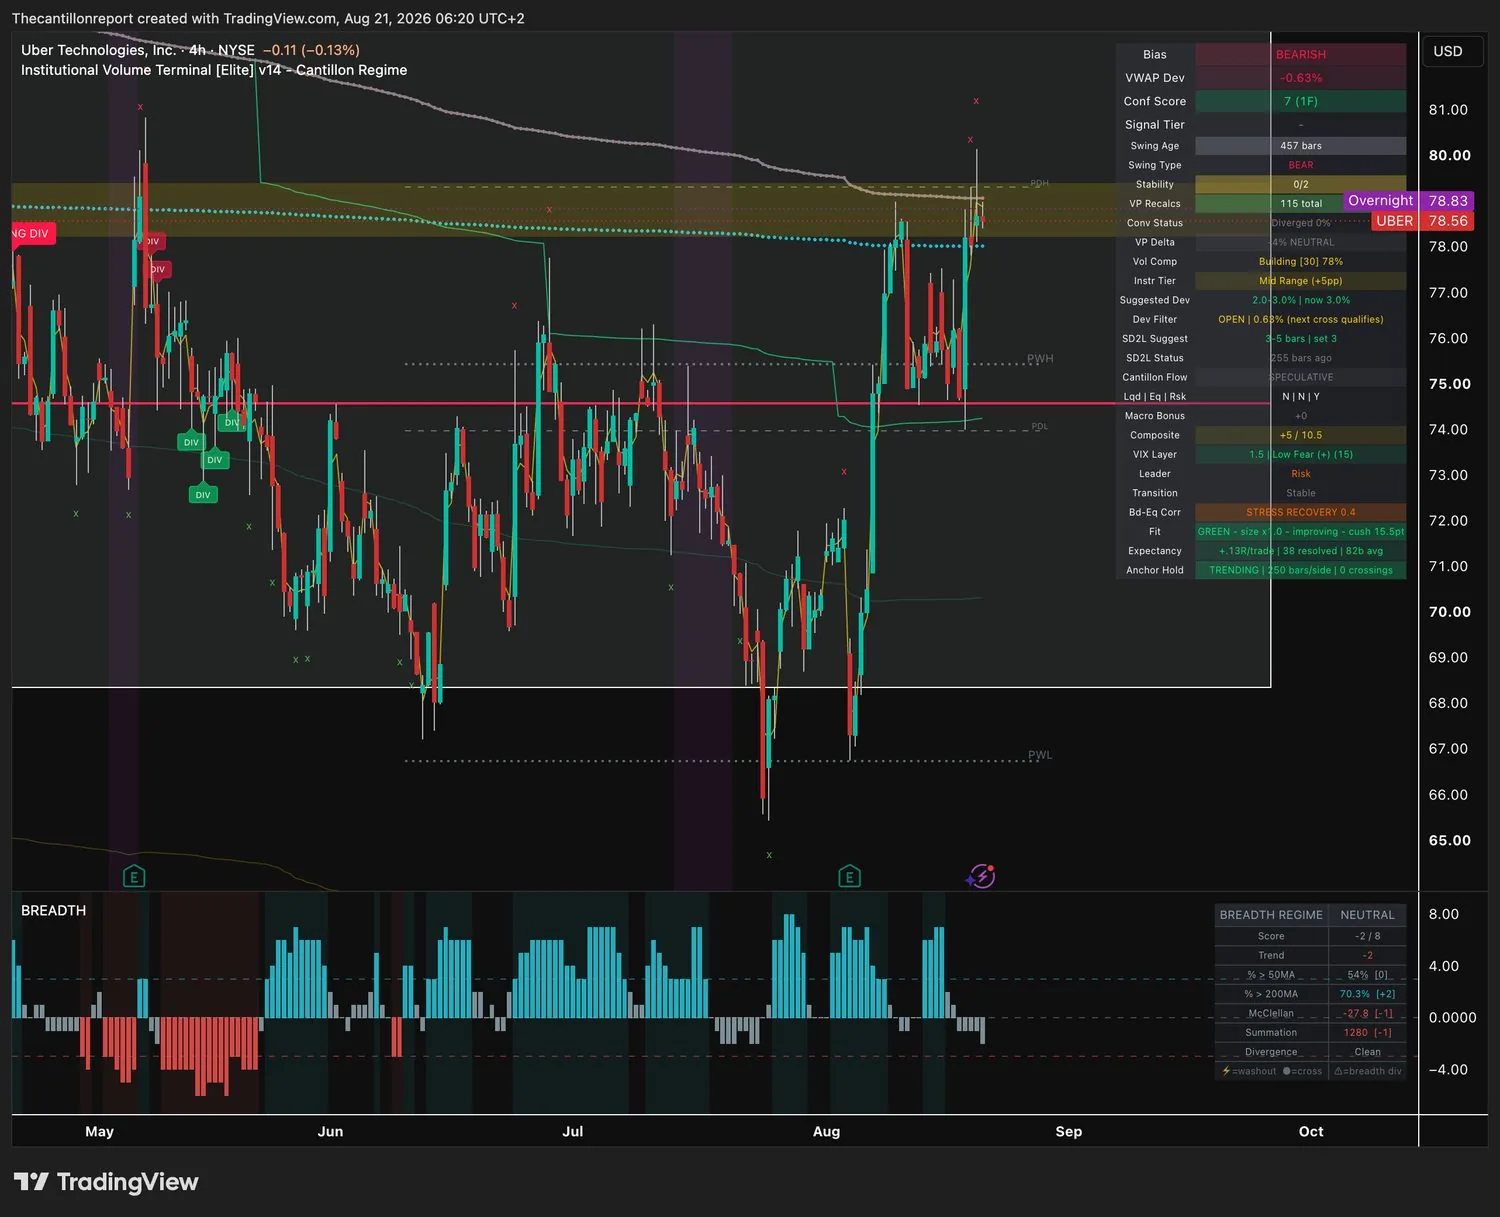
| 3 | UBER Uber | Short | −0.63% · $78.56 window $76.69–$79.06 trigger $76.69 · out $79.06 |
Price has not crossed its own cost line once in the whole 250-bar window. That is the cleanest structure in the scan and the best thing you can have underneath a position you intend to hold. Zero anchor crossings in 250 bars · record +.13R on 38 signals · light GREEN, 15.5-point cushion, improving · compression building at 78% · entry factor not earned until the cross | Full on the trigger |
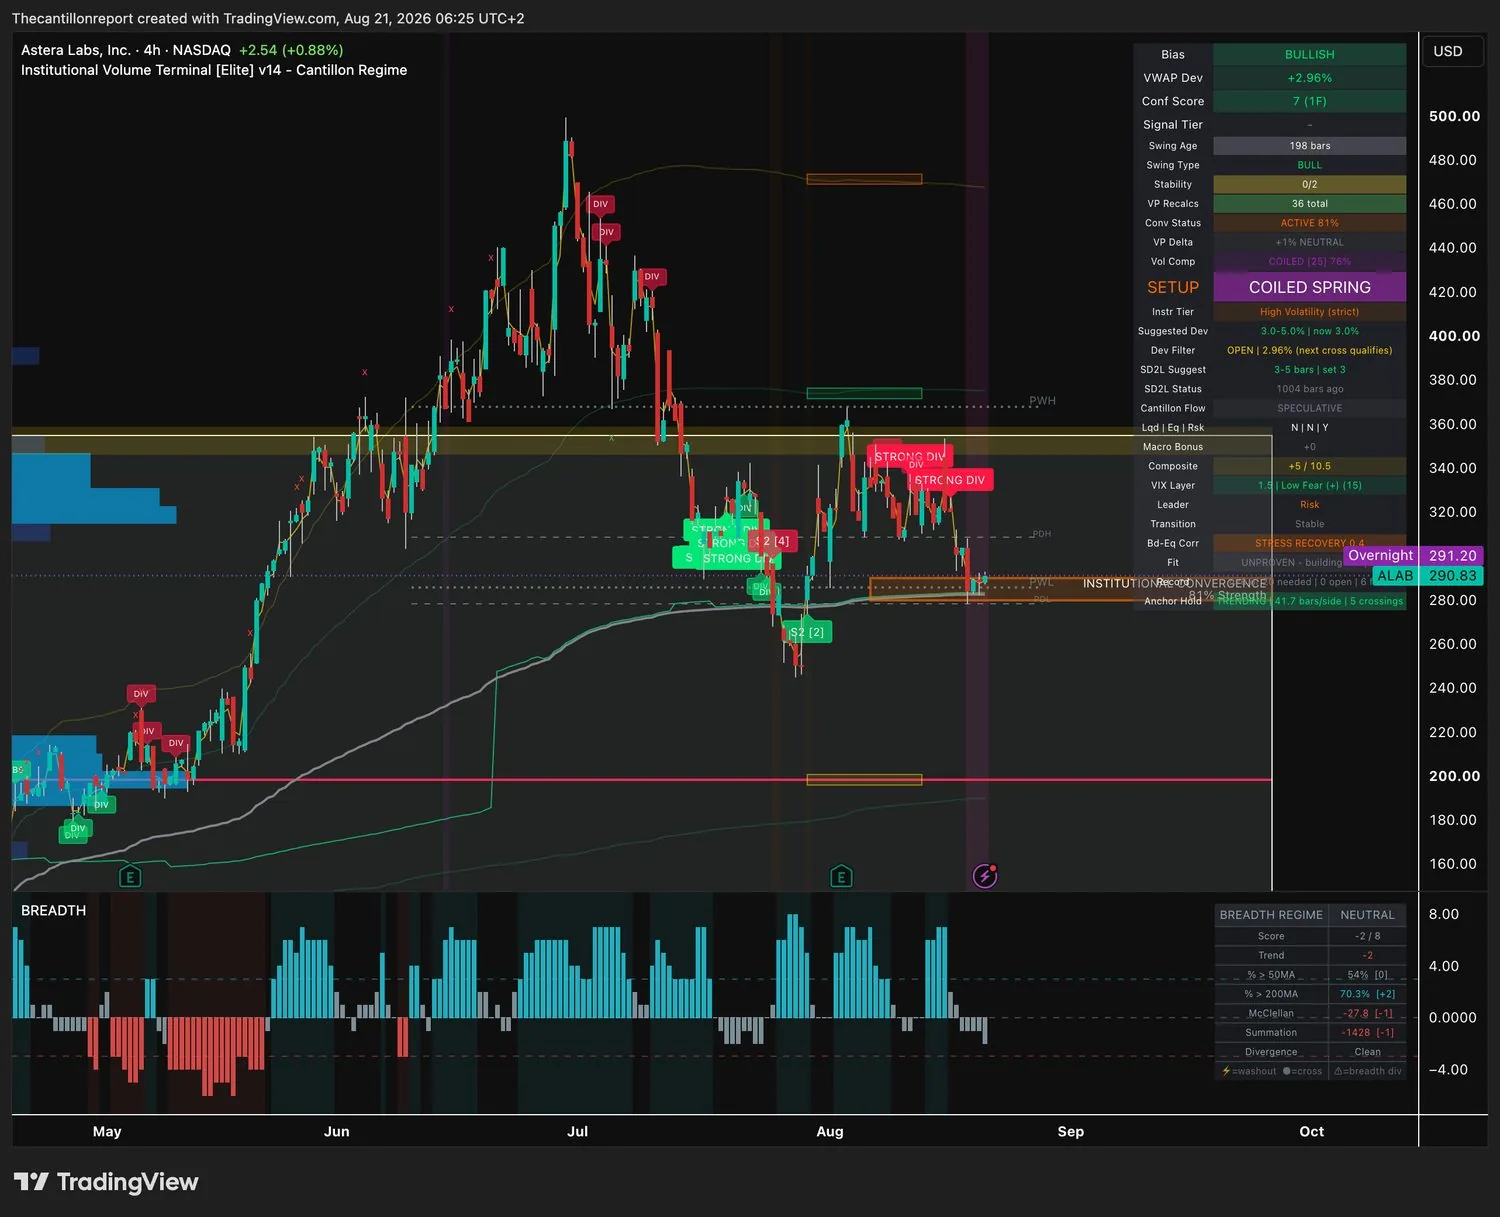
| 4 | ALAB Astera Labs | Long | +2.96% · $290.83 window $282.47–$290.94 trigger $290.94 · out $282.47 |
Eleven cents from its trigger, and it printed straight through it overnight at $291.20. The best-shaped chart in the scan, on the thinnest history in the scan. Coiled spring, compression 76% with cost lines converged at 81% · confirmation 7 across 1 timeframe · 6 of the 20 signals needed before any rate is published | Paper |
| 5 | MAGS Roundhill Mag 7 | Long | +1.76% · $66.89 window $65.73–$67.04 trigger $67.04 · out $65.73 |
Fully coiled with buyers clearly dominant, and fifteen cents from running out of window. Nine finished signals is one short of half the sample needed to publish anything. Coiled 91% · buyers dominant +17% at the most-traded price · confirmation 4 across 2 timeframes · 9 of the 20 signals needed | Paper |
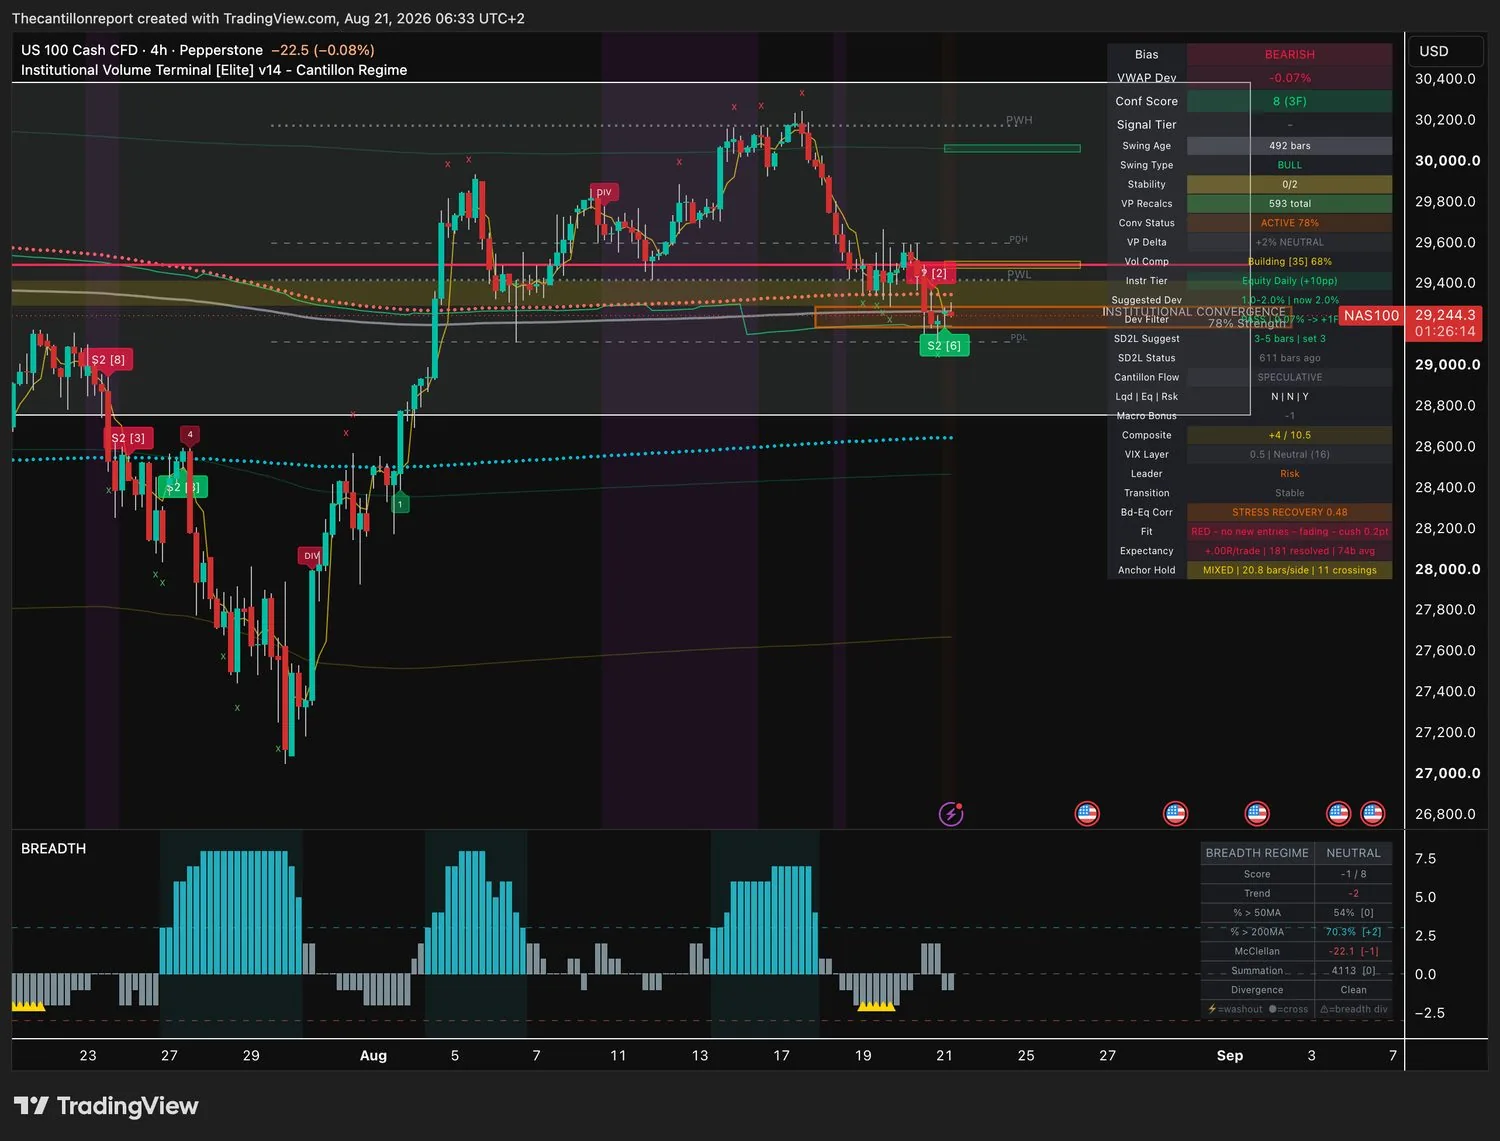
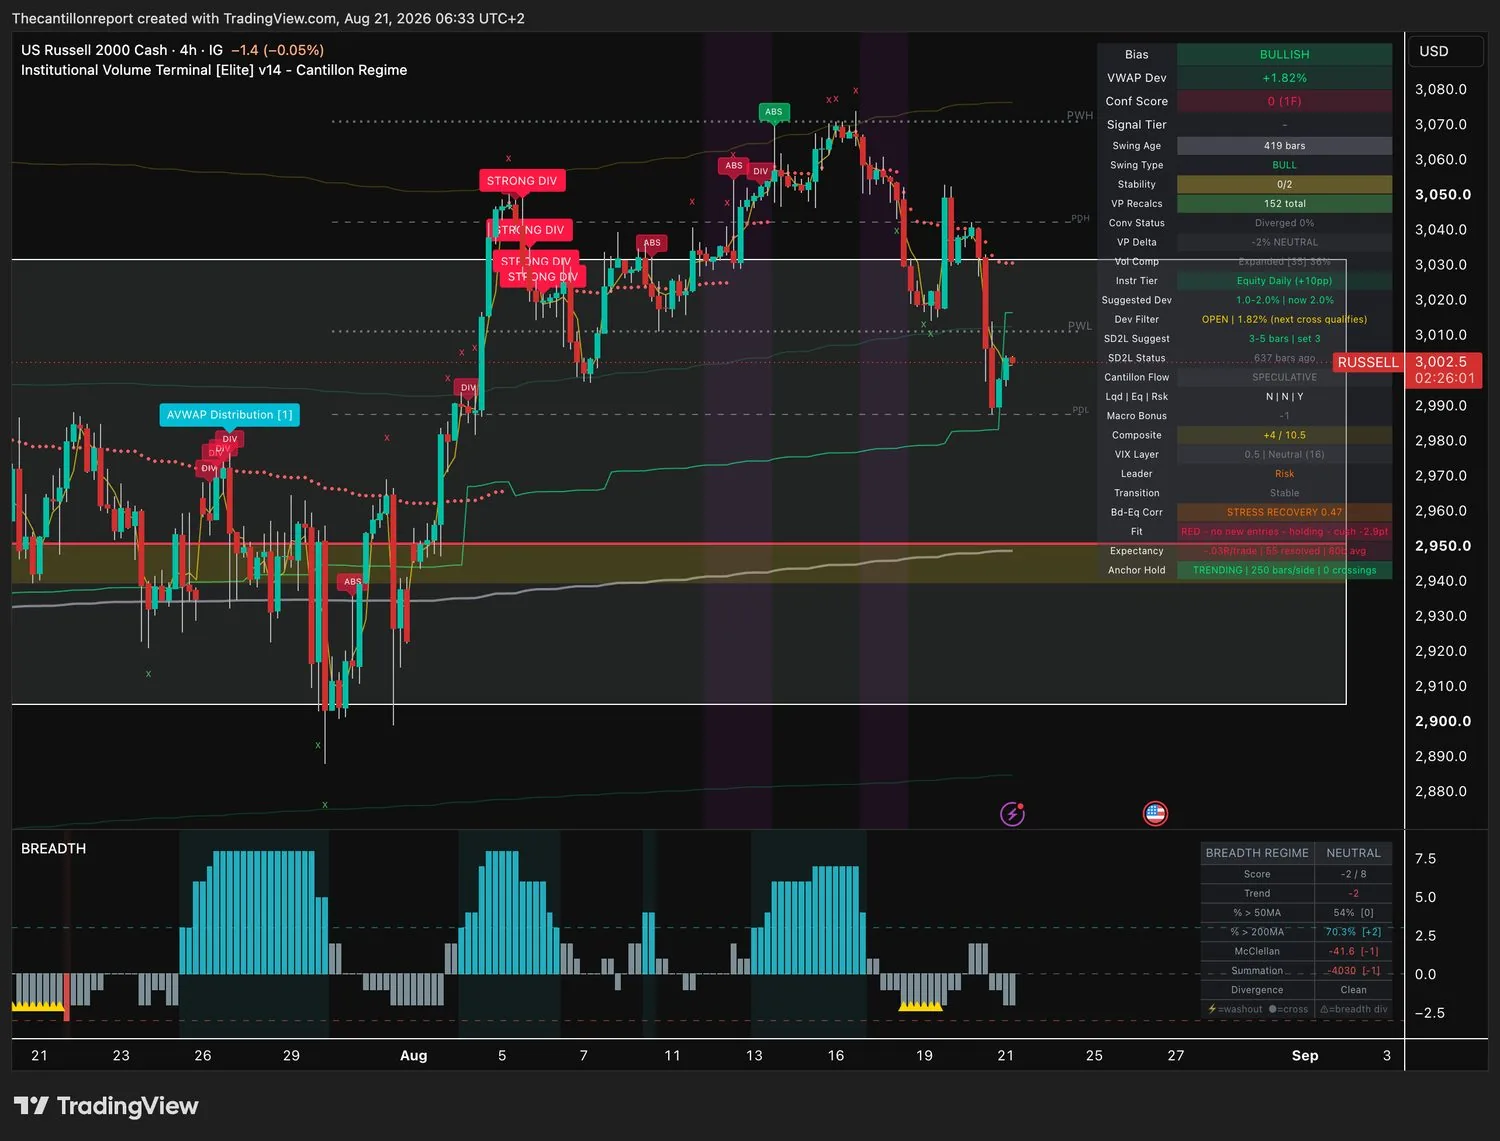
The Nasdaq is sitting twenty points under the price institutions paid. Not two percent under. Twenty points, or 0.07%. That is the tightest reading anywhere in this scan and it is the only US index that still qualifies for an entry on distance alone. Confirmation is 8 across three timeframes, the highest number on the page, and the three cost lines have converged at 78% strength. The S&P is 2.47% past its own line, the Dow 2.2% past, and the Russell is 5.3 index points from joining them. The trend light on the Nasdaq is red, so this is not a buy. Reclaim 29,265 and the red lights below start turning one at a time. Lose it and the two American coils on this page never get their chance.
This one is free. The other four this week were not.
Every level, every execution block and all seventeen terminal captures, with nothing held back and no gate anywhere on the page. Monday through Thursday the entry levels sit behind the member wall. Every Friday the whole thing ships open.
What you are doing: buying a stock six cents above what institutions paid for it, on a cross that has already happened, at half the size you would normally take. Half, because this is the least patient chart on the page. It has flipped from one side of its cost line to the other 28 times, and the average position here needs 85 bars to resolve.
What you are doing: selling underneath a shelf where all three institutional cost lines have stacked on top of each other, after the stock tested that shelf overnight and could not hold above it. Full size, because this is the only position today with a green light, an open window and a deep enough history at the same time.
What you are doing: nothing yet, and setting an alert. This is the most disciplined price structure in the entire scan, 250 bars on each side of its cost line without a single flip, and the framework does not credit the entry until the cross actually happens. You wait for the cross. If it never comes you never own it, and that is the correct outcome.
Twelve names. Every one of them carries a red trend light, which sets size to zero no matter what the chart shows. Three of the twelve have better structure than anything on The Board.
| Name | Distance from cost | Comes back at | Why it is not a trade |
|---|---|---|---|
| NAS100 | −0.07% | Window already open | Twenty points under cost with the highest confirmation on the page, 8 across three timeframes, cost lines converged at 78%. Record is exactly .00R over 181 signals and the light is red with a 0.2-point cushion. The signal is real, the edge is not. See The One Number. |
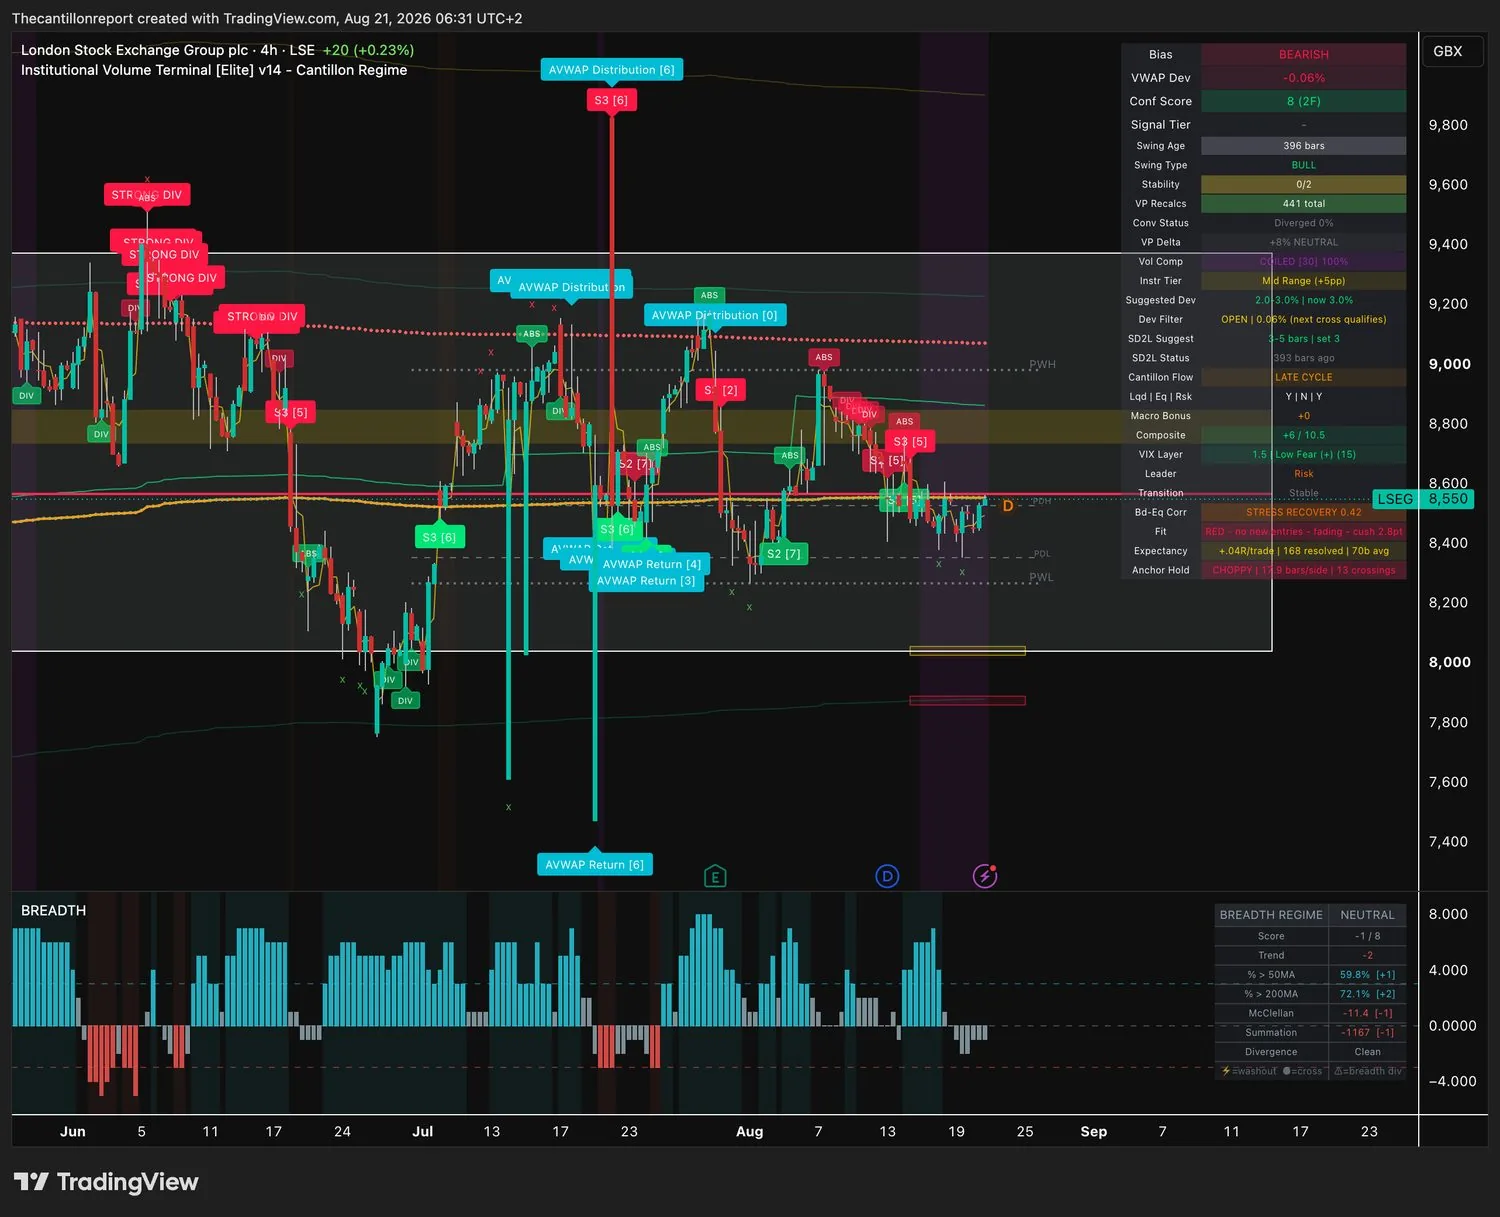
| LSEG | −0.06% | Window already open | Compression at 100%, the ceiling, with price sitting six hundredths of a percent off its own cost line. Confirmation 8 across two timeframes. Record +.04R over 168 signals, light red and fading. The best-wound chart in the scan and it is untouchable. |
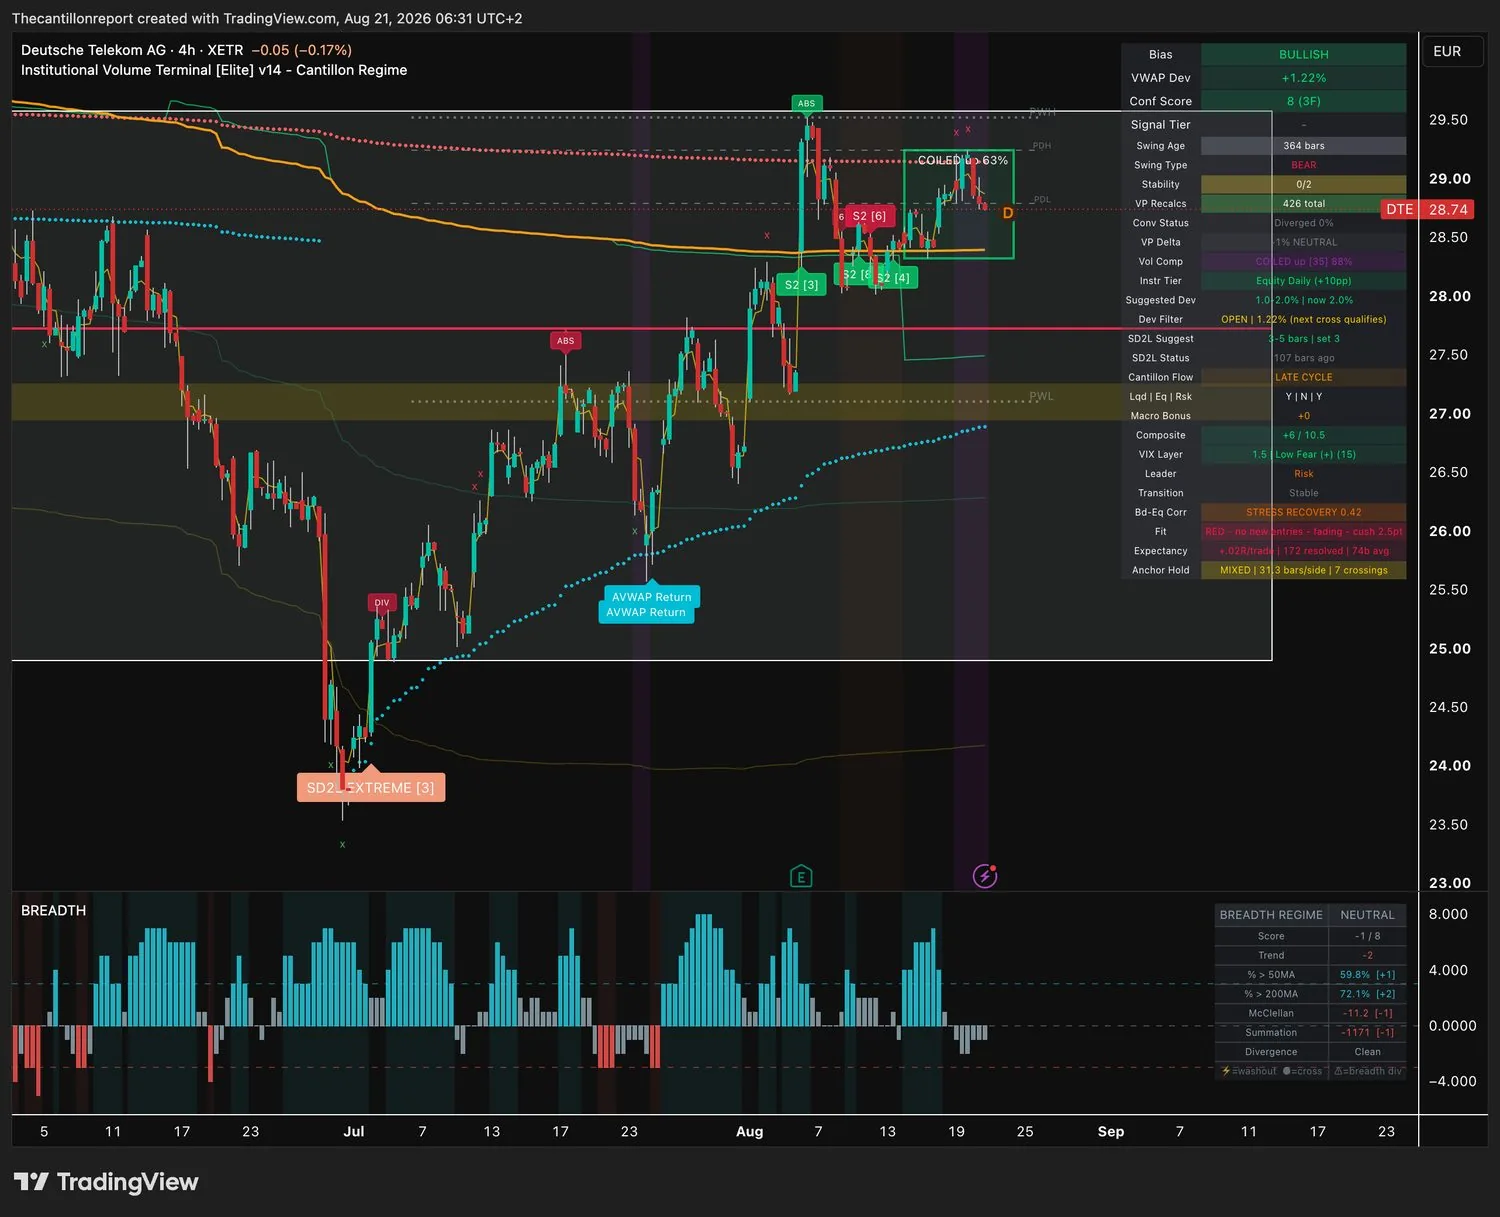
| DTE | +1.22% | Window already open | Coiled at 88% and rising, confirmation 8 across three timeframes, 172 finished signals returning +.02R. Light red, fading, 2.5-point cushion. Best confirmation reading in Europe and it still sizes to zero. |
| USOIL | −0.99% | Window already open | Coiled at 88% and bearish while the tape bids it on Iran headlines. 273 finished signals, the deepest sample in the scan, returning −.06R. The most-tested pattern on the page loses money. No position either way. |
| NXE | +0.57% | Window already open | Compression building at 98%, almost fully wound, and sitting half a percent off cost. Record −.16R over 70 signals is the worst on this page. Captured Thursday evening rather than Friday morning, so re-check it before anything else. |
| CMCSA | +1.99% | Window already open | Compression building at 75% and an oversold reversal fired 39 bars ago. 128 finished signals returning exactly .00R, sitting a tenth of a point underwater on the cushion. The pattern is tested, improving, and worth nothing so far. |
| NEE | −0.47% | Window already open | Building at 91% and half a percent under cost, so the window is wide open. Light red and improving on a 10.9-point deficit, record −.13R over 59. Good position, wrong pattern. |
| MELI | +1.19% | Window already open | No compression at all, 21%, so there is nothing stored to release. Record −.05R over 74 and the light is red and fading. Nothing has to happen here. |
| SPOT | +1.85% | Window already open | Bullish reading on a bearish multi-week structure with the range already expanded at 31%. Record −.12R over 29 signals and a negative cushion of 12.1 points, the deepest red on the page. |
| SP500 | +2.47% | 7,620 | Shut. Confirmation 1 on one timeframe, no compression behind it, record −.02R over 30. There is nothing here at any price and the window does not reopen for another 35 index points. |
| US30 | +2.2% | 52,665 | Confirmation zero. Not low, zero. The window shut 104 points ago and the record is −.04R over 81. Watch the reset level and nothing else. |
| RUSSELL | +1.82% | Open by 5.3 points | Confirmation zero here too, and the range is barely compressed at 36%. The window is still open and it shuts at 3,007.8, which is 5.3 points away. |
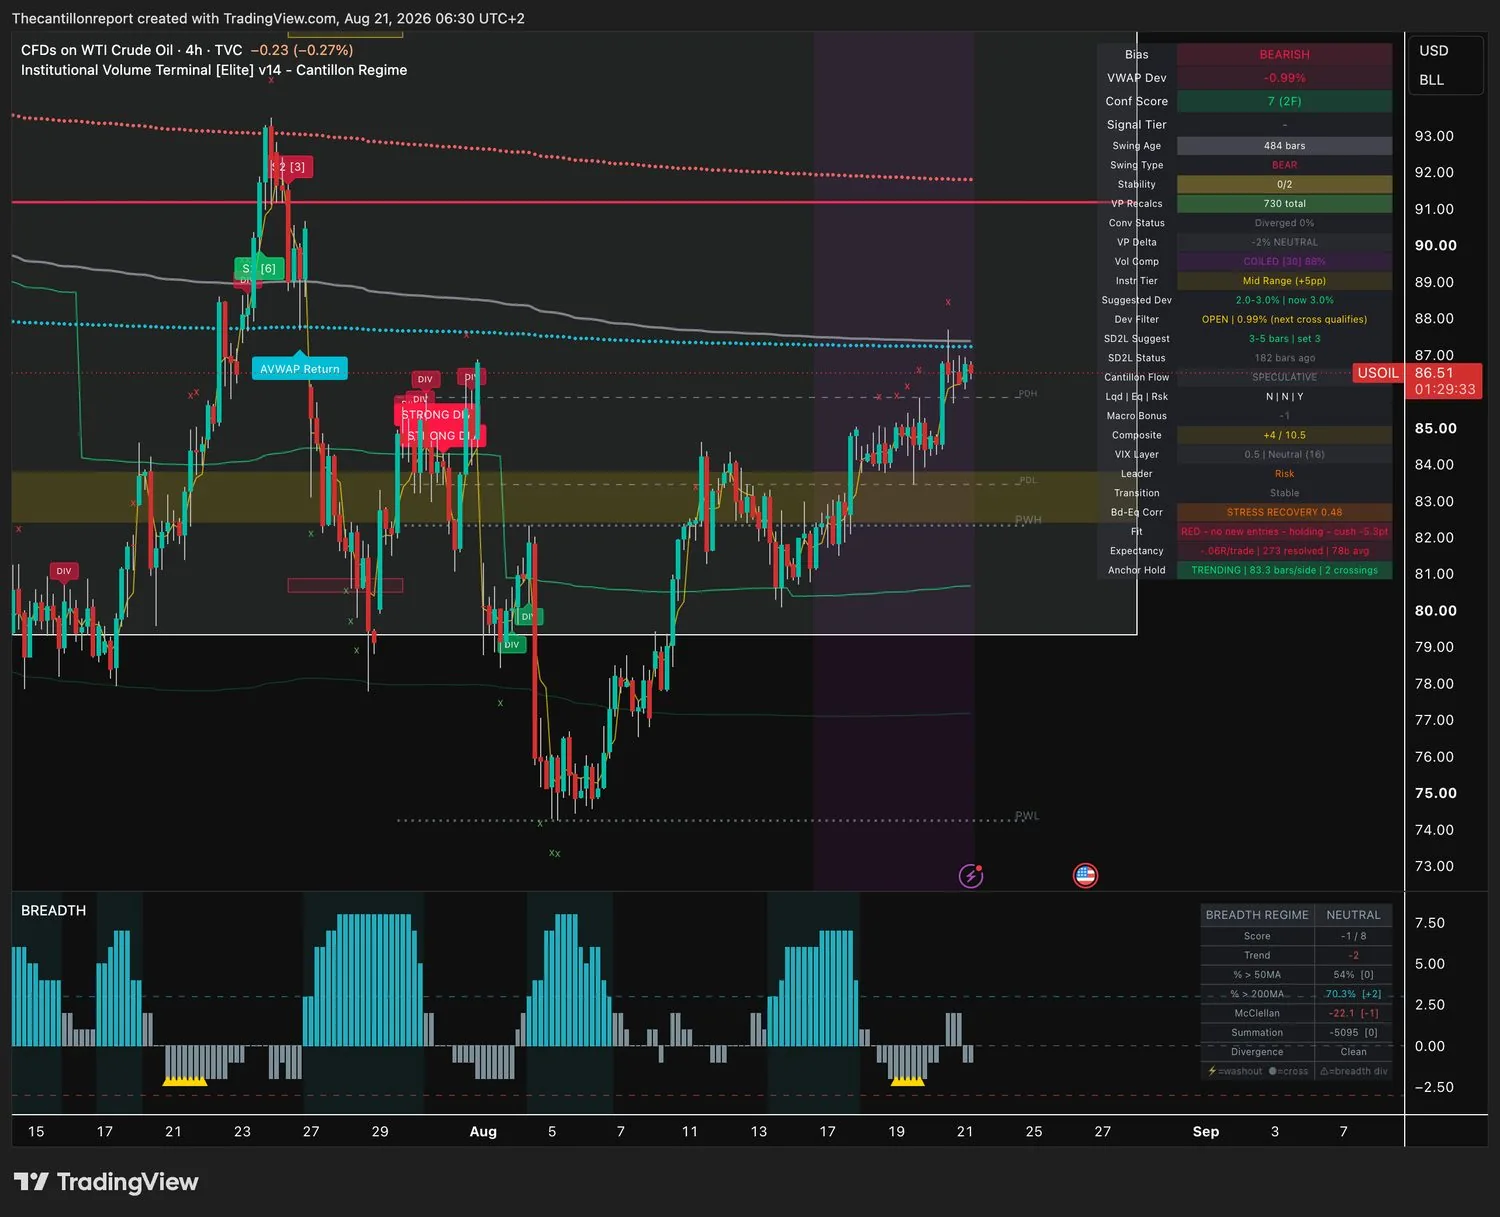
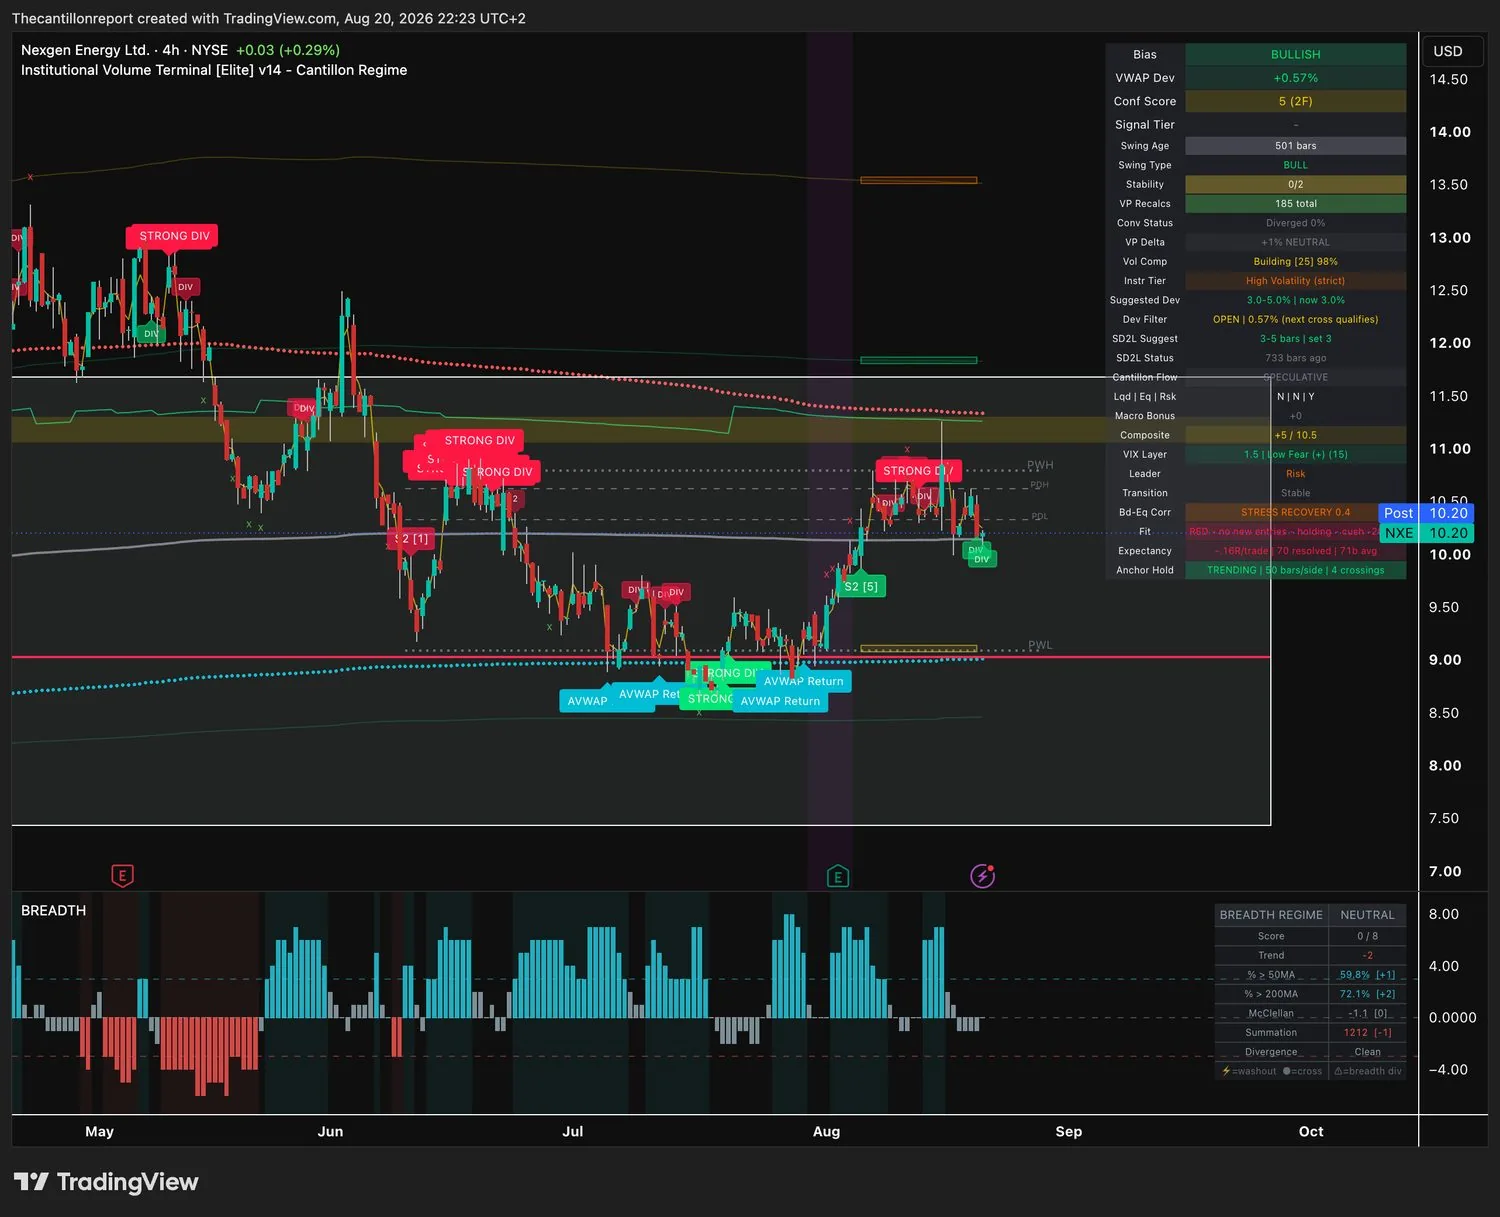
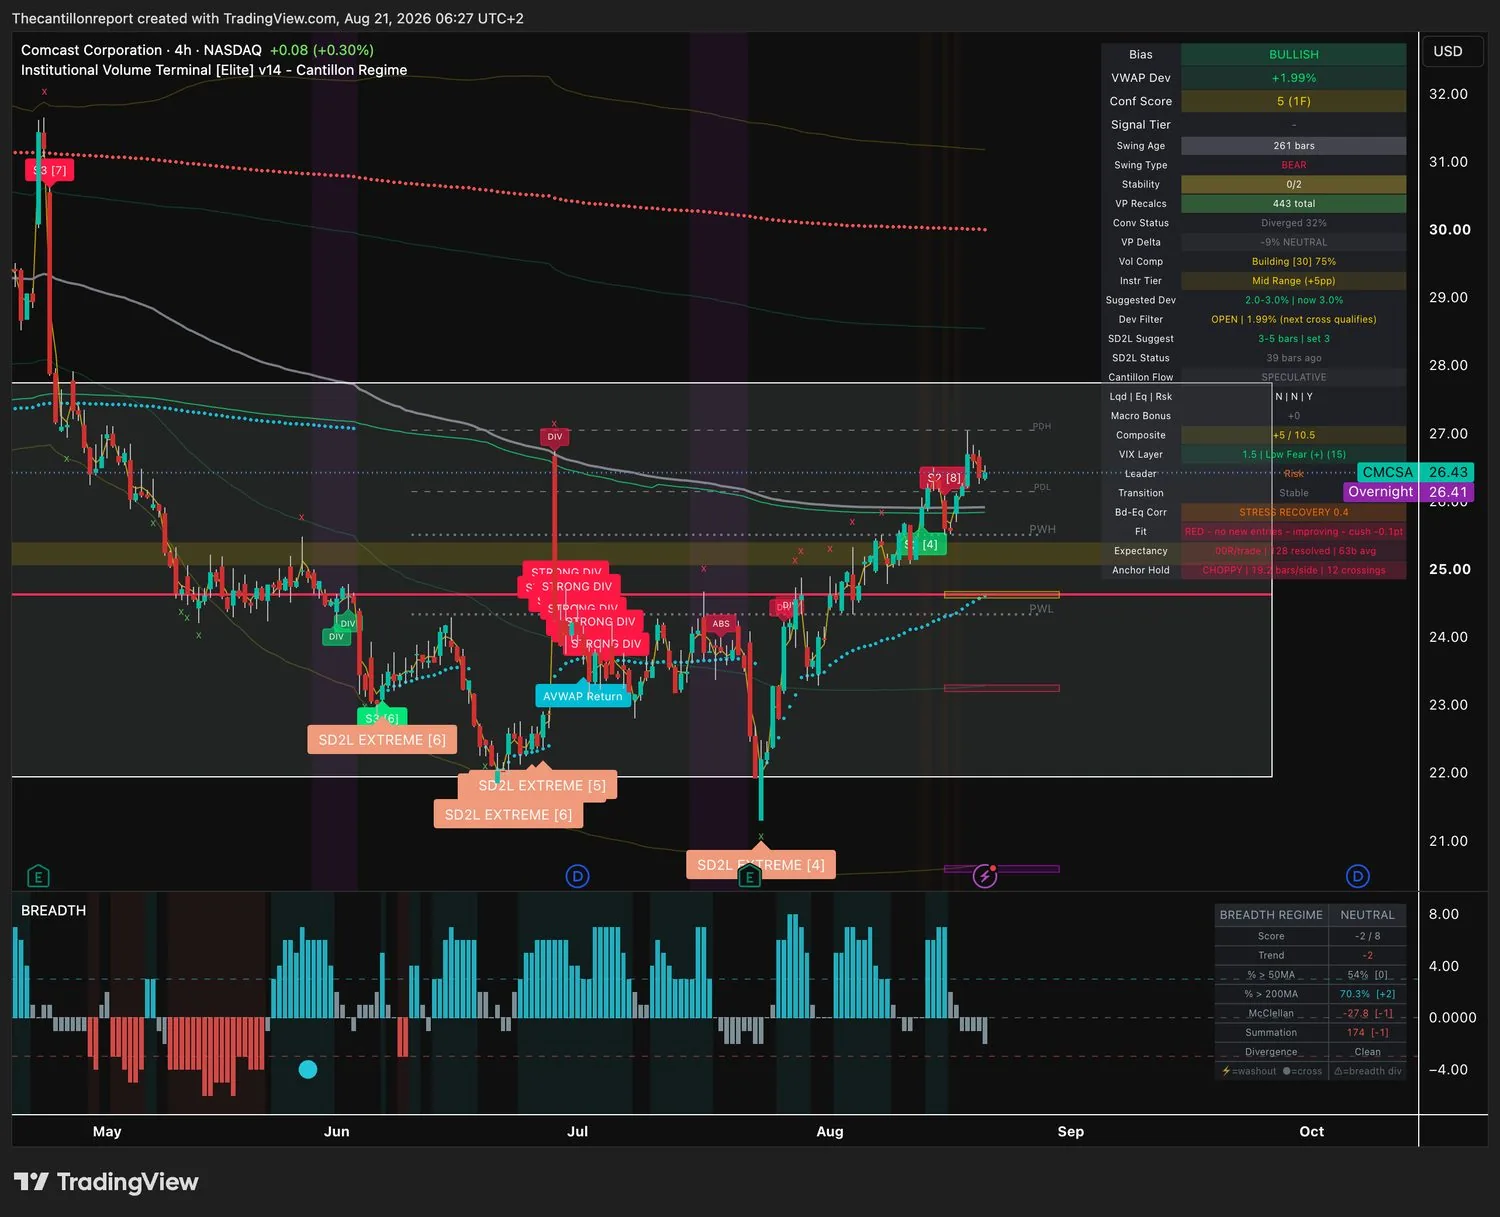
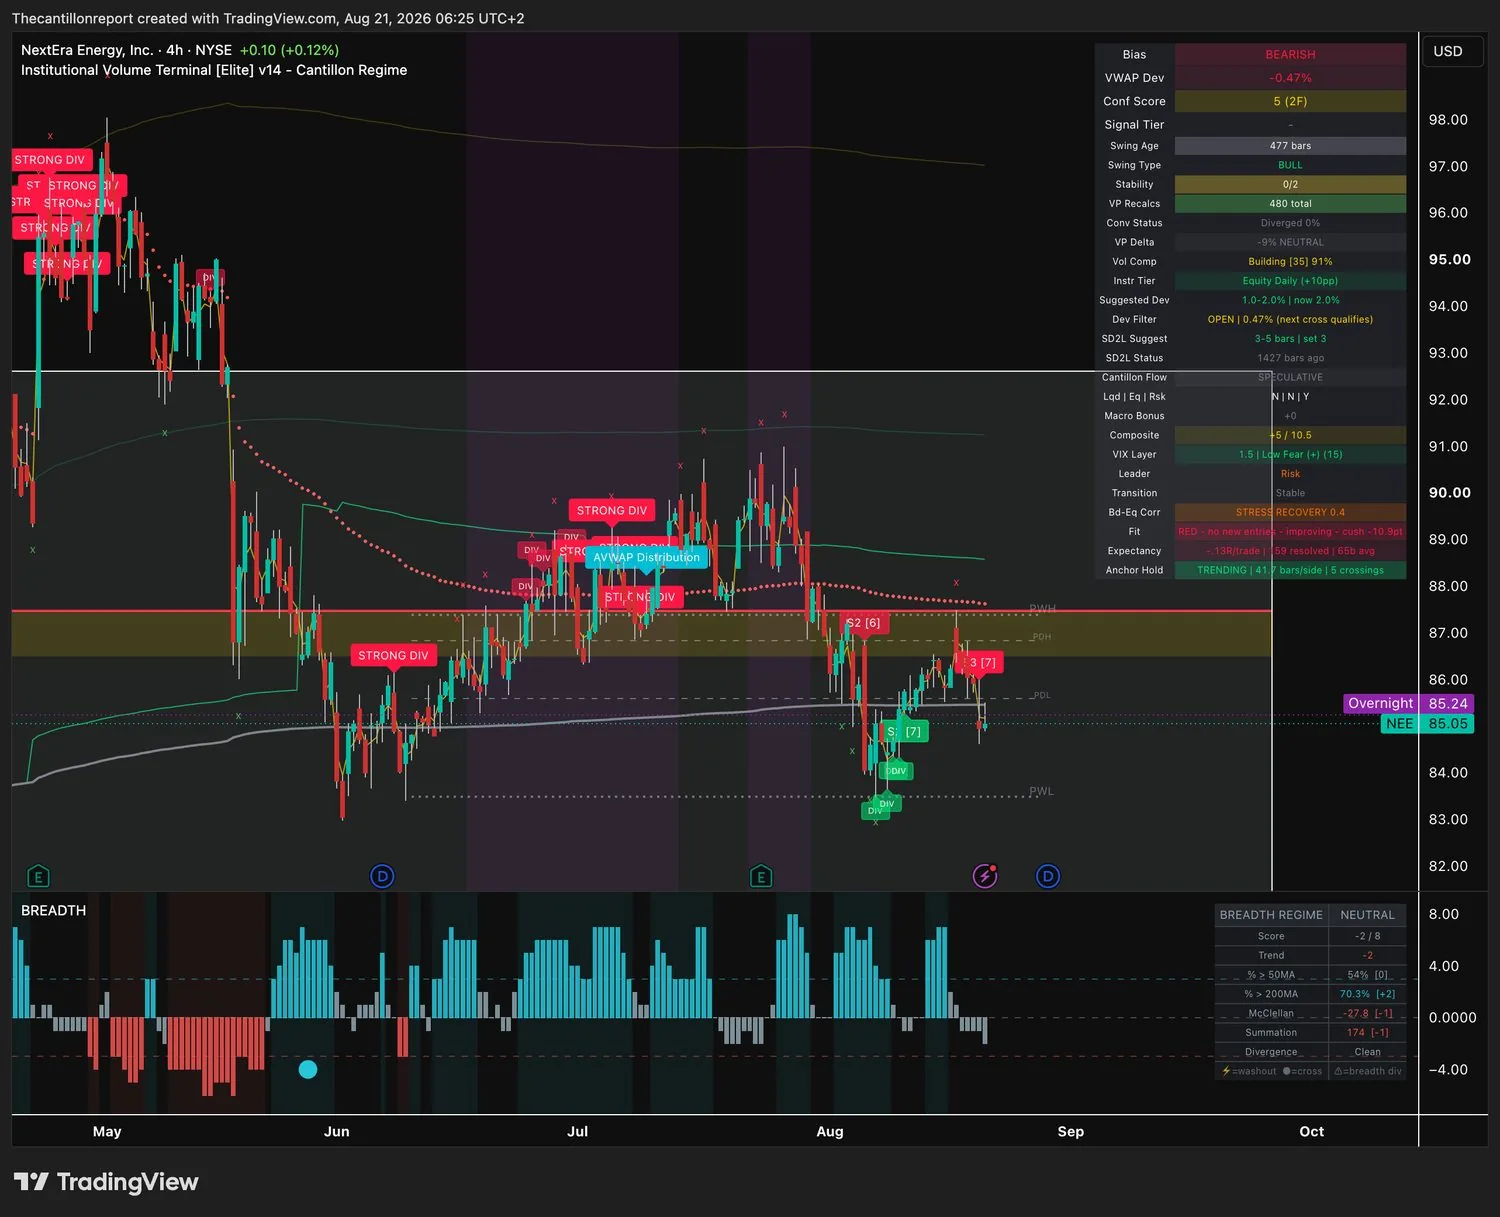
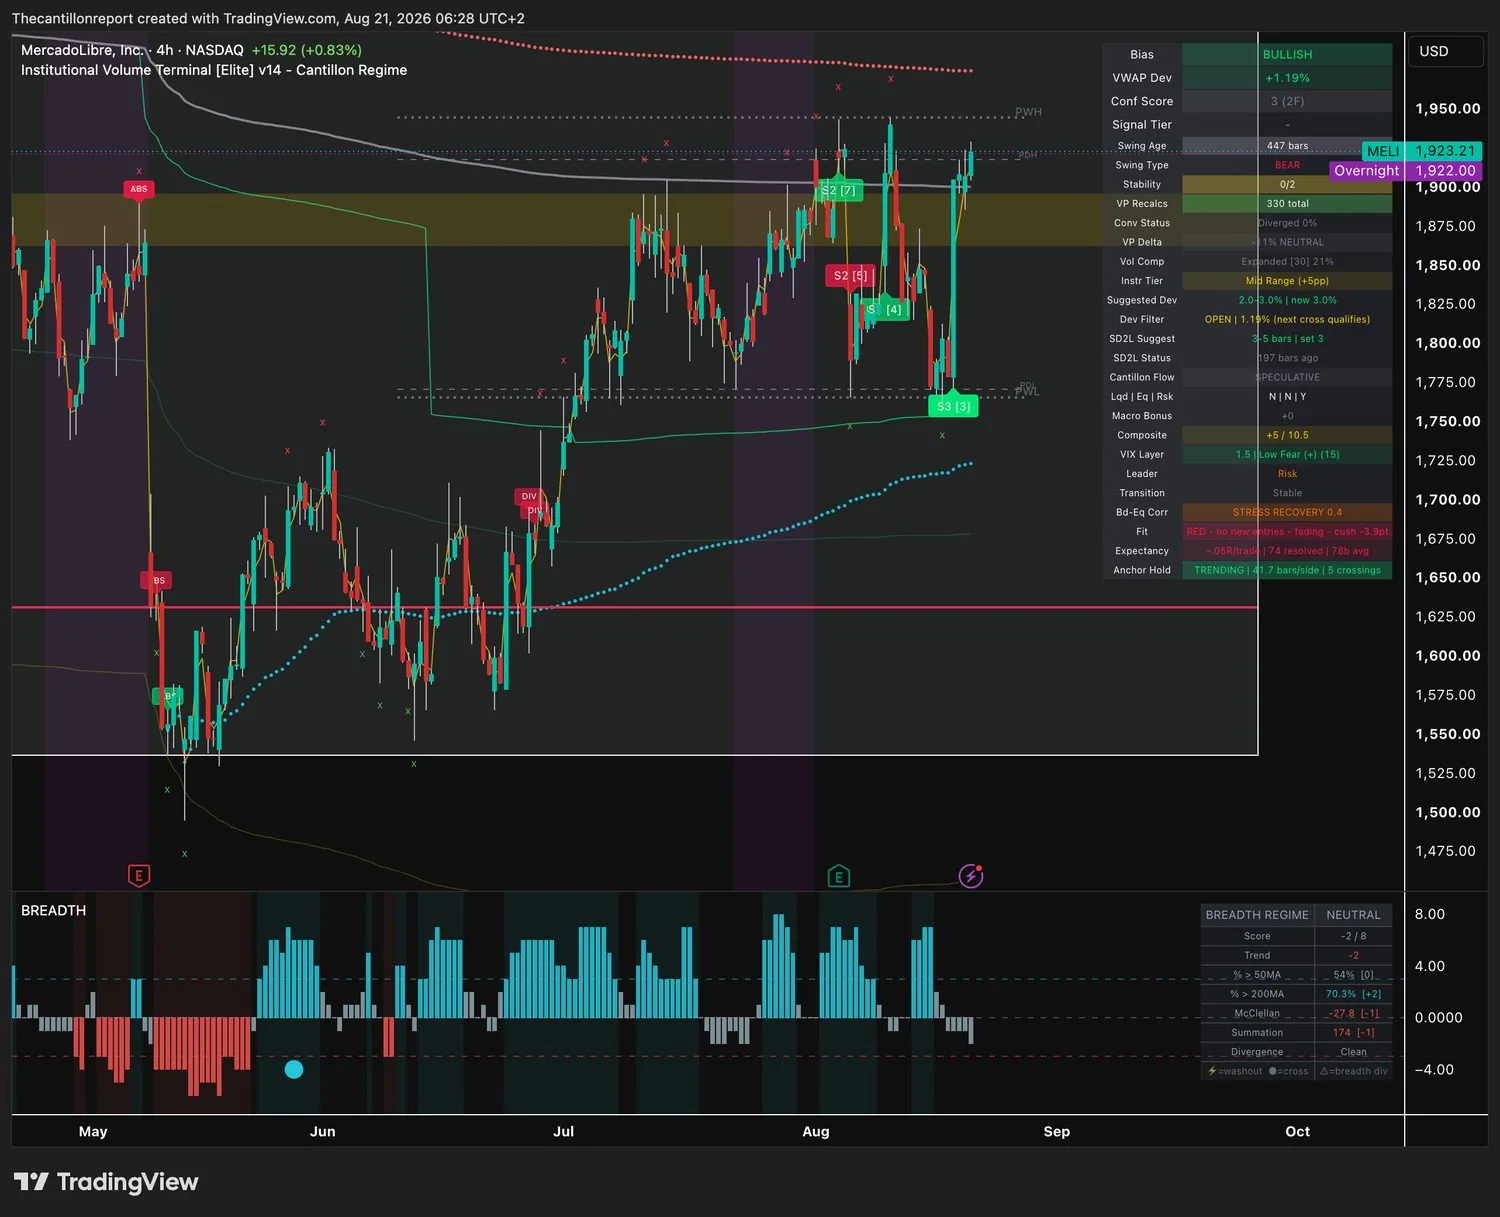
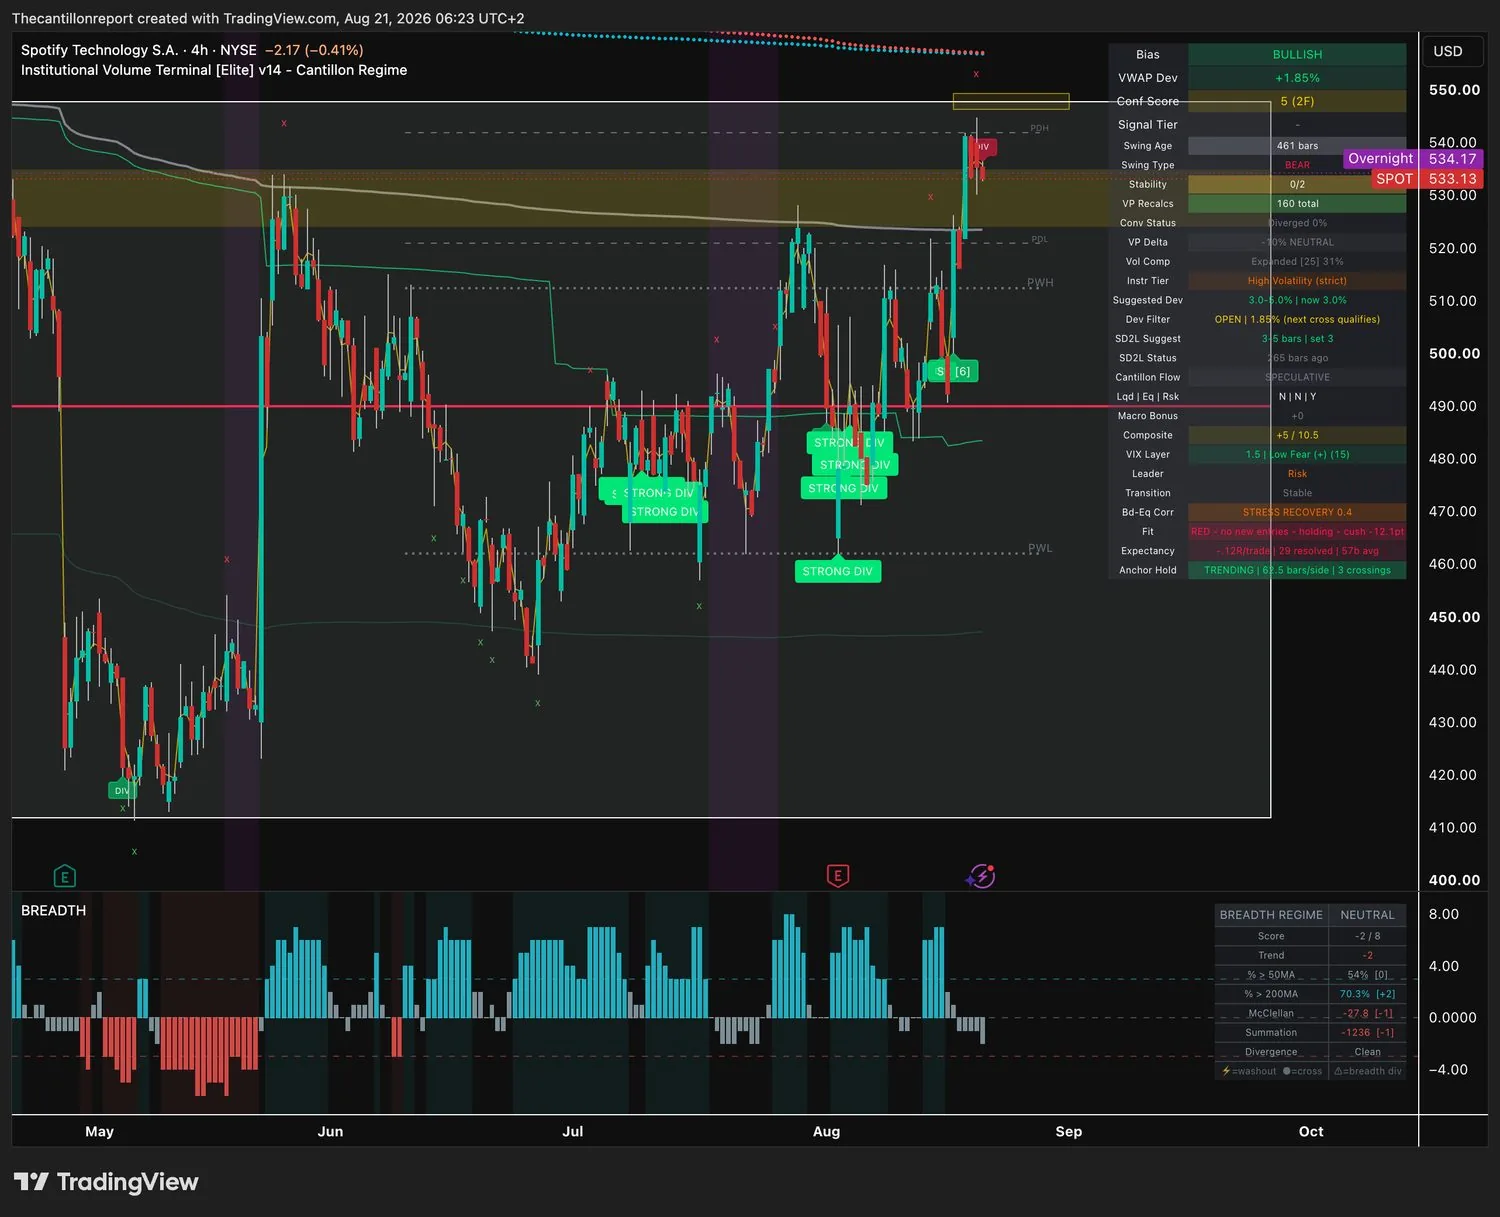
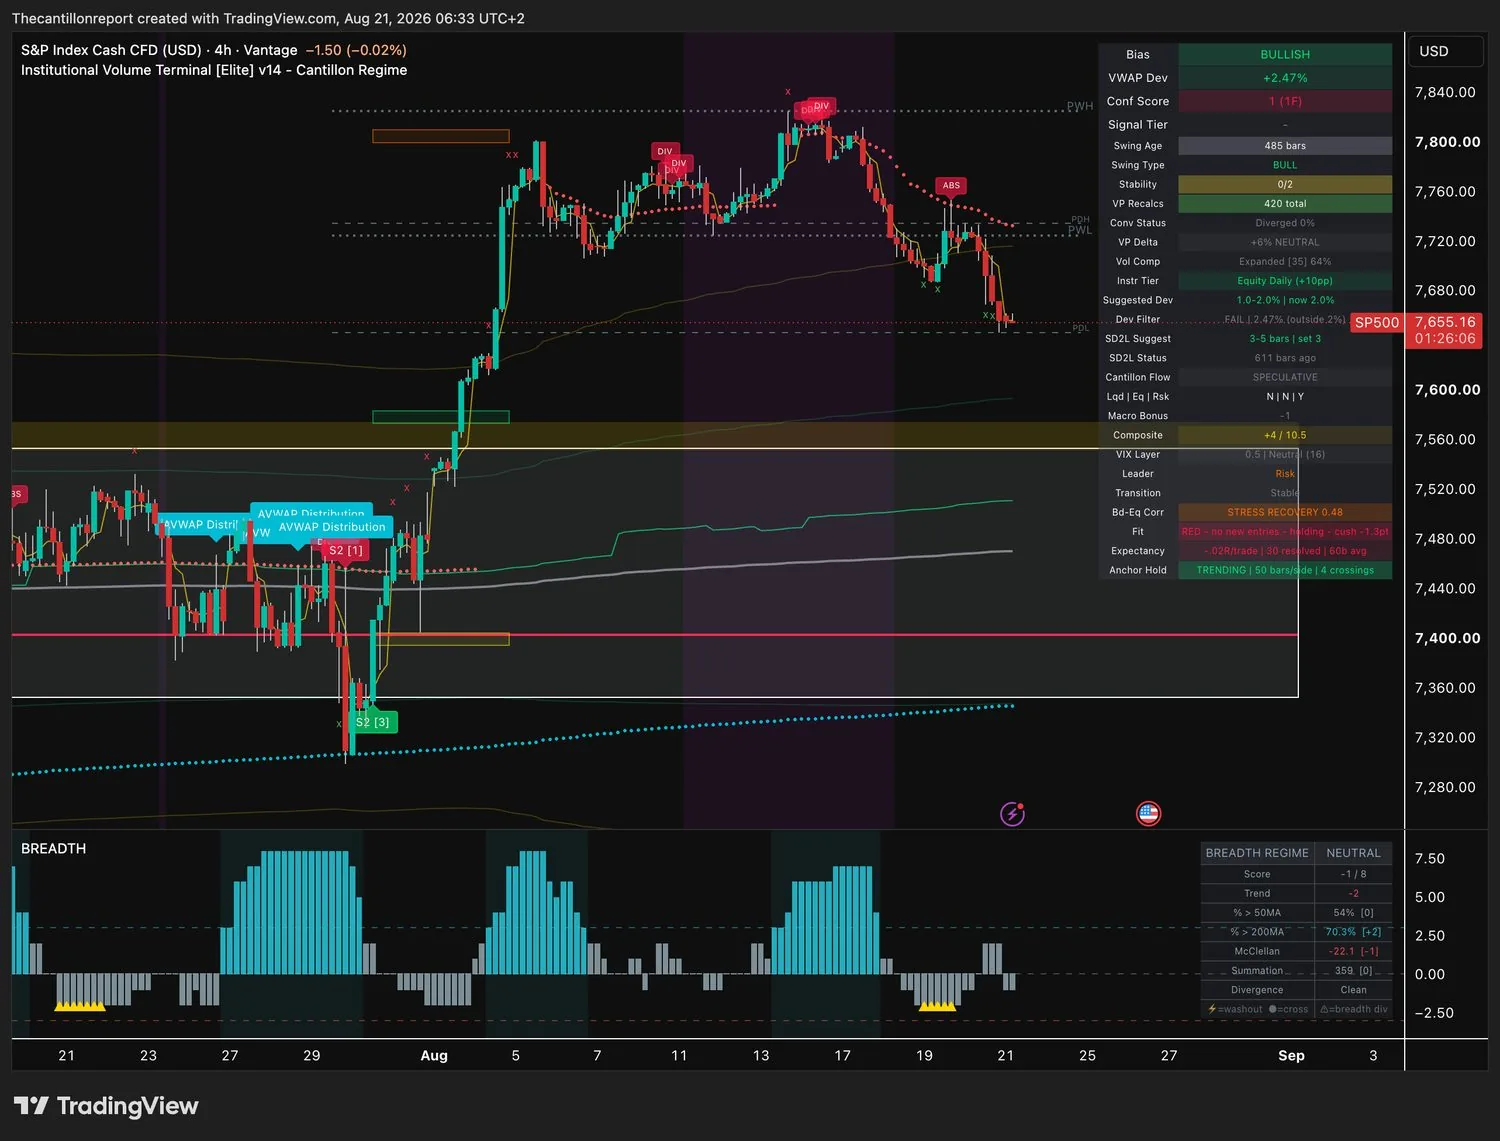
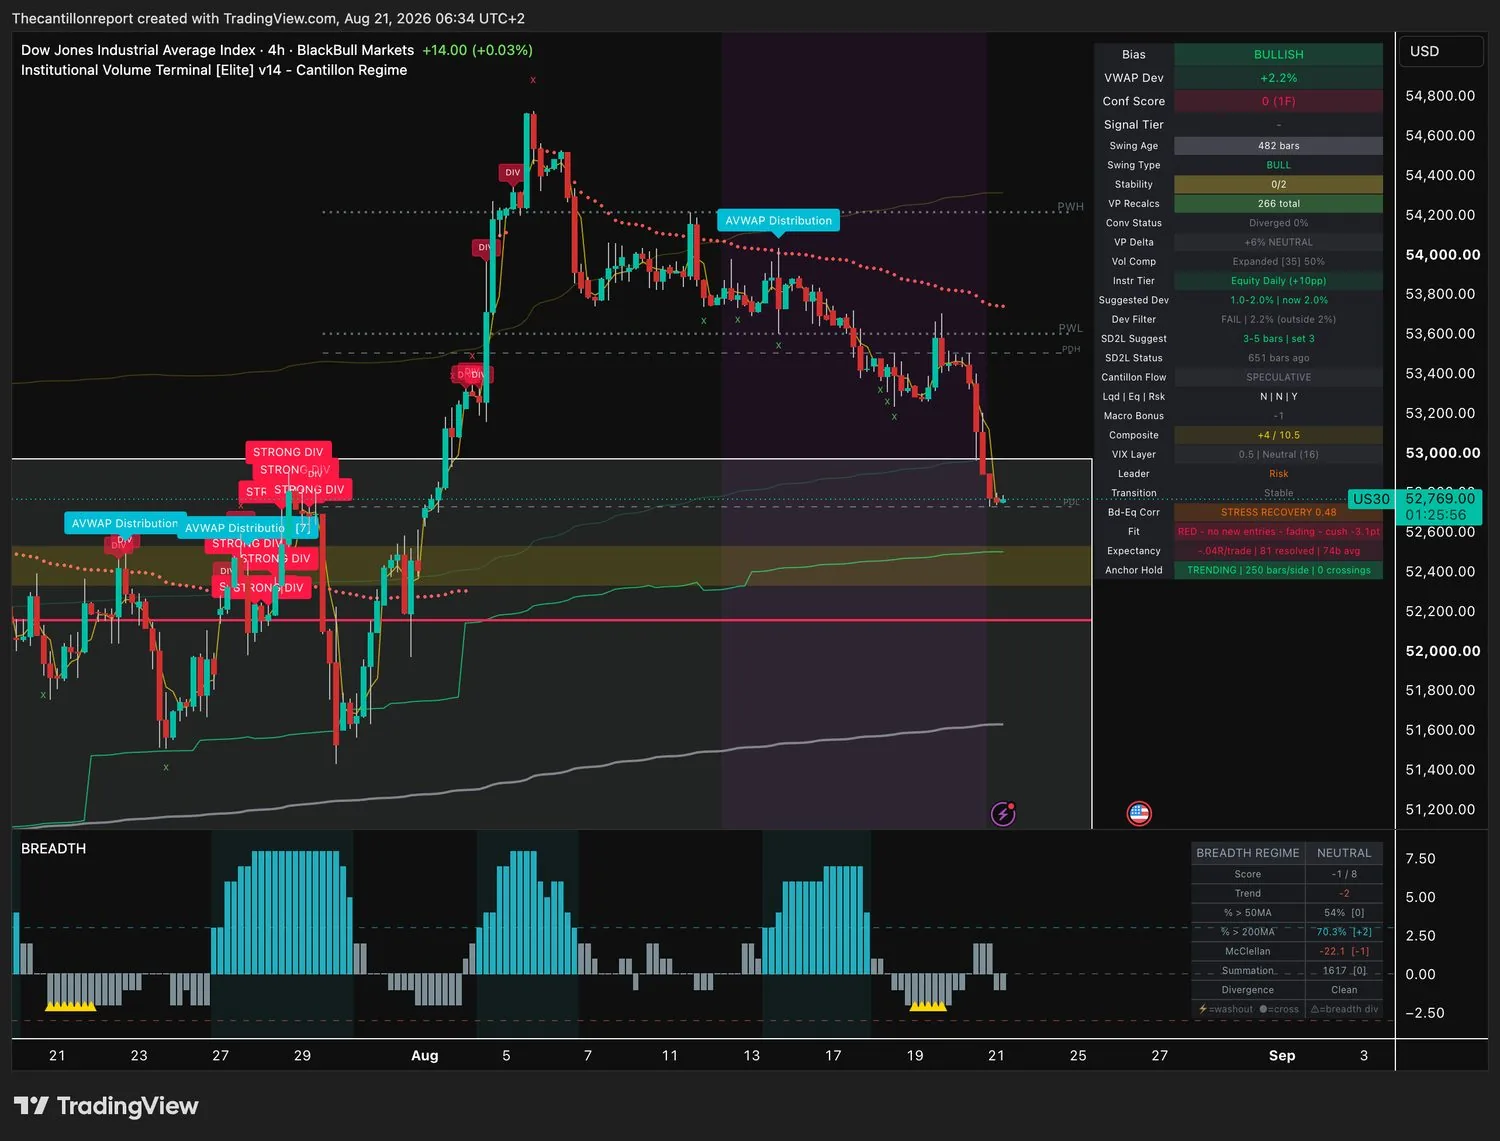
Cost line (the anchor) · the volume-weighted price large money actually paid over the current swing. Everything in this brief is measured as distance from it. Buy near it and you are paying what they paid. Buy far above it and you are paying their profit. Entry window · how far from the cost line a new entry can still be sensibly priced. Open means you are inside it. Shut means the move has already run and you wait for a pullback. The trigger in every row above is a four-hour close through the far edge of that window, in the trade's direction. Beyond it the move is confirmed and you are late. Compression · how tightly the range has wound, from 0 to 100%. High means the next move should be a big one. It says nothing about direction, and it never overrides a shut window or a red light. Confirmation · how many independent readings agree, and across how many timeframes. Higher on both counts is better. Two timeframes at 6 beats one timeframe at 8. Record · the average result per signal in units of risk, where being stopped out is exactly −1.00. Always published with the number of finished signals behind it, and never published at all below 20 of them. Read it as a description of the past, not a forecast. Trend light · green means full size, amber means half, red means no new entry however good the chart looks. The cushion is how close the light is to changing.
Readings captured Friday 21 August 2026, 06:20–06:34 CEST, from the IVT v14 terminal, on four-hour bars that had not yet closed. That is why every trigger here is a close and not a touch. NexGen was captured Thursday at 22:23 CEST and is a session older than the rest.
Records are in-sample, calculated over the same history the settings were chosen on, so they describe the past and forecast nothing. Index levels come from cash CFD feeds and will differ from your own index or futures contract. Deutsche Telekom is quoted in euros and London Stock Exchange Group in pence, and neither translates to a US listing. Entry prices and window edges are derived from the percentage distances the terminal publishes, so treat them as accurate to the nearest cent or index point. No level here is meant to survive an earnings gap.
Charts are unmodified terminal captures provided for reference, not as entry instructions. Educational content only. Not financial advice. Past results do not predict future ones.