Full Risk-On. And Every Index Says No.
The cycle score went from +5 to +7 of 10.5 overnight and all three legs switched on, exactly as this brief said they would if the Nasdaq held its line. It did. Then the four indices went on red lights anyway, on a combined record of zero across 344 finished signals. Ford carries the highest confirmation in thirty-one charts, sixteen readings across three timeframes, and it is sitting fifteen hundredths of a percent off its cost line at 13.95. Eleven names carry a size this morning. Six of them are full.
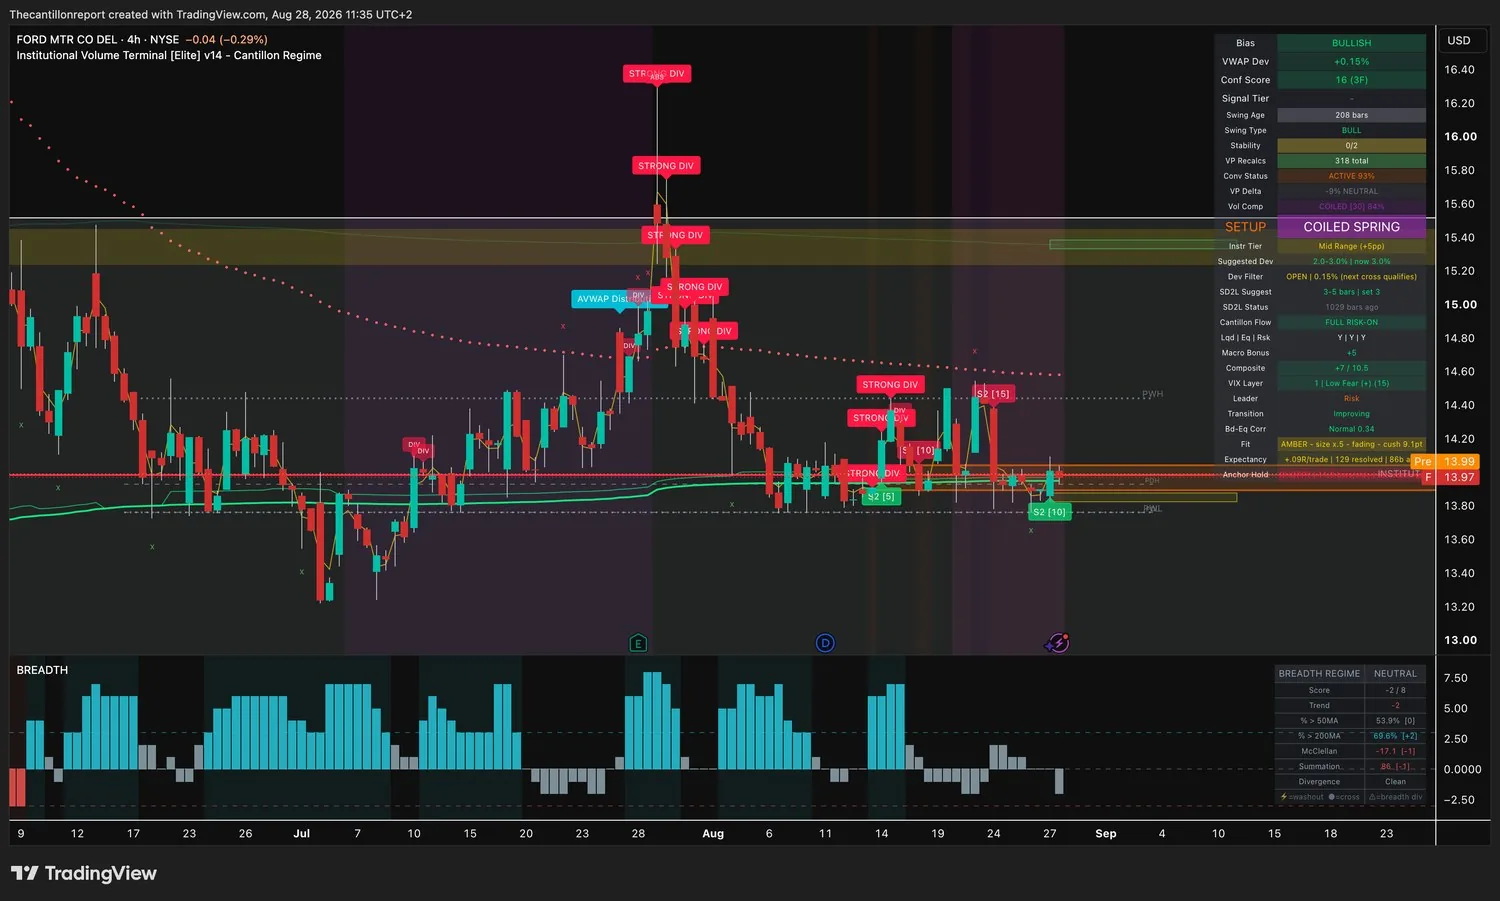
- BuyFord (F), half size. Sixteen across three timeframes is the highest confirmation in the scan by five points, it is the only coiled spring the terminal has flagged, and its institutional cost lines are clustered at 93%. Half rather than full because the trend light is amber and the structure underneath crosses its own line every twelve bars.
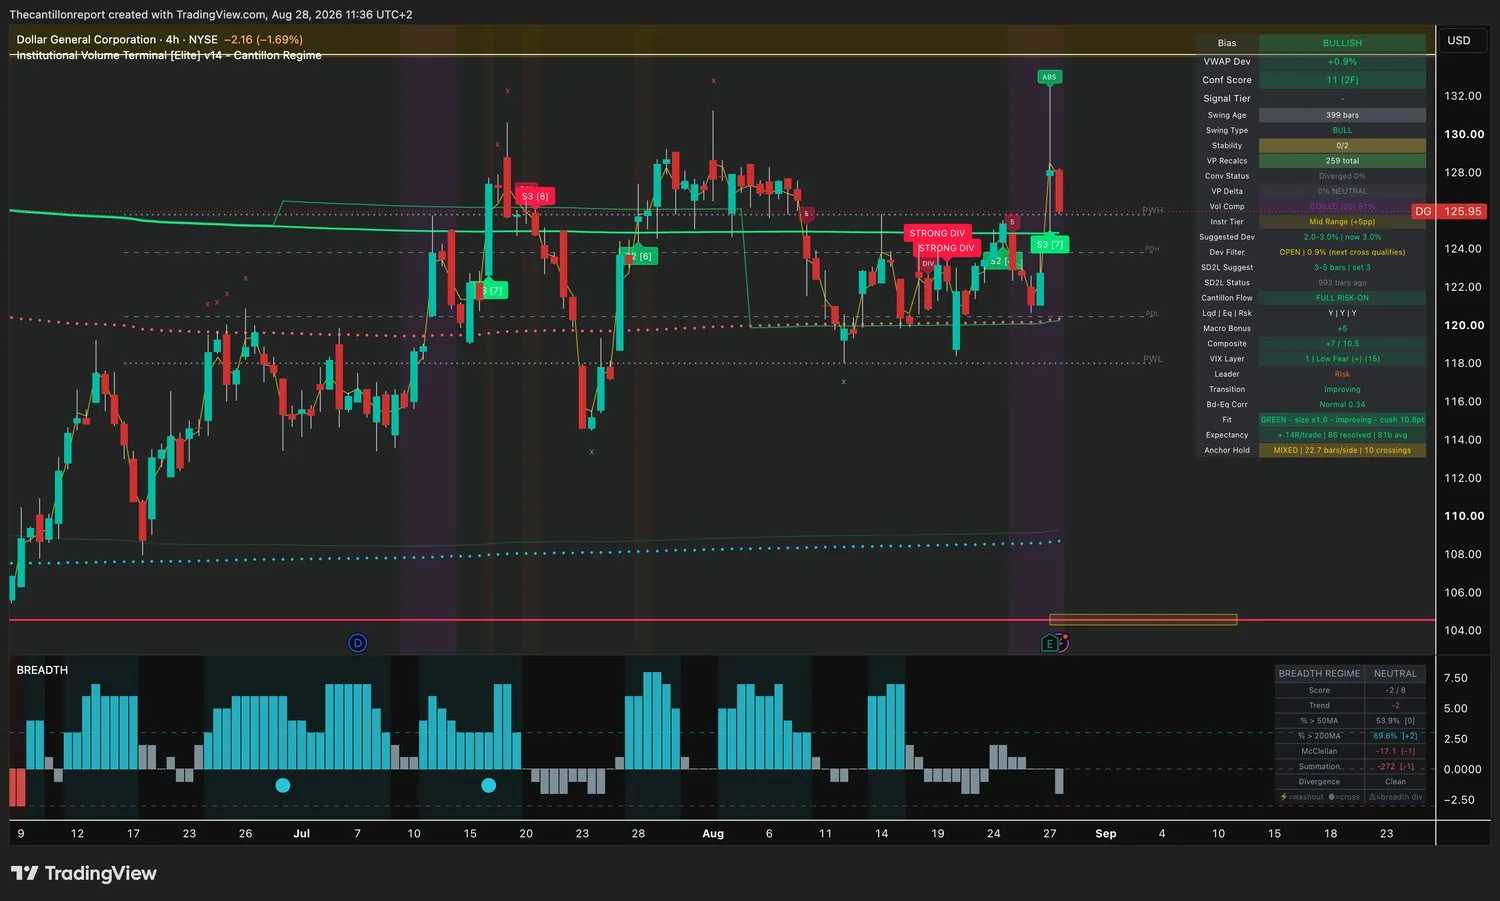
- BuyDollar General (DG), full size. The only green light on the page that is improving rather than fading, wound to 81%, and it comes into today off a raised full-year outlook. Best full size here.
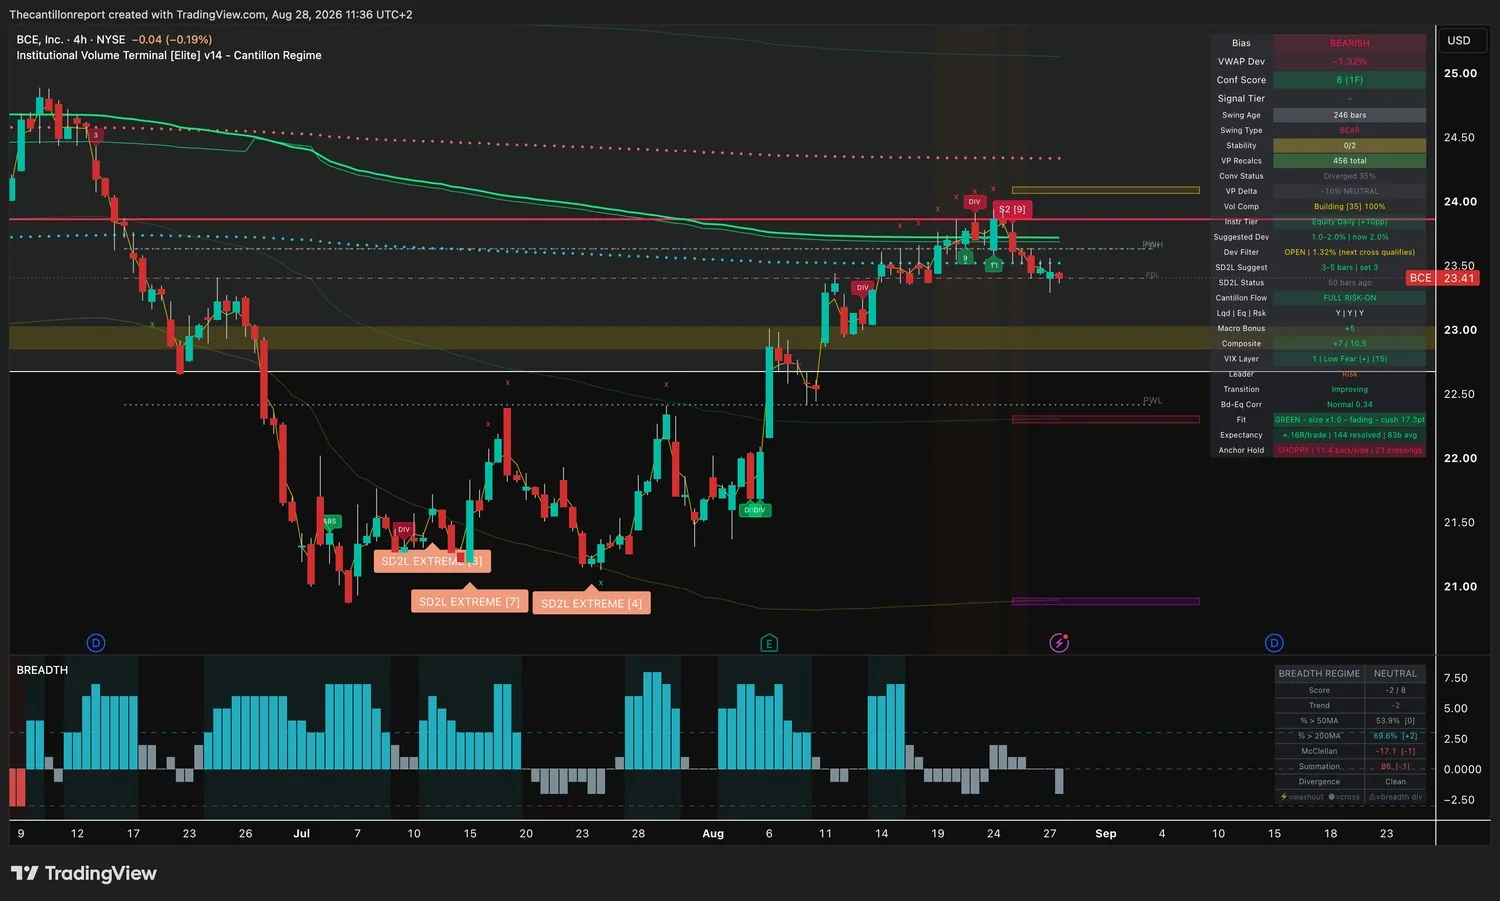
- SellBCE (BCE) and Toyota (TM), full each. The two deepest green-light records in the brief, 144 and 118 signals. Both read short in a tape the framework has just called full risk-on, and on Toyota the sellers actually run the most-traded price by 17%.
- AvoidAll four indices. Every one is on a red light and three have their windows shut. The S&P is 3.28% above what large money paid, the Dow 3.55%. The Russell is the near miss: 5.7 points from reopening, with the best index confirmation on the page.
- NoteGMED's record field is broken. Its expectancy prints +8.31R per trade over 99 signals, roughly forty times anything else in the brief. That is a terminal fault, not an edge. The row stays for its confirmation and compression. Do not size off the number.
Kevin Warsh gives his first Jackson Hole keynote as Fed chair this morning at 10:00 Eastern. The setup going in is unusual: with the target range at 3.50 to 3.75%, markets put the odds of a September cut at roughly 1% and the odds of a September hike somewhere between 28 and 39%. Two Fed officials repeated their inflation concerns on Thursday after a hot PCE print. Morgan Stanley expects Warsh to spend the speech on the balance sheet, the inflation framework, communications and AI productivity rather than on September, and Warsh has spent years arguing the Fed should give less forward guidance. So the risk is not that he says something hawkish. It is that he says nothing at all, and a tape carrying hike odds in the high twenties to high thirties fills the silence itself.
- One stock did the whole session The Nasdaq Composite closed Thursday at 26,540.78, up 1.57%, on Nvidia guiding to roughly 70% revenue growth against a 52% estimate and consensus nearer 40%. The Dow managed 0.19%, to 53,564.21. When the spread between two US indices is eight to one on the day, that is a single position moving, not a market.
- Bitcoin took 80,000 back First time since May, on an eighth consecutive day of net inflows into the US spot funds. The run has pulled in 2.8 billion dollars and August is now above 3 billion, the strongest month of 2026. Ether funds have matched it day for day.
All three legs are on and the macro tailwind is +5 rather than yesterday's zero, so longs on this page earn size for being on the right side of the cycle for the first time this week. The caveat that decides everything below: the tailwind is a regime score, not an entry. Twenty-five of thirty-one instruments still sit inside their window waiting on a cross, five are shut, and exactly one has already qualified.
The breadth strip runs when it disagrees with the regime, and this morning it does. Our own scan universe is healthy and the market it sits inside is not. Read the two columns against each other before you size anything off the +7.
| Reading | Cantillon universe | Broad US market |
|---|---|---|
| Advancing versus declining | +28 net, 51 advancing | Score −2 of 8, trend −2 |
| Above the 50-day line | 68.9% | 53.9% |
| Above the 200-day line | 73.0% | 69.6% |
| McClellan oscillator | +28.4 | −37.6 |
| Summation index | +11,574 | 585, falling |
| Divergence | None | Clean |
The gap sits almost entirely in the fifty-day column, 68.9% against 53.9%, and in the oscillator flipping sign between the two. Both are short-horizon measures. The two-hundred-day readings, which are the structural ones, agree at 73.0% and 69.6%. That is a stock-picking edge, not a market call, and it is the honest reason the single names below carry sizes while every index does not.
Eleven names out of thirty-one carry a size. Six are full and five are half. Every trigger is a four-hour close in the trade's direction, never a touch, and that matters this morning because four of these eleven sit inside one percent of their own cost line, where a wick tells you nothing. The get-out is always a close back through that line. The other twenty instruments are in the Watch and Avoid table further down, and four of them are the indices.
| # | Name | Side | Entry · trigger · get out | Why it is on this list | Size |
|---|---|---|---|---|---|
| 1 | F Ford Motor | Long | +0.15% · $13.97 window $13.95–$14.37 trigger $14.05 · out $13.95 |
Sixteen readings across three timeframes is the highest confirmation in thirty-one charts and it beats the next best by three. It is also the only instrument the terminal has labelled a coiled spring, with the separate institutional cost lines clustered at 93%, and it is sitting two cents above them. Confirmation 16 across 3 timeframes · compression coiled at 84% · convergence active at 93% · record +.09R on 129 signals · light amber, fading, 9.1-point cushion · crosses its own line every 12 bars | Half |
| 2 | DG Dollar General | Long | +0.90% · $125.95 window $124.83–$128.57 trigger $126.50 · out $124.83 |
The only green light in the brief that is improving rather than fading, on the second-tightest coil among the sized names, less than a percent off cost. It also has a reason to be there: second-quarter sales of $11.29bn beat, earnings came in at $2.48 against $2.01 expected, same-store sales rose 3.5%, and the full-year outlook went up. Record +.14R on 86 signals · light GREEN, improving, 10.8-point cushion · confirmation 11 across 2 timeframes · compression coiled at 81% · buyers and sellers dead level at the most-traded price | Full |
| 3 | BCE BCE Inc | Short | −1.32% · $23.41 window $23.25–$23.72 trigger $23.30 · out $23.72 |
Deepest green-light record on the page and the range is wound to the very top of its scale, 100 out of 100. Its last snapback reset was 50 bars ago, the freshest in the scan by a factor of five. Record +.16R on 144 signals · light GREEN, fading, 17.3-point cushion · compression building at 100% · confirmation 8 across 1 timeframe · crosses its own line every 11 bars | Full |
| 4 | TM Toyota Motor | Short | −1.65% · $192.09 window $191.40–$195.31 trigger $191.50 · out $195.31 |
One of only four instruments where the volume actually takes a side, and it takes the short side by 17%. Everywhere else on this page buyers and sellers are matched, which is why direction and volume agreeing is worth a full size here. Record +.15R on 118 signals · light GREEN, holding, 10.1-point cushion · sellers run the most-traded price by 17% · compression building at 66% · confirmation 9 across 2 timeframes · 3 crossings on 62-bar swings | Full |
| 5 | CECO CECO Environmental | Long | +1.93% · $72.23 window $70.86–$72.99 trigger $72.75 · out $70.86 |
Best publishable record in the brief. The warning attached to it is real: sellers run the most-traded price by 22% while the framework reads this long, the widest disagreement between direction and volume anywhere in the scan. Record +.17R on 120 signals, the highest here · light GREEN, fading, 10.7-point cushion · confirmation 8 across 3 timeframes · sellers dominant by 22% against a long · 12 crossings on 19-bar swings | Full |
| 6 | RIVN Rivian | Long | +1.48% · $16.79 window $16.55–$17.05 trigger $16.90 · out $16.55 |
Widest cushion in the brief by a distance, so the green light is nowhere near turning. It reads long again after reading short yesterday. The sample is 22 signals, two over the floor at which this brief will print a rate at all. Record +.22R on 22 signals, the thinnest that publishes · light GREEN, holding, 36.7-point cushion · confirmation 8 across 2 timeframes · direction flipped from short · 28 crossings on 9-bar swings, the noisiest structure here | Full |
| 7 | GMED Globus Medical | Long | +0.71% · $82.56 window $81.98–$84.44 trigger $83.00 · out $81.98 |
Green light, coiled, under a percent from cost, and eleven readings across two timeframes. Its record field is broken: the terminal prints +8.31R per signal, about forty times anything else in this brief, which is a fault and not an edge. Size this one off the confirmation and the coil, and off nothing else. Confirmation 11 across 2 timeframes · compression coiled at 84% · light GREEN, fading · record field faulty, 99 signals, not usable · 18 crossings on 13-bar swings | Full |
| 8 | IBM IBM | Short | −2.65% · $238.74 window $237.88–$245.24 trigger $238.00 · out $245.24 |
Deepest sample in the brief at 151 finished signals, on the joint-highest confirmation among the shorts. Sellers run the most-traded price by 16%. The record is thin but it is positive on more history than anything else here. Record +.04R on 151 signals, the deepest here · confirmation 13 across 2 timeframes · compression coiled at 84% · light amber, improving · sellers dominant by 16% · 4 crossings on 50-bar swings | Half |
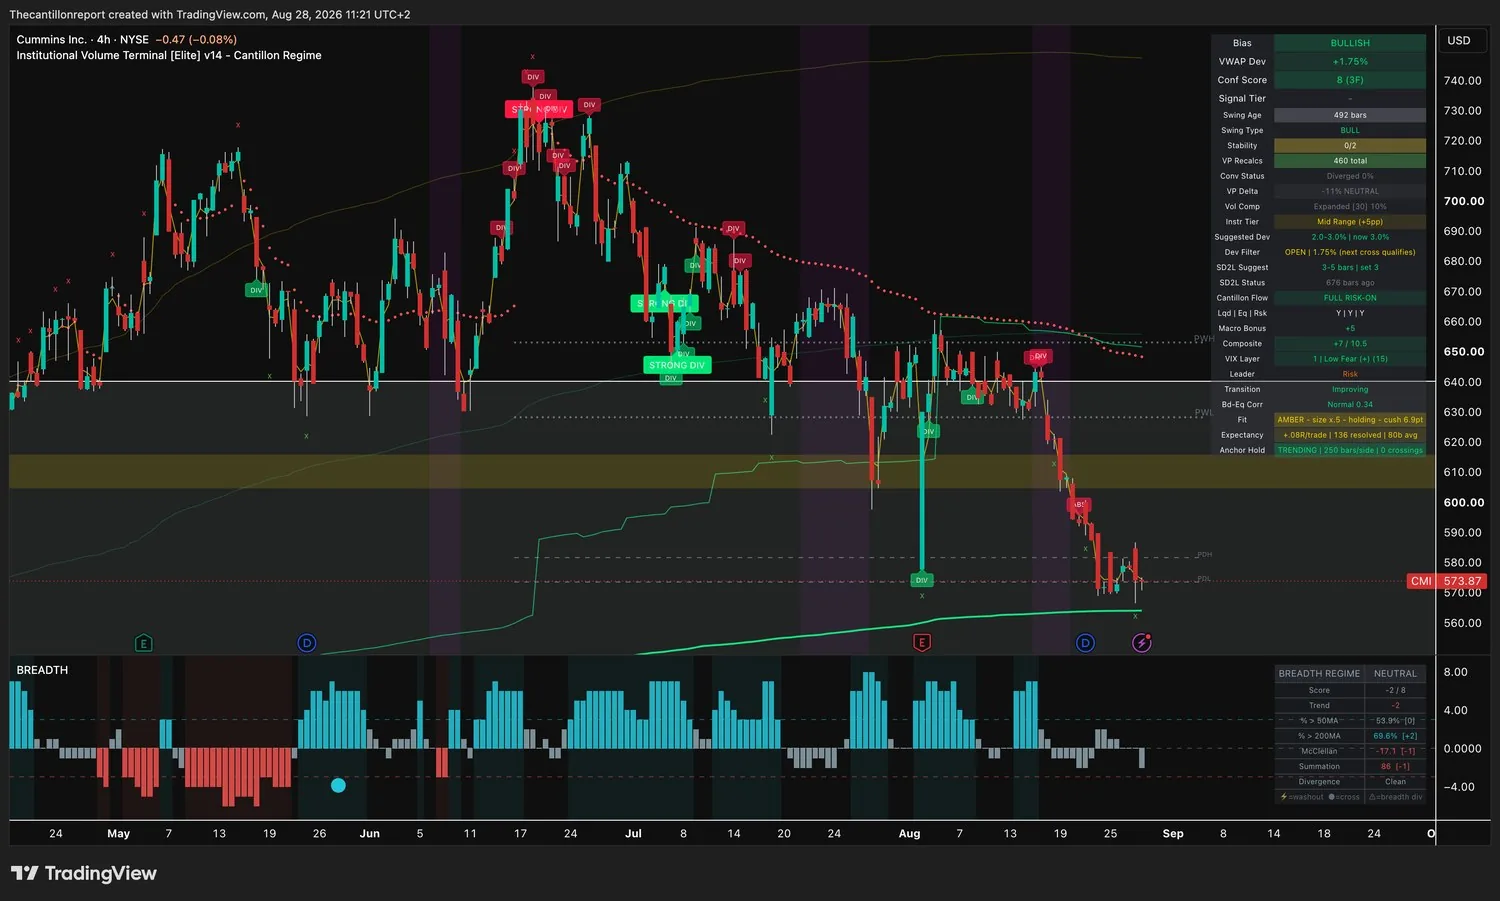
| 9 | CMI Cummins | Long | +1.75% · $573.87 window $563.90–$580.82 trigger $576.00 · out $563.90 |
Has not crossed its own cost line once in a 250-bar window. That is the cleanest structure in the scan, shared with only two other names, and it is the thing you want under a position you intend to hold through a Fed speech. Record +.08R on 136 signals · light amber, holding, 6.9-point cushion · confirmation 8 across 3 timeframes · zero crossings on 250-bar swings · compression only 10%, so no coil to release | Half |
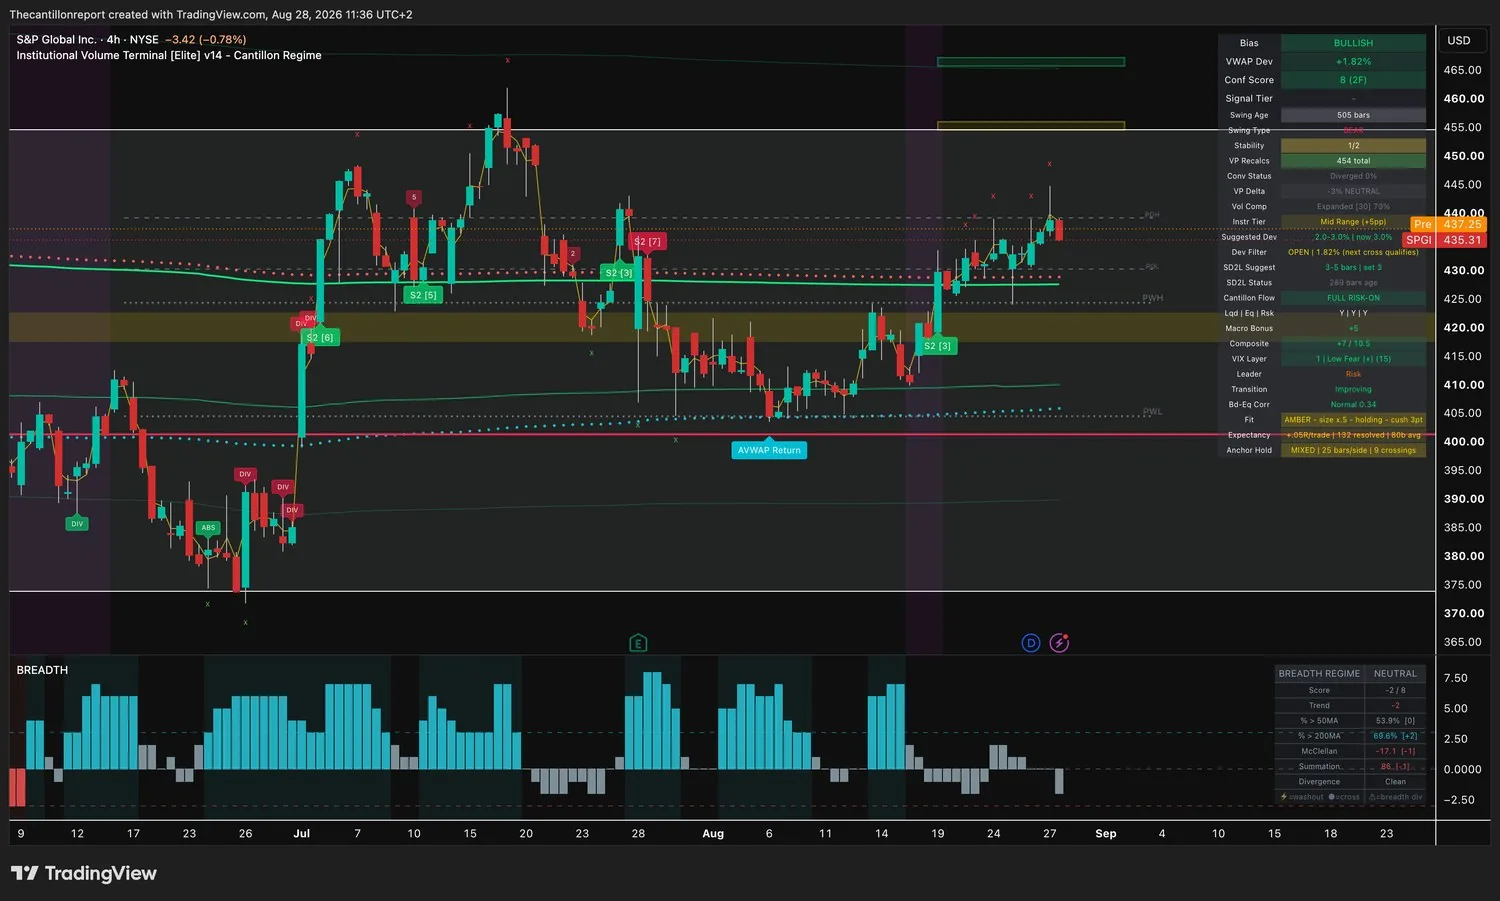
| 10 | SPGI S&P Global | Long | +1.82% · $435.31 window $427.53–$440.36 trigger $437.50 · out $427.53 |
The only instrument in thirty-one charts with a stability check on the board. Every other reading in this scan, indices included, sits at zero of two. One of two is not much. It is more than anything else has. Record +.05R on 132 signals · stability 1 of 2, the only one on the page · light amber, holding, 3-point cushion, the thinnest here · confirmation 8 across 2 timeframes · compression expanded at 70% | Half |
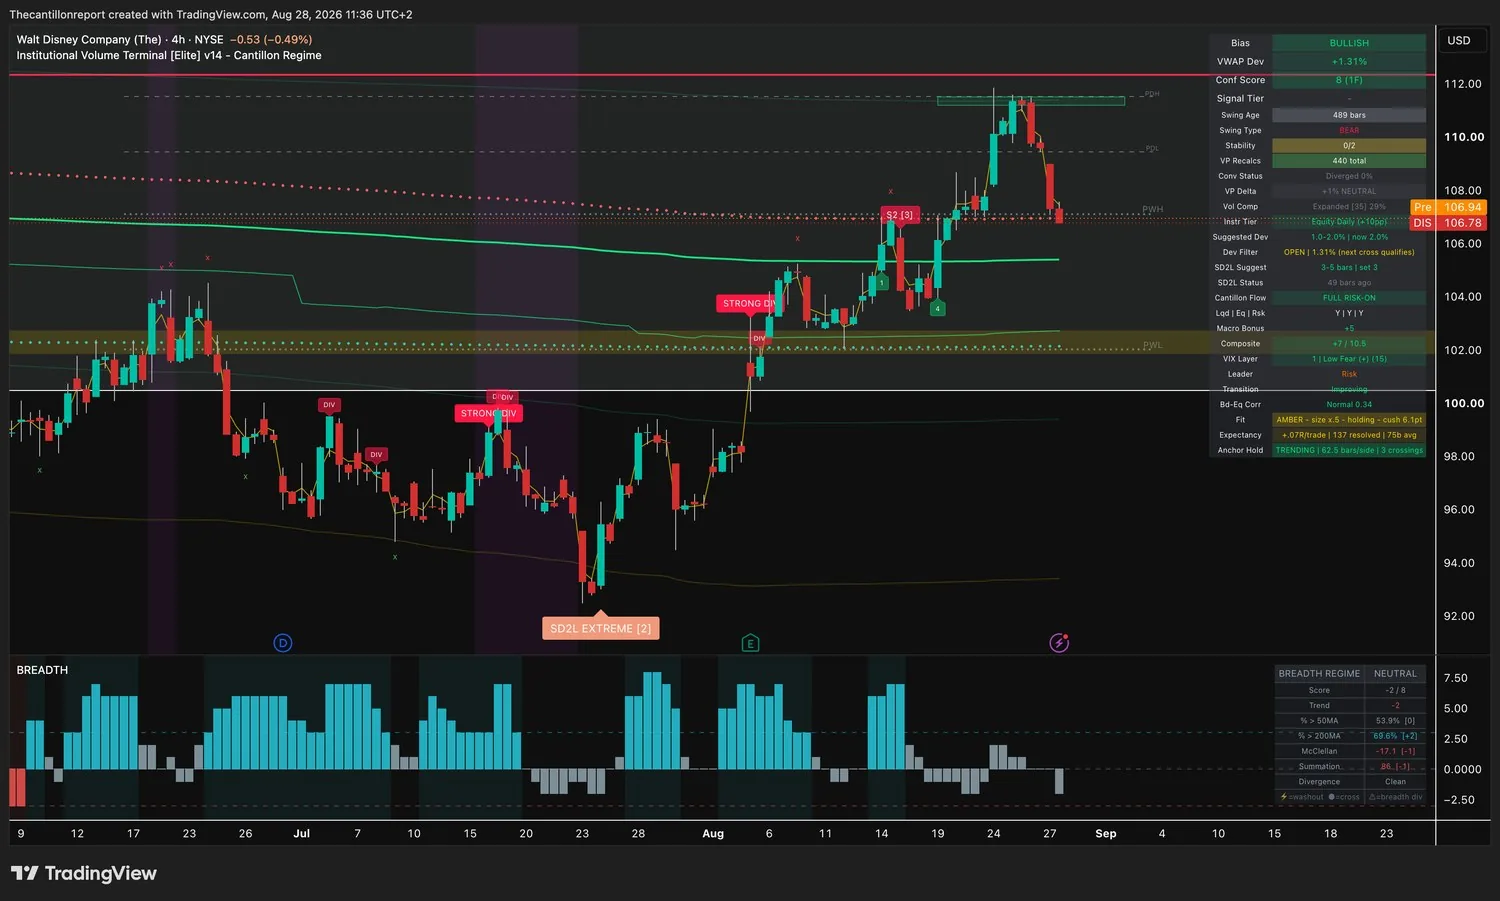
| 11 | DIS Walt Disney | Long | +1.31% · $106.78 window $105.40–$107.51 trigger $107.00 · out $105.40 |
Positive on 137 signals with a workable cushion, but the confirmation comes from a single timeframe, which is the weakest support of anything carrying a size today. It is a quarter of a position dressed as a half. Record +.07R on 137 signals · light amber, holding, 6.1-point cushion · confirmation 8 across 1 timeframe only · compression expanded at 29% · 3 crossings on 62-bar swings | Half |
This is what large money paid for Ford across the current swing, and Ford closed two cents above it. Everything the terminal is shouting about this name, the sixteen, the coil, the 93% cluster, is anchored to that price and stops meaning anything below it. Hold above 13.95 on four-hour closes and the highest-confirmation setup in thirty-one charts is intact and the window stays open up to 14.37. Close under it and the setup is not weaker, it is finished, and the next thing to wait for is a fresh coil rather than a cheaper price. One caution on the way in: the light here is amber, not green, which is why this is a half and not a full.
This one is free. The other four this week were not.
Every level, every execution block and all thirty-one terminal captures, with nothing held back and no gate anywhere on the page. Monday through Thursday the entry levels sit behind the member wall. Every Friday the whole thing ships open.
It is two cents above the line, so a wick through it carries no information and a close through it ends the trade. Take it on the trigger close or inside the band, never on the touch.
The only improving green light in the brief, and the one name here with a fresh catalyst underneath it rather than just a reading. The coil is loaded and the price is still inside its window.
Compression is at the absolute top of its scale and the reset behind it is 50 bars old, against 600 to 3,200 for most of this page. The range is fully loaded and the window is open down to 23.25.
Four indices and sixteen single names. Every one of them is on a red light or has no light at all, which is why none carries a size however good the chart looks. Five have their windows shut, and the reset zone is the price at which each reopens.
| Name | Distance from line | Window | Why not |
|---|---|---|---|
| RUSSELL | +2.19% over | Shut, reopens under 3,010.8 | The near miss of the whole brief. Thirteen readings across four timeframes is the best index confirmation on the page and the range is wound to 99%, but it is 5.7 points too extended to enter and the record is −.03R over 52 signals. Watch the reopen, not the chart. |
| NAS100 | +0.68% over | Open, cross pending | Only index inside its window, and the one that turned the cycle on by holding 29,342 overnight. Its own record across 181 finished signals is exactly zero, so the cross changes the regime reading and earns no position by itself. |
| SP500 | +3.28% over | Shut, reopens under 7,637 | Weakest confirmation of the four at five across a single timeframe, 3.28% above what large money paid, and the range has already expanded to 57%. Nothing to buy and nothing coiled. |
| US30 | +3.55% over | Shut, reopens under 52,812 | Most extended instrument in the scan, and the best-looking coil among the indices at 96%. Those two facts belong together: the coil is why it looks buyable and the distance is why you cannot. |
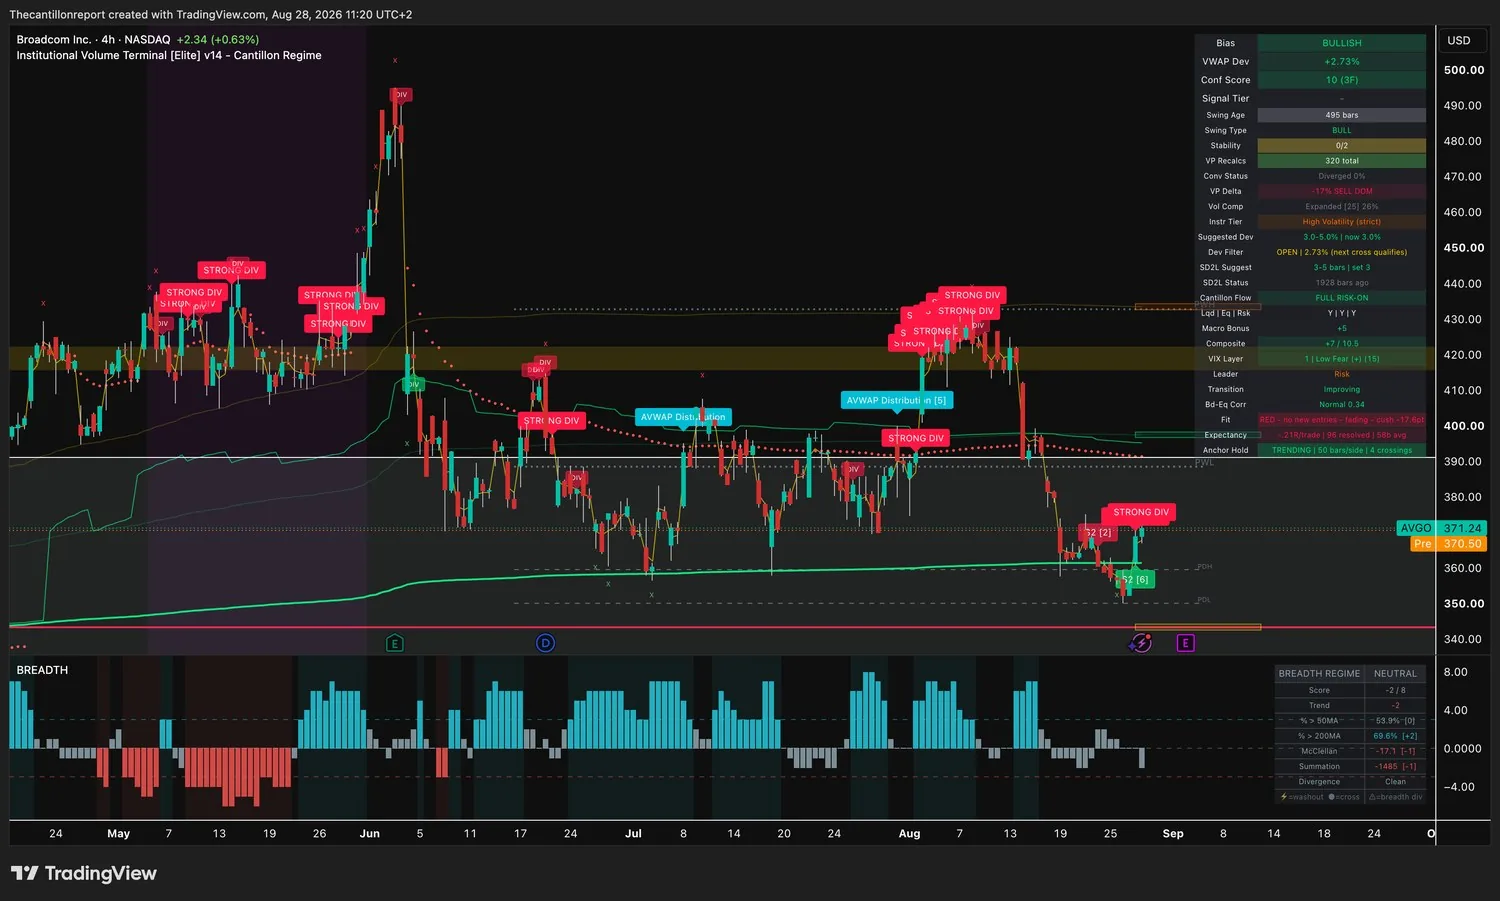
| AVGO | +2.73% over | Open, cross pending | Worst record in the brief at −.21R over 96 signals, with a cushion of −17.6 points, and sellers running the most-traded price by 17% against a long reading. Three separate reasons to leave it. |
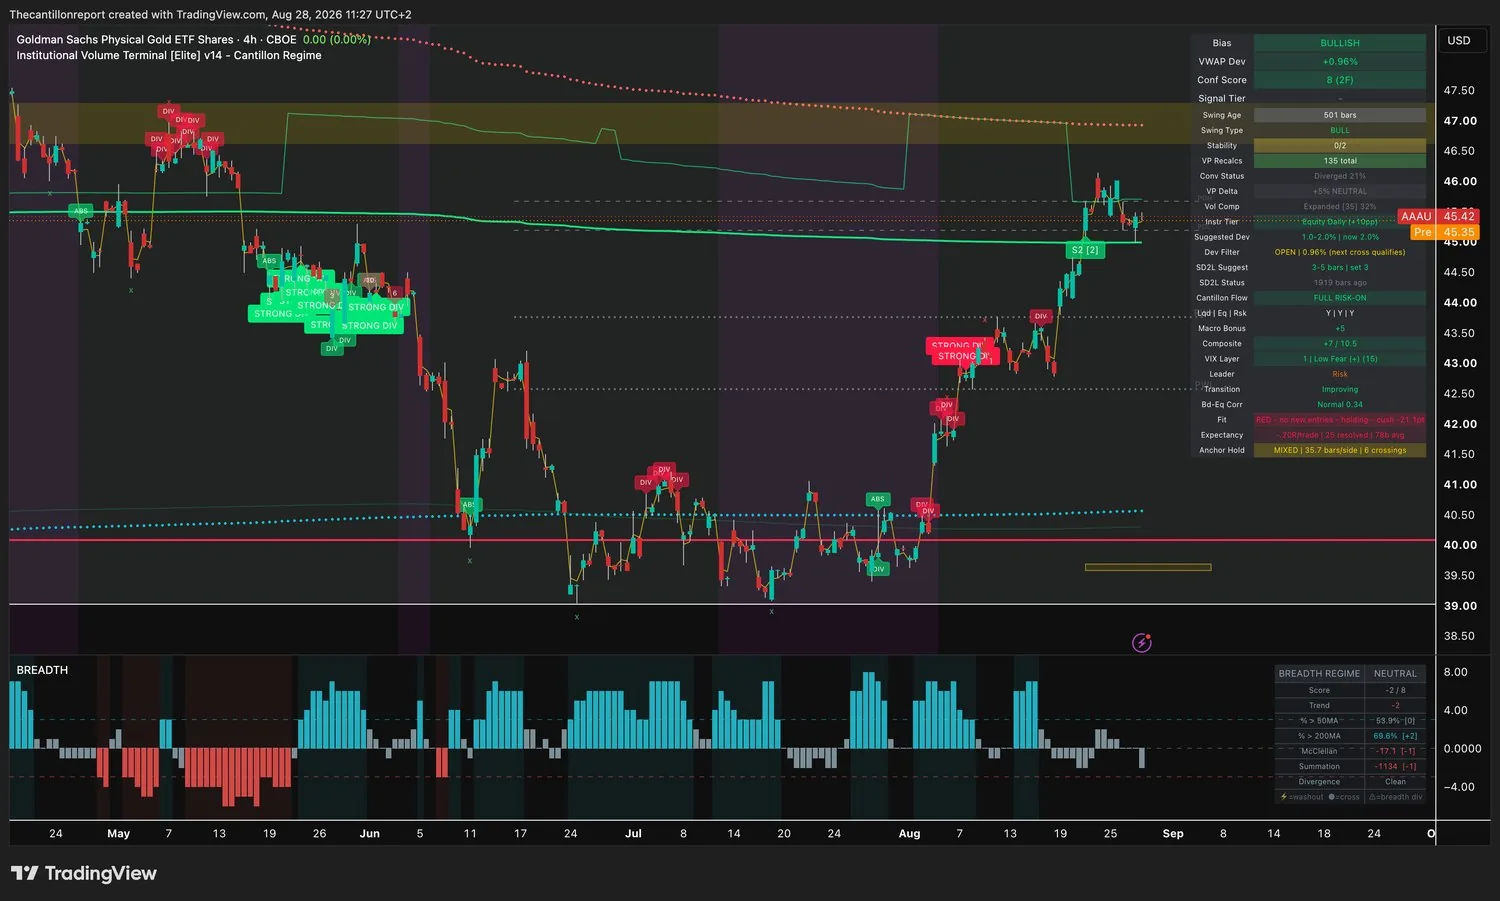
| AAAU | +0.96% over | Open, cross pending | Second-worst record at −.20R over 25 signals and a cushion of −21.1 points. Gold sitting under a percent from cost is the only good thing on this row. |
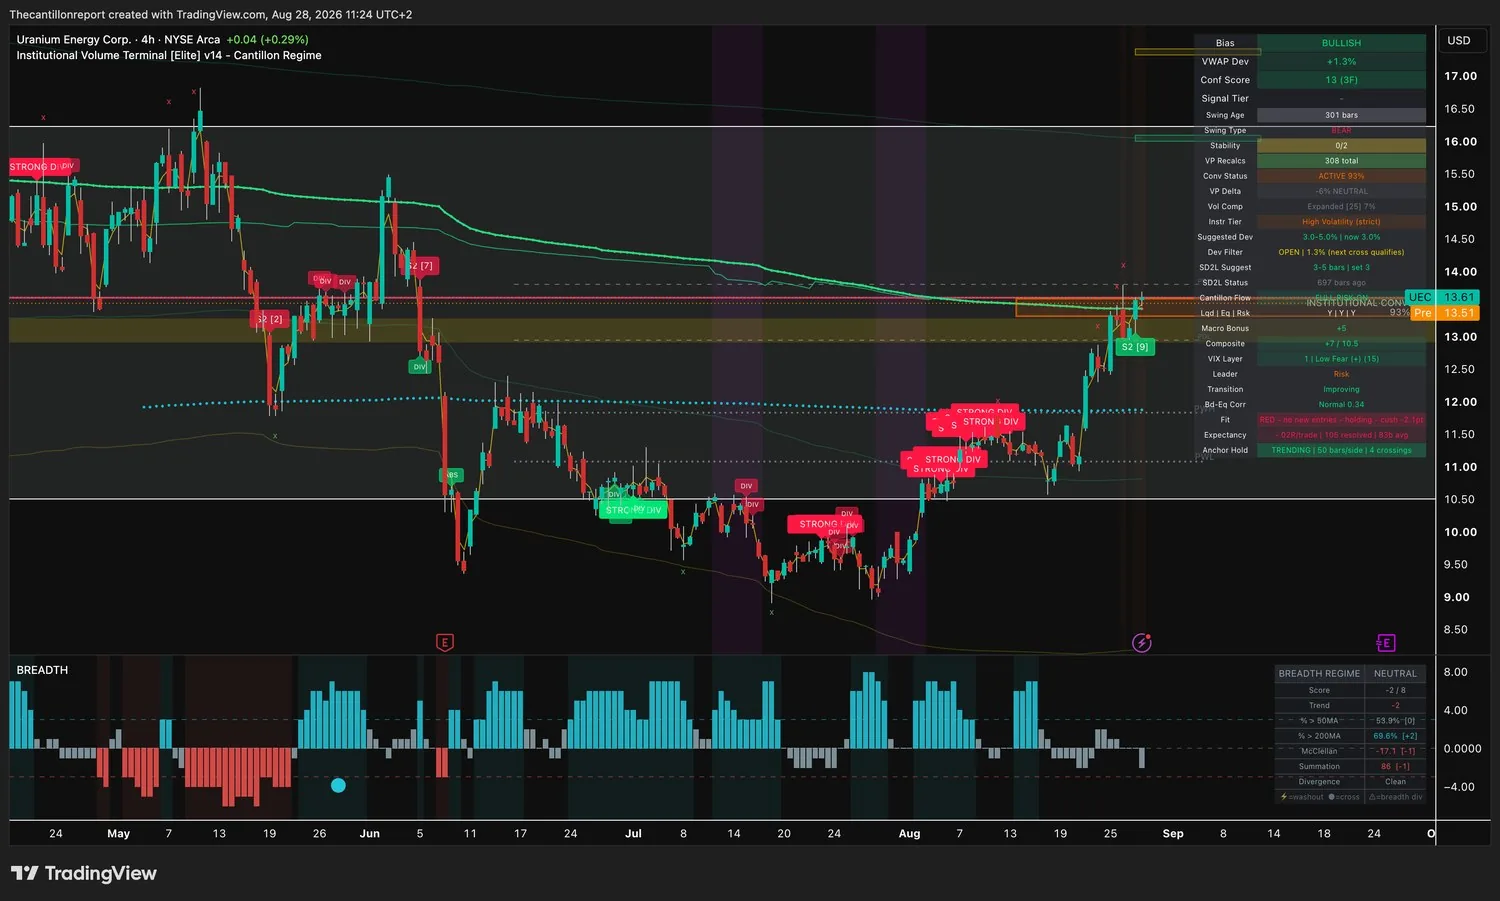
| UEC | +1.30% over | Open, cross pending | Thirteen across three timeframes with the cost lines clustered at 93%, the same convergence reading as Ford. The difference is the light: red, on −.02R over 105 signals. Strong chart, no permission. |
| LMT | −0.13% over | Open, cross pending | Closest instrument to its own cost line in the whole scan and convergence is active at 84%. Red light on −.06R over 128 signals, and it crosses that line every sixteen bars, so there is nothing to hold on to. |
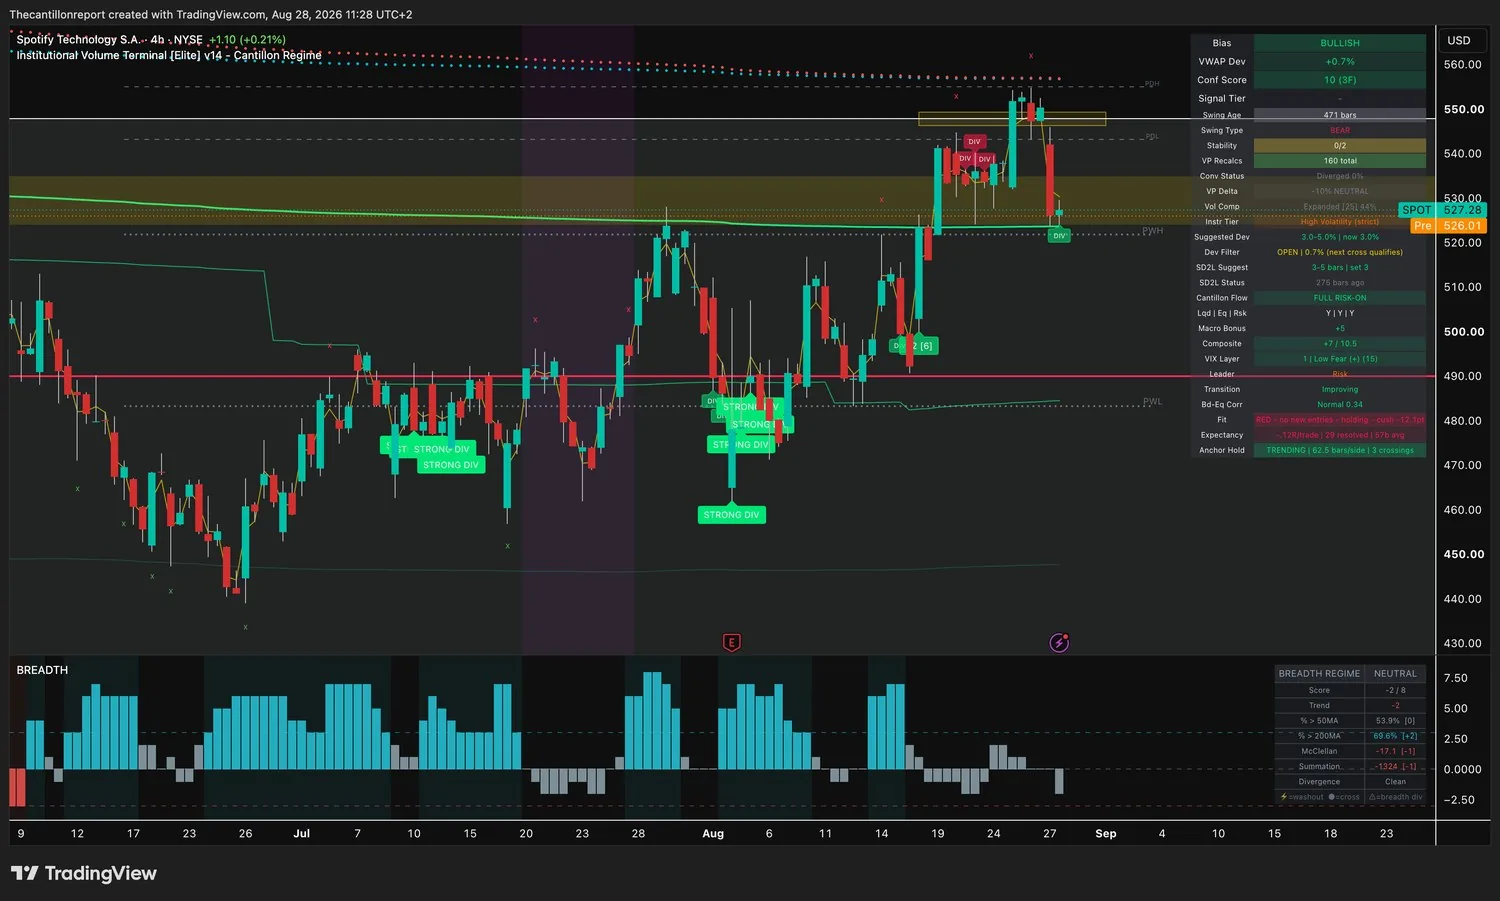
| SPOT | +0.70% over | Open, cross pending | Ten across three timeframes, close to the line, and −.12R over 29 signals with a −12.1-point cushion. Good confirmation is not an edge when the record behind it is negative. |
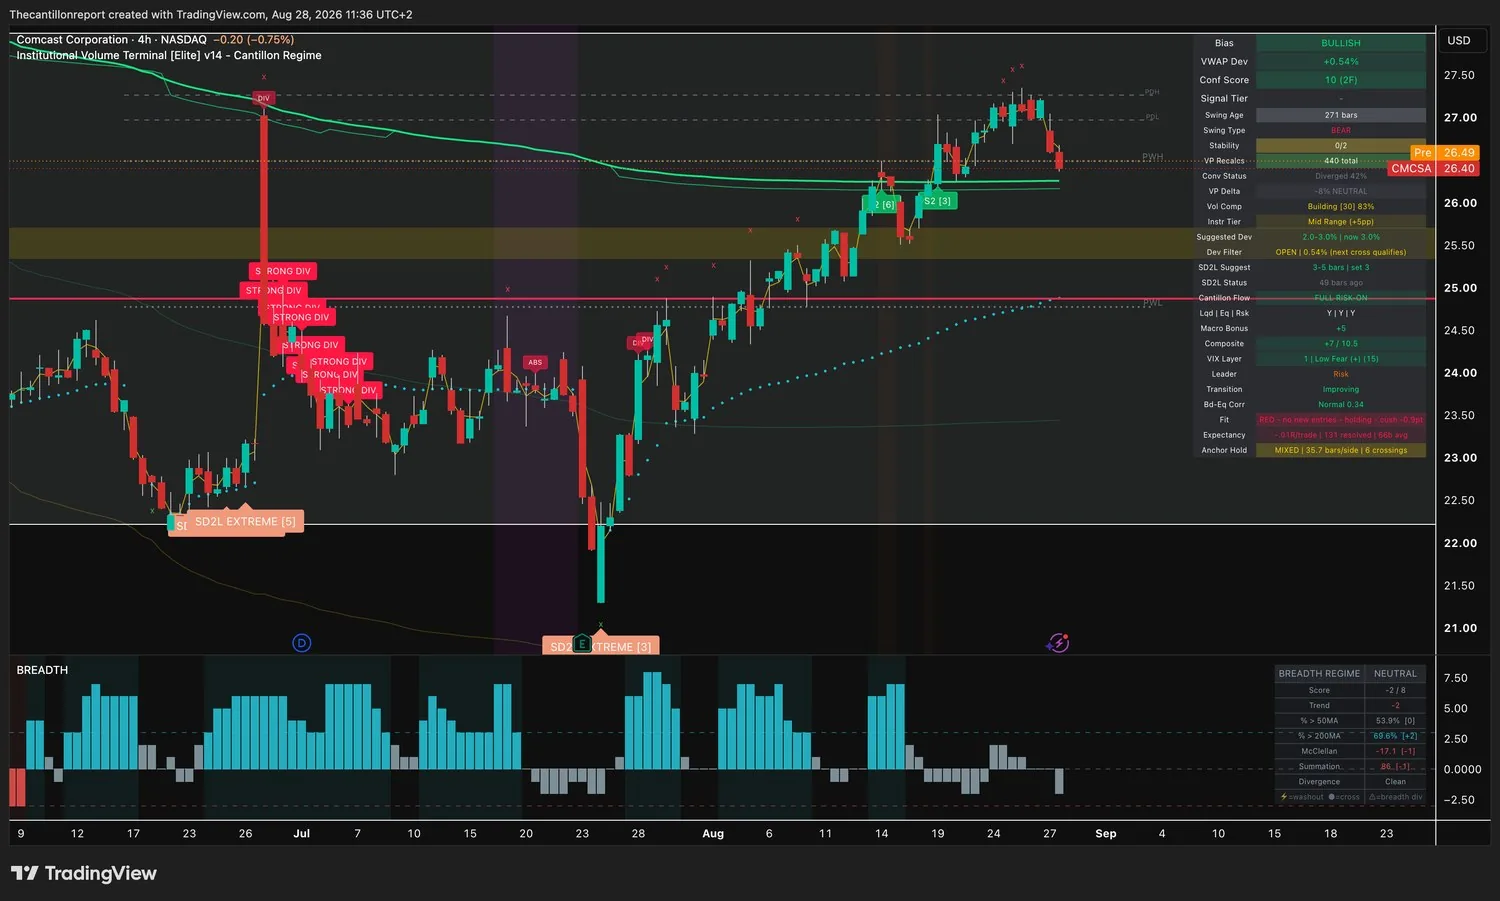
| CMCSA | +0.54% over | Open, cross pending | Ten across two timeframes and compression building at 83%, half a percent off cost. Record is −.01R over 131 signals, which is a coin flip with commission, and the cushion is already negative. |
| AMPS | +0.60% over | Open, cross pending | Coiled at 96% and inside a percent of cost, which would make it a Board name. The terminal cannot produce a record for it at all, so there is no light and no size. Reload the indicator before trusting anything here. |
| JBS | +0.77% over | Open, cross pending | Eleven across three timeframes with convergence active at 86% and compression building at 81%. Seven of the twenty signals needed. Nothing publishable and nothing to size off yet. |
| BITB | −0.62% under | Qualified, the only one | The single instrument in thirty-one charts whose entry cross has already printed inside its window, and it reads short into an eight-day ETF inflow streak. Nine of twenty signals, so there is no record and no size. Read it as a warning on crowded flow rather than a trade. |
| CRCL | +4.24% over | Shut, reopens under 93.13 | Furthest extended name in the scan at 4.24% above cost, on four of the twenty signals needed. Ten across two timeframes counts for nothing without a window or a record. |
| PACB | +3.15% over | Shut, reopens under 1.558 | Two tenths of a cent from reopening, with sellers running the most-traded price by 20% against a long. When it reopens, the volume will still disagree with the direction. |
| STM | +2.77% over | Open, cross pending | Confirmation of seven off a single timeframe, red light, and −.01R over 123 signals. Extended, unsupported and flat. There is no version of this row that becomes a trade today. |
| MELI | +1.50% over | Open, cross pending | Red light fading on −.06R over 71 signals, and compression sitting at 7%, so there is no stored energy to release either. |
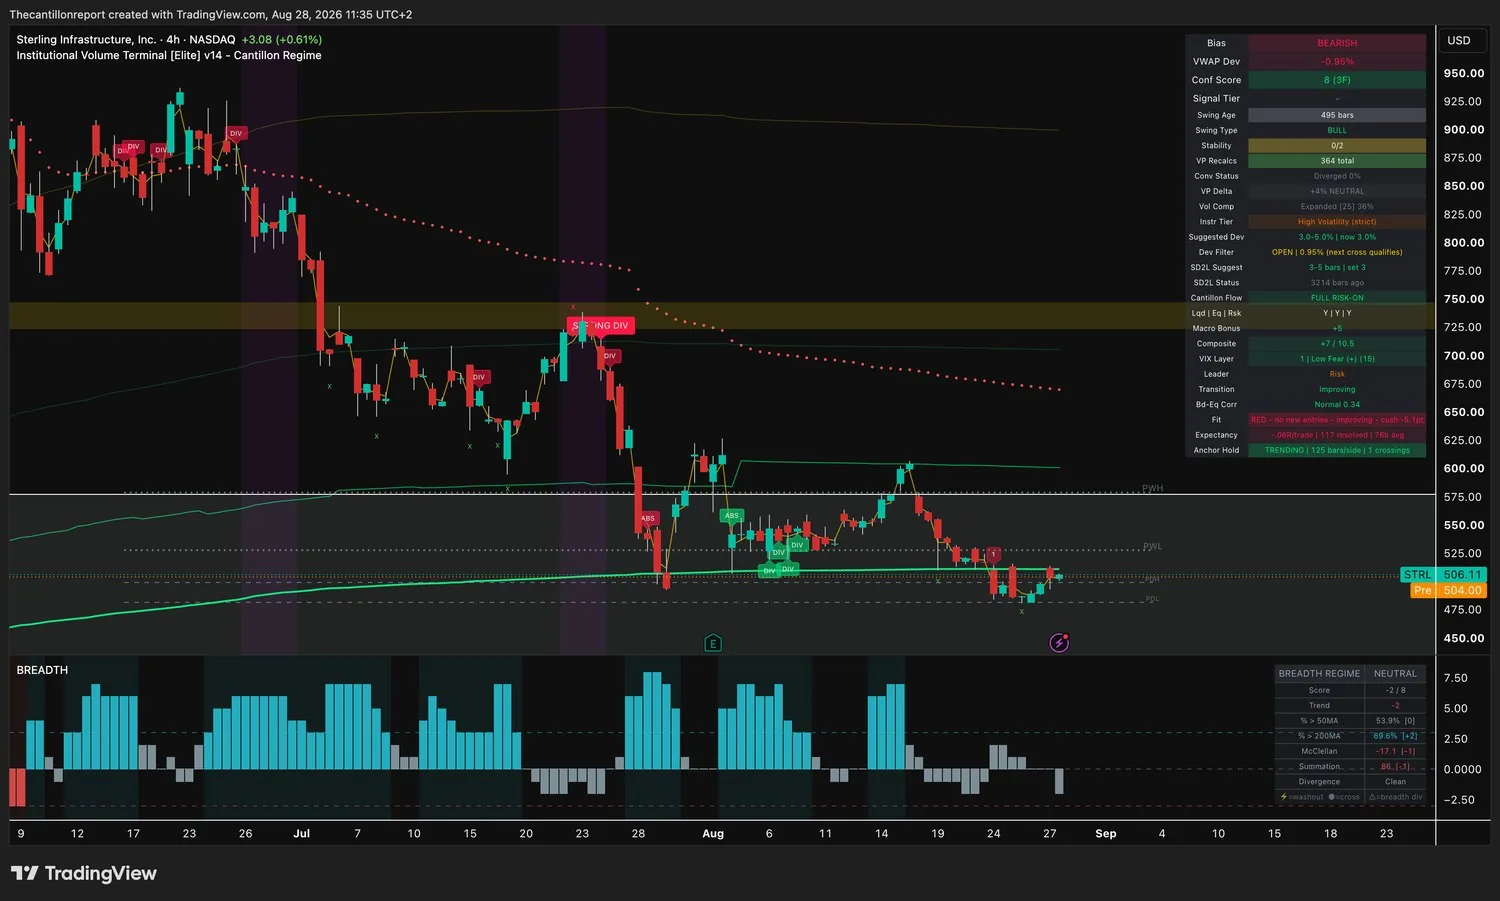
| STRL | −0.95% under | Open, cross pending | Eight across three timeframes on the short side and close to the line, but the swing structure underneath still reads bull while the bias reads bear. Red light, −.06R over 117 signals. |
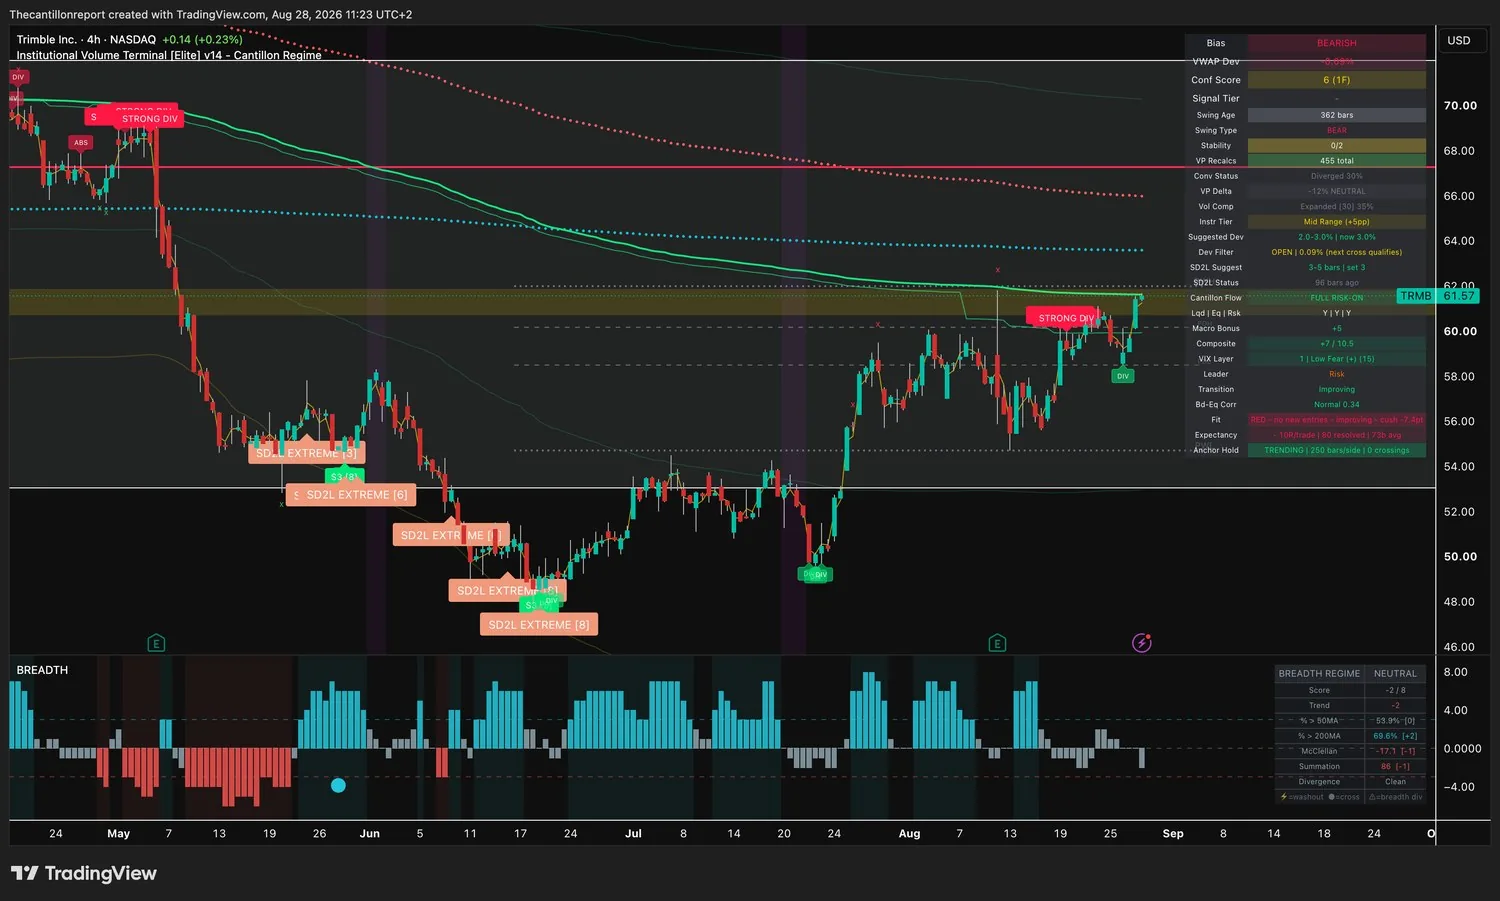
| TRMB | −0.09% under | Open, cross pending | Sitting almost exactly on its cost line with zero crossings in 250 bars, the cleanest structure among the non-sized names. Six off one timeframe and −.10R over 80 signals is not enough to act on. |
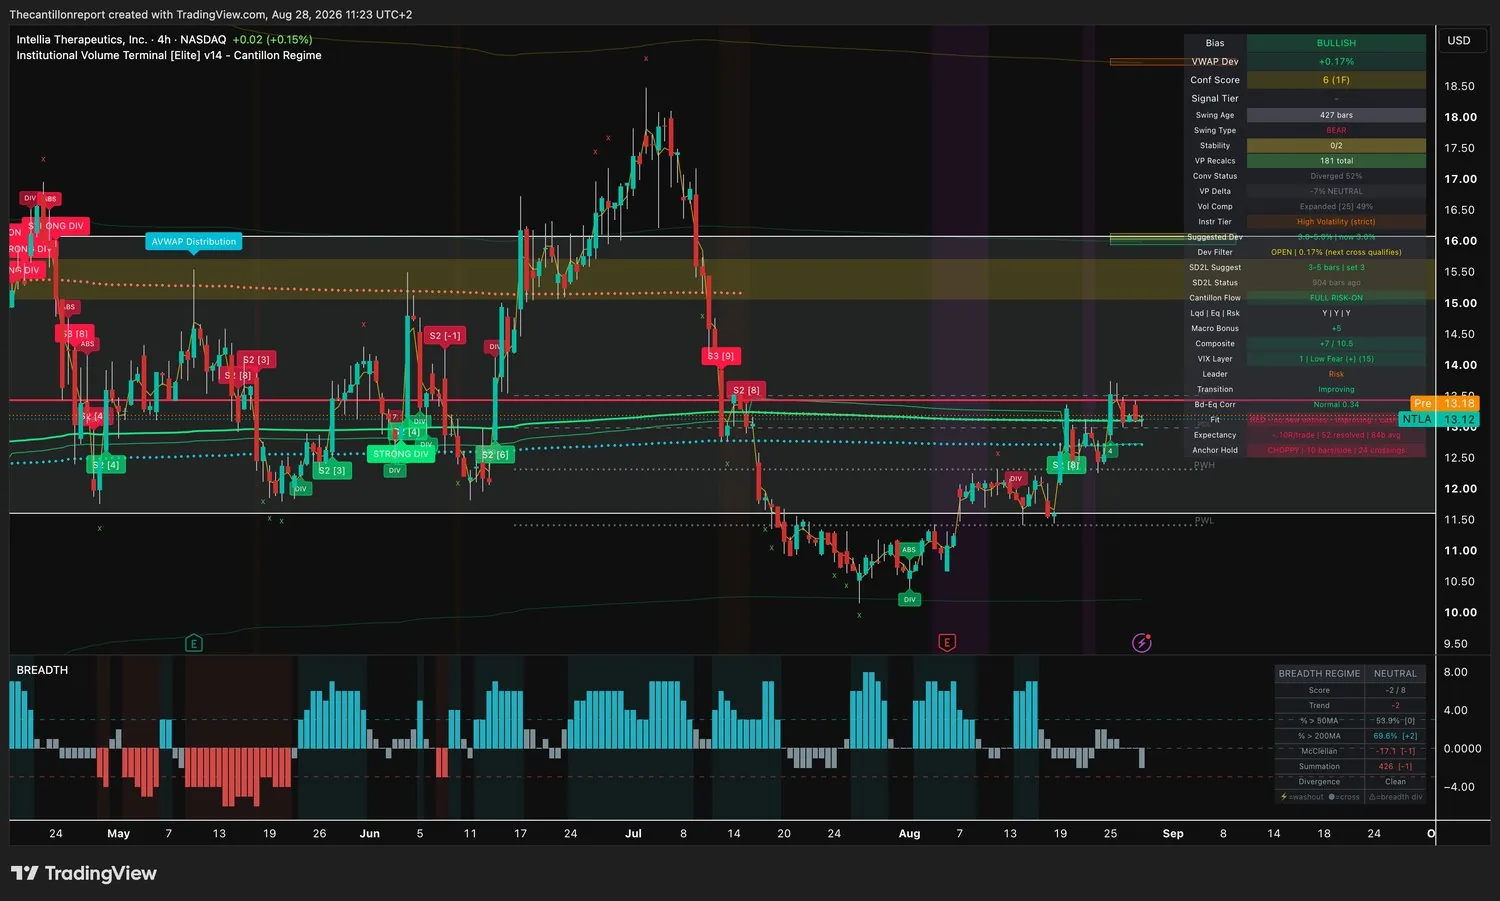
| NTLA | +0.17% over | Open, cross pending | Crosses its own cost line 24 times in 10-bar swings, the noisiest structure in the scan, on −.10R over 52 signals. Nothing here holds long enough to be worth a stop. |
The remaining twenty-eight captures, unmodified. Read the compression numbers against the light colours: the two tightest coils on this page, the Russell at 99% and the Dow at 96%, both belong to instruments whose windows are shut.
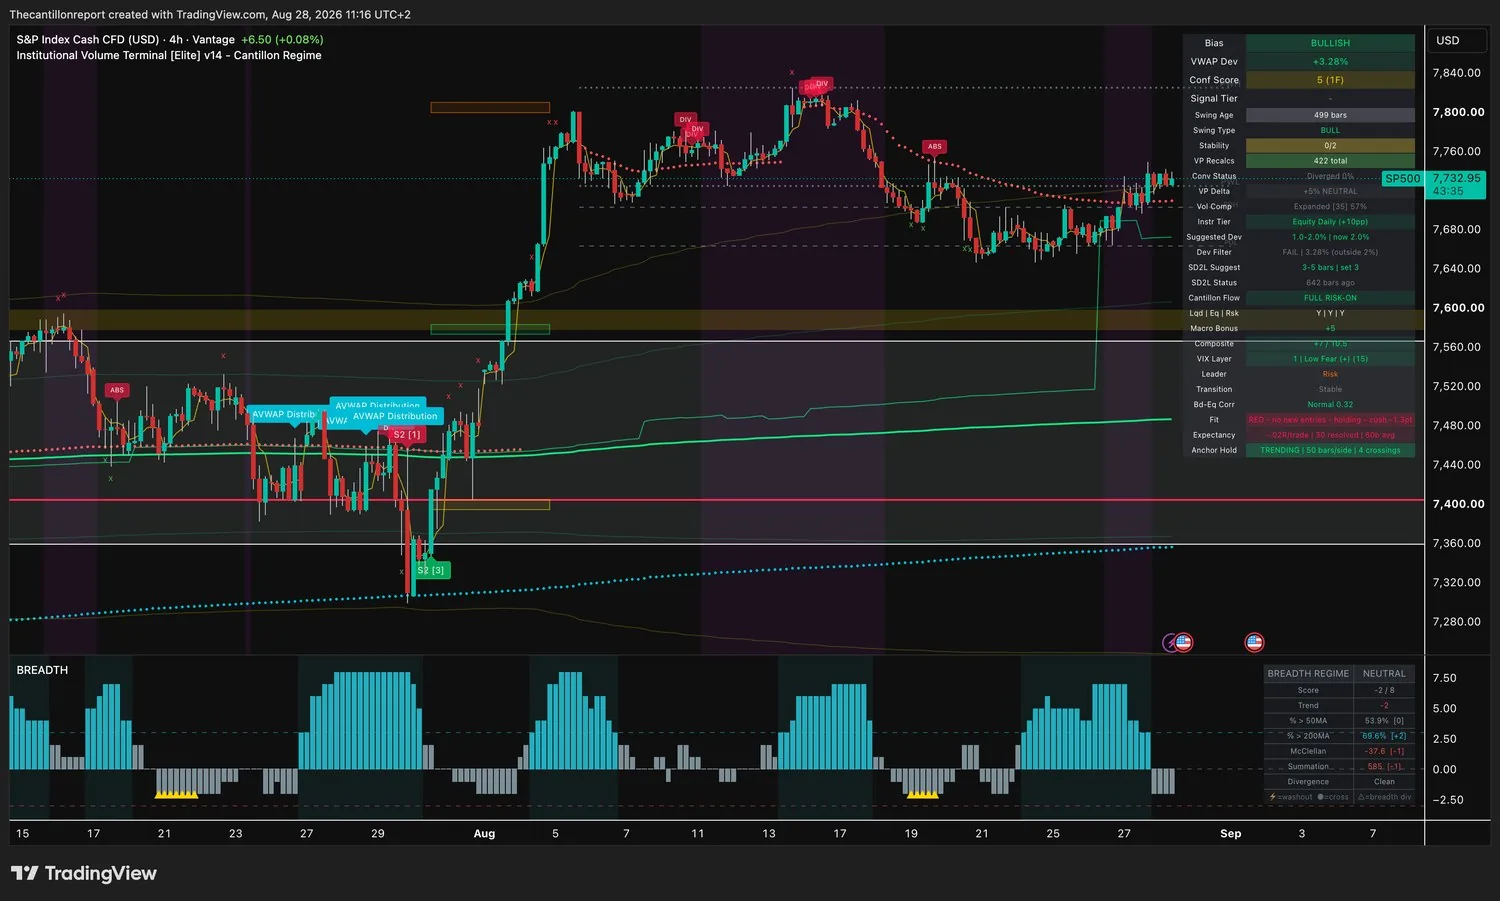
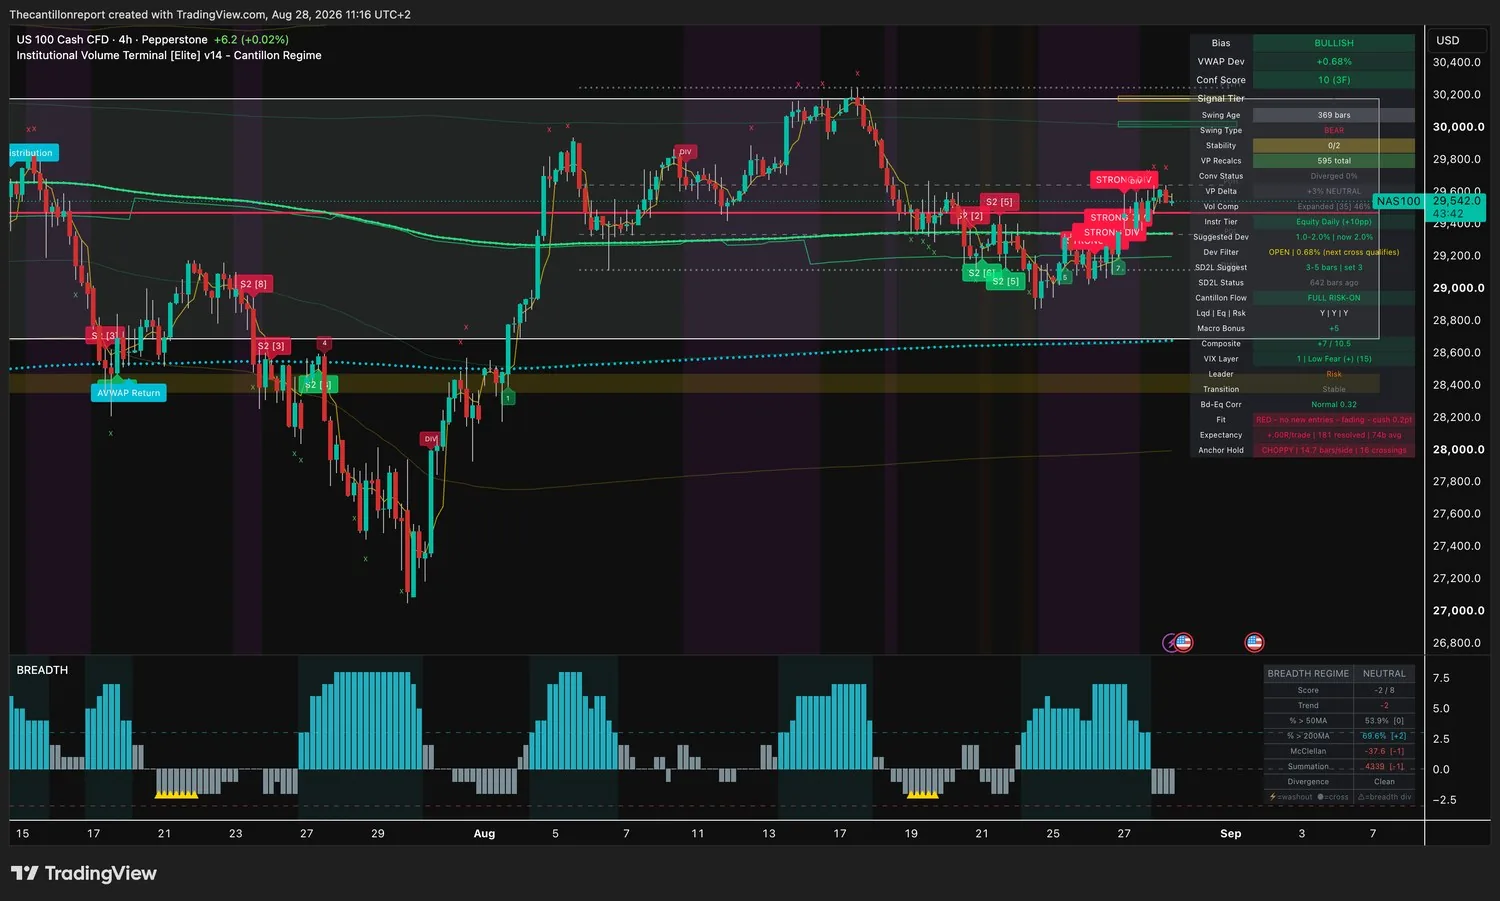
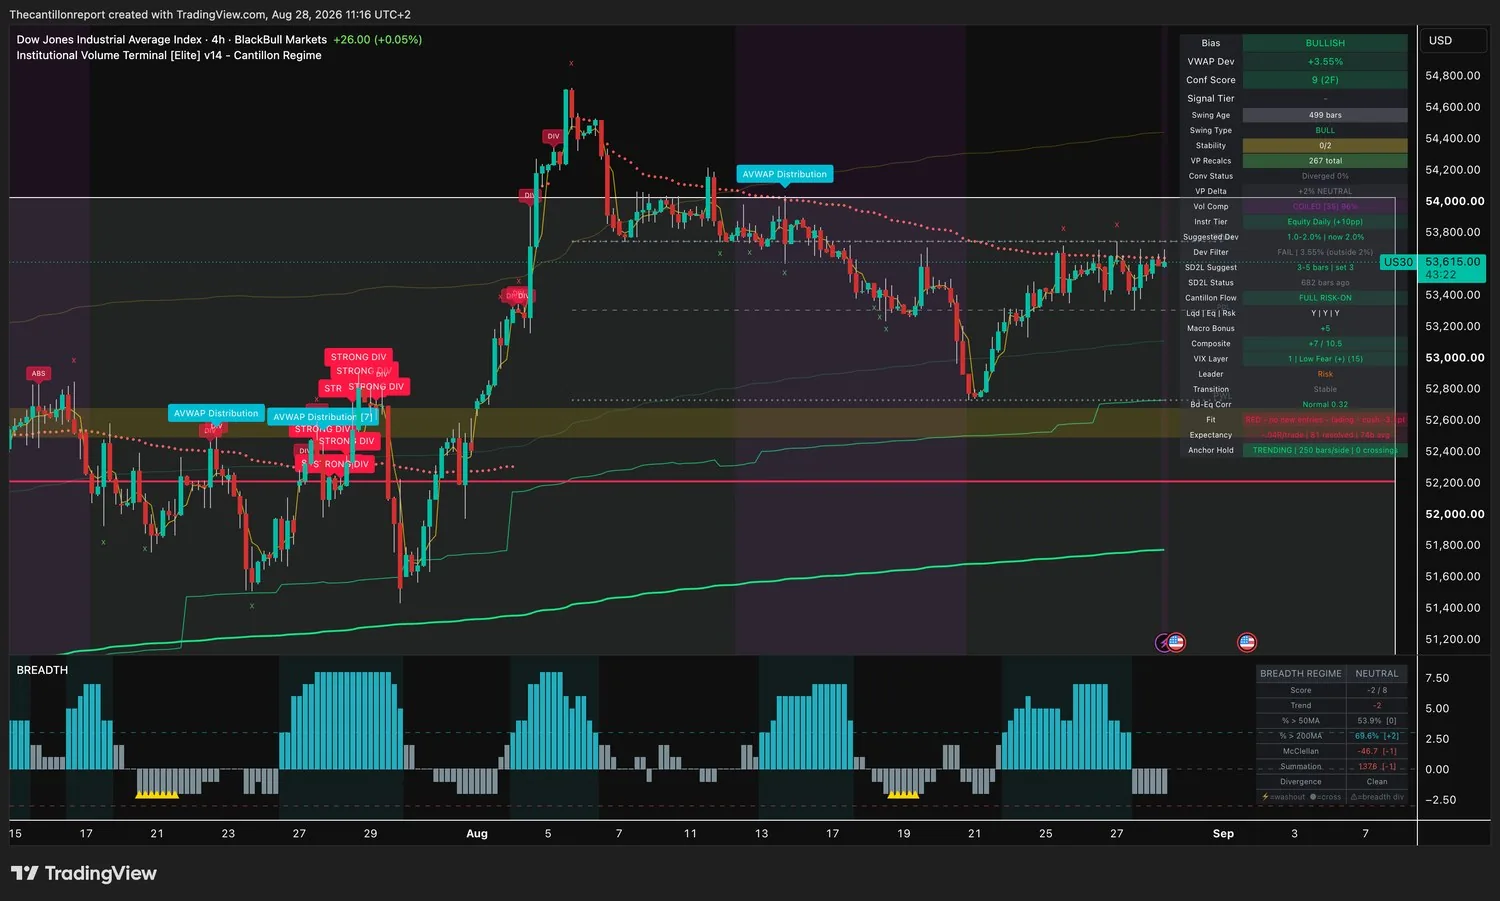
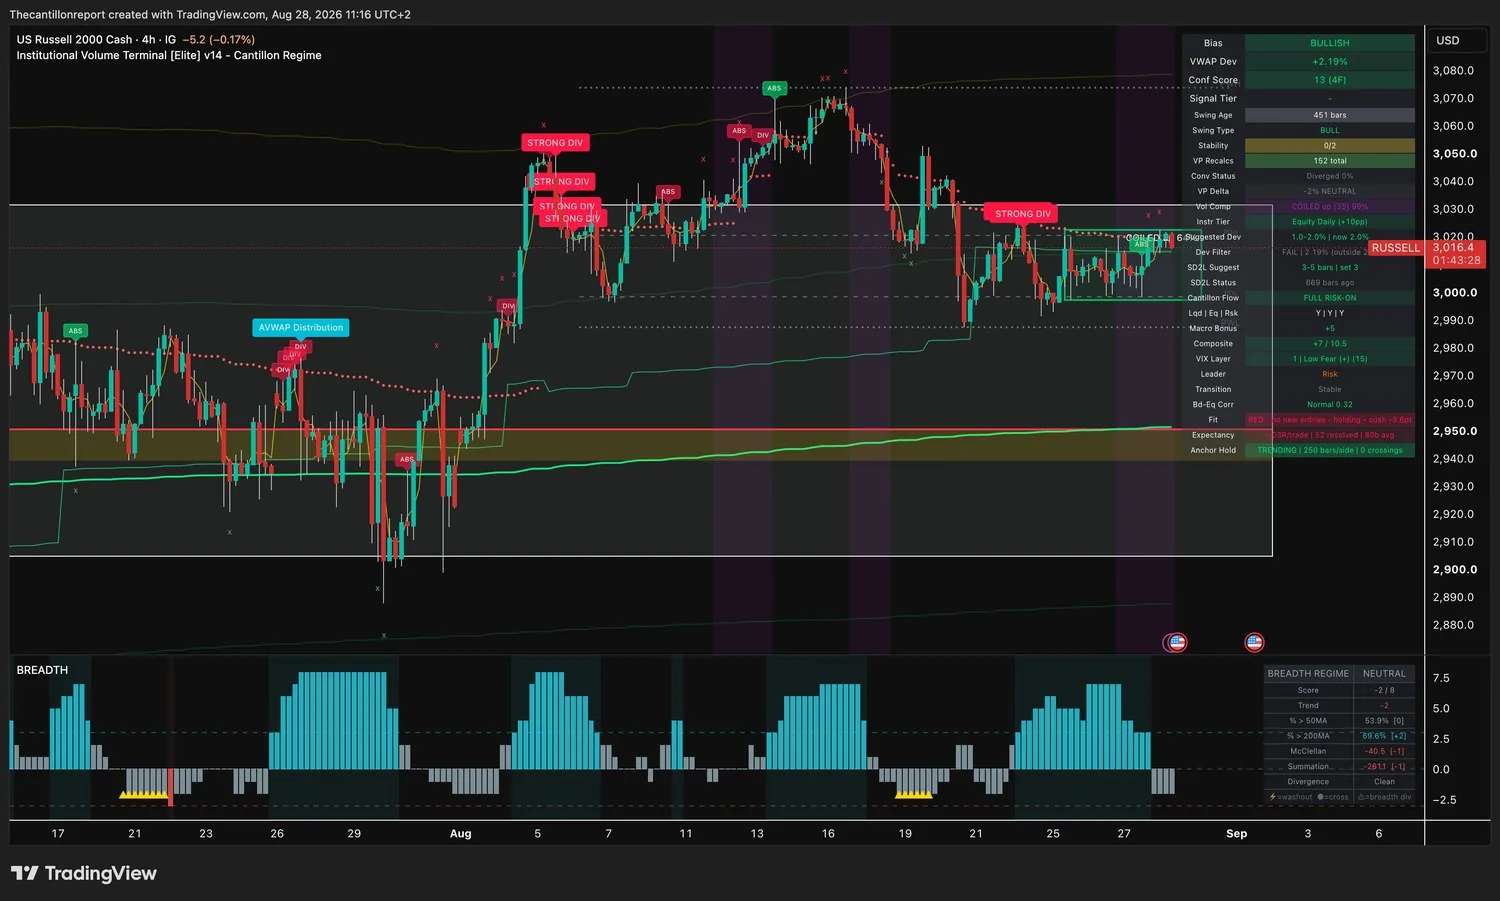
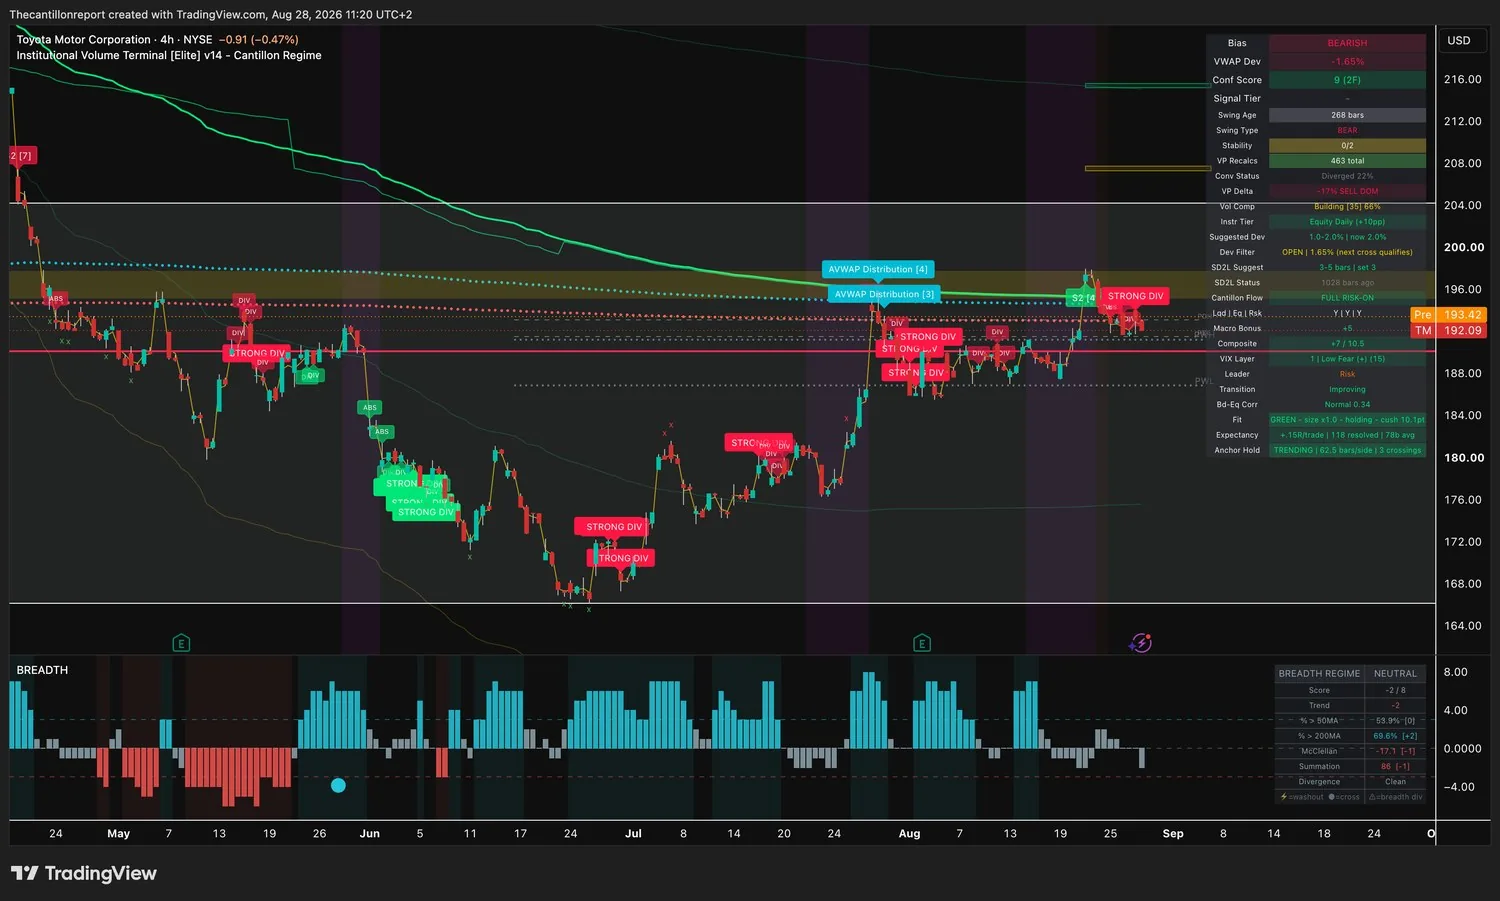
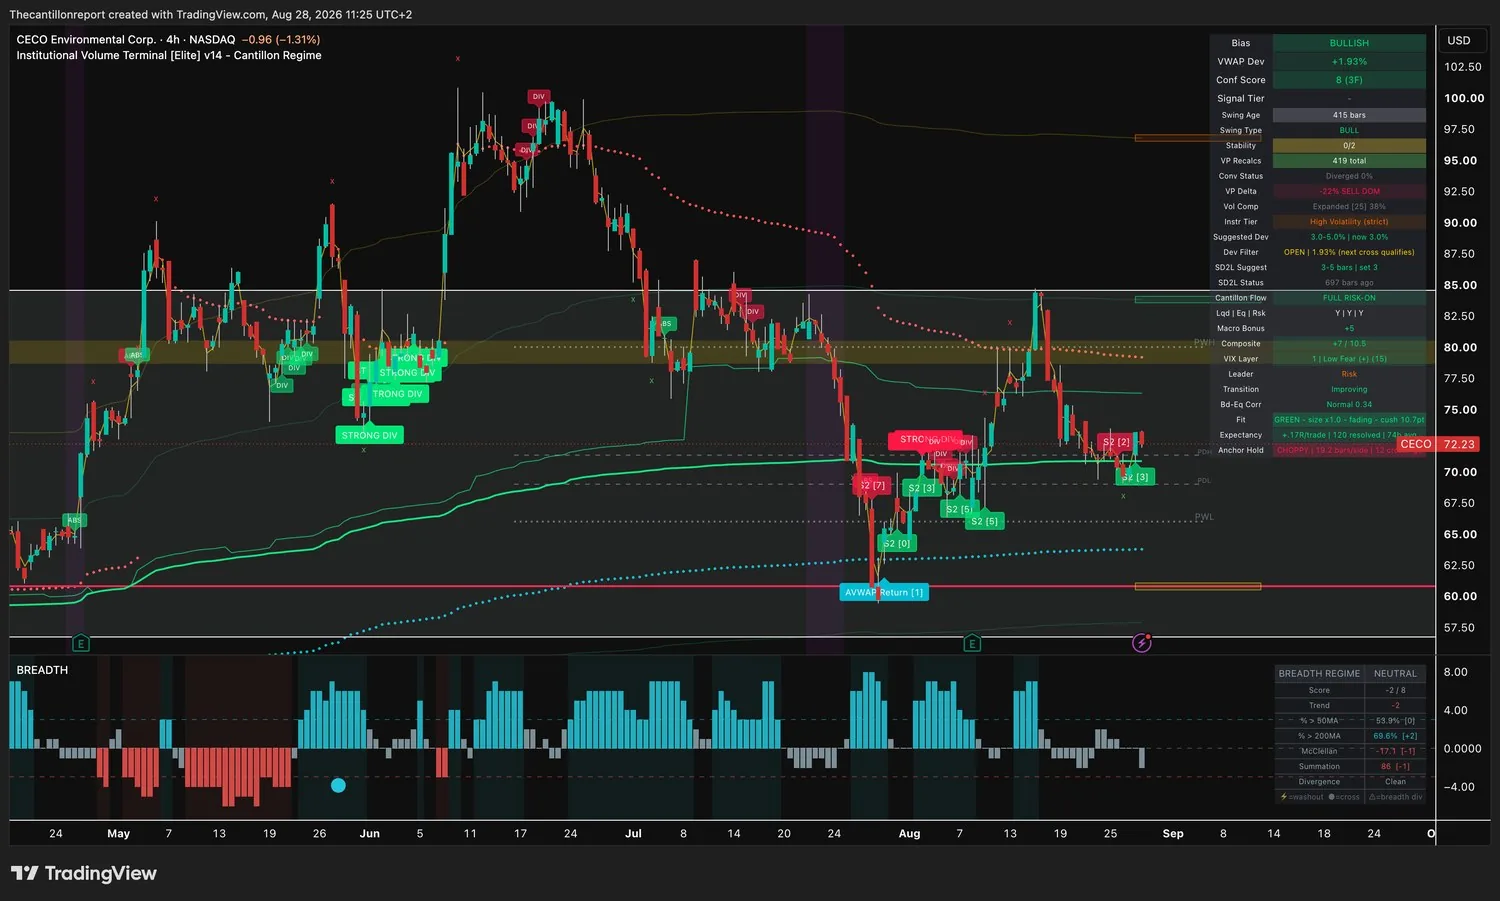
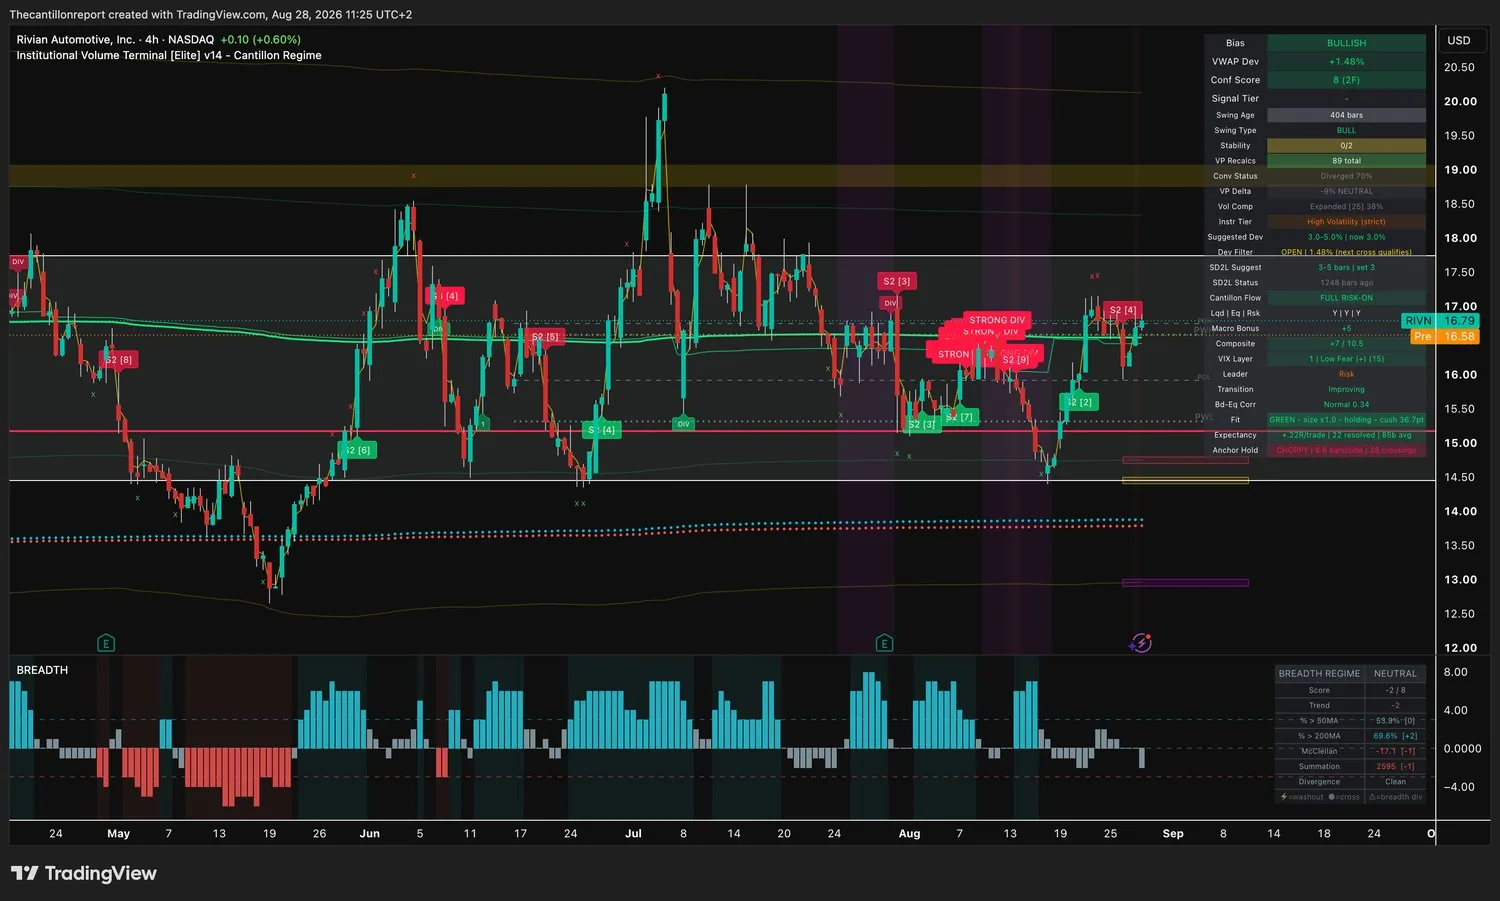
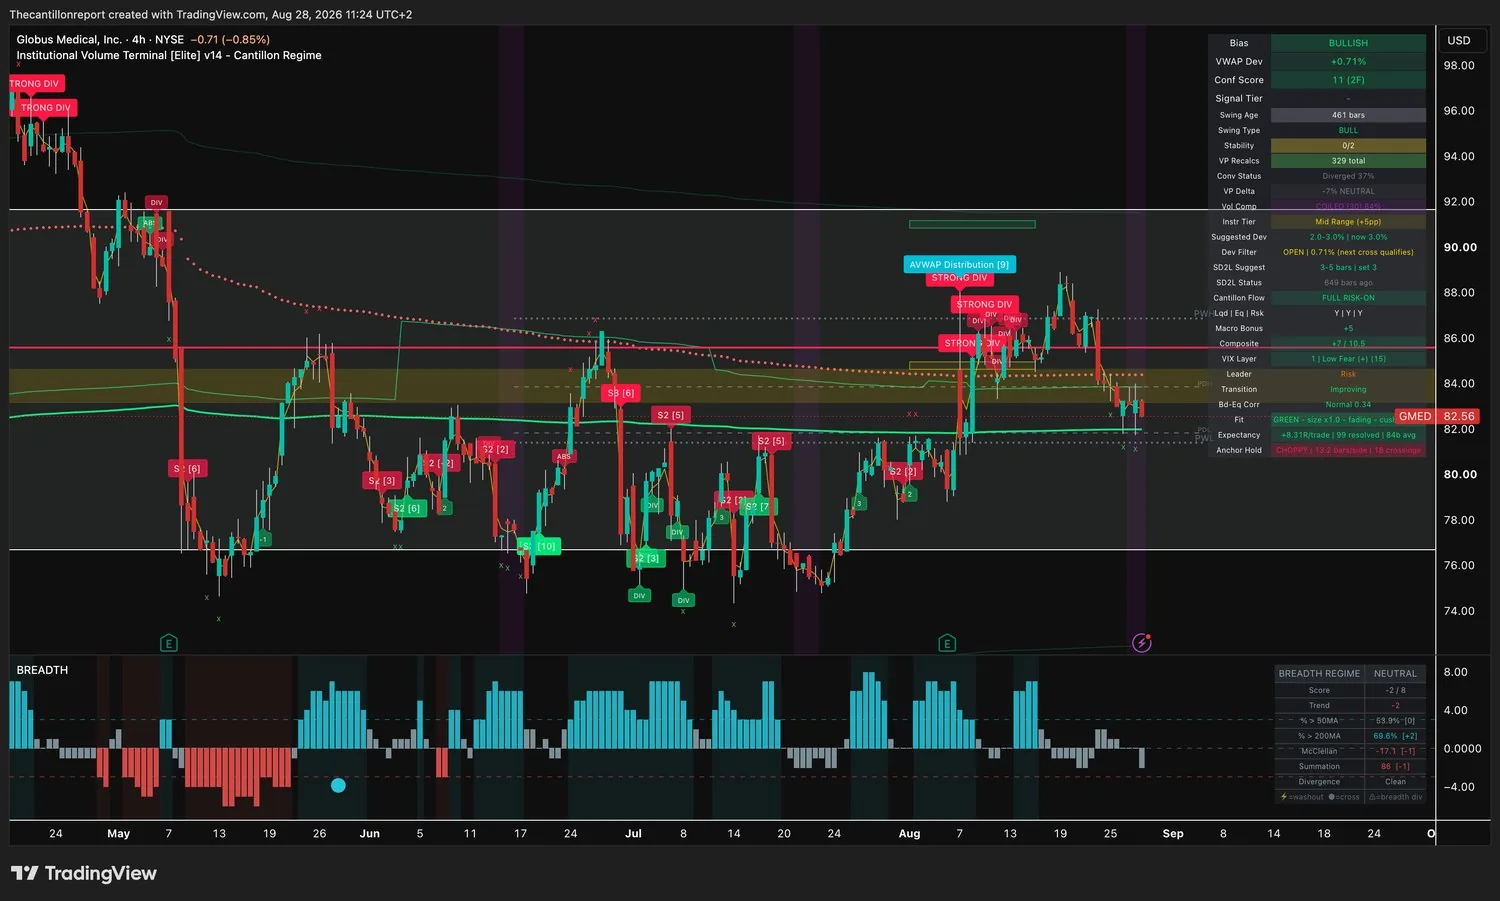
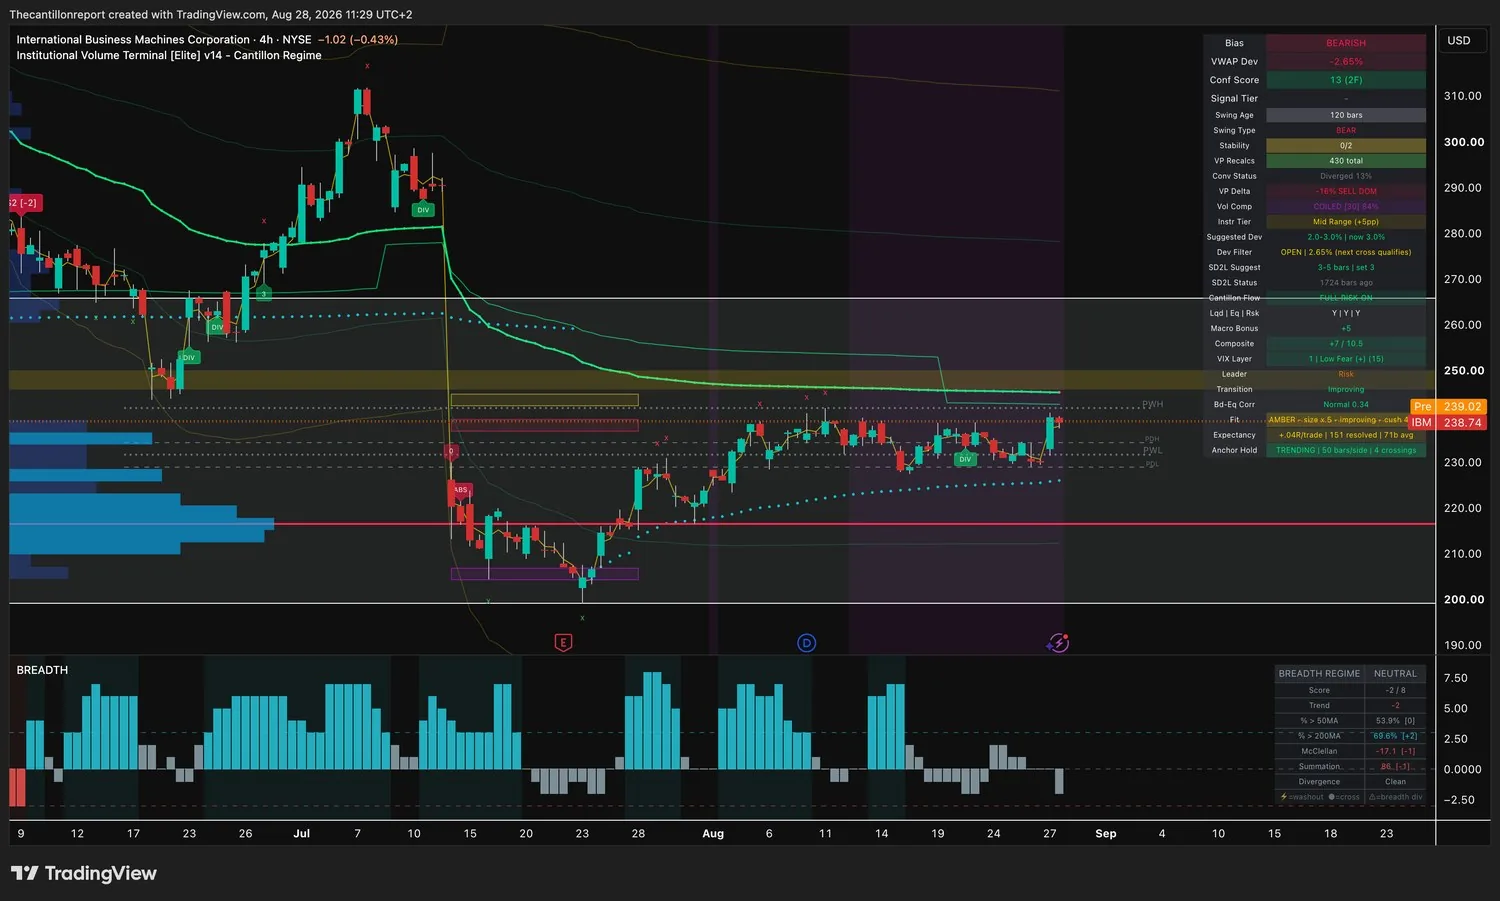
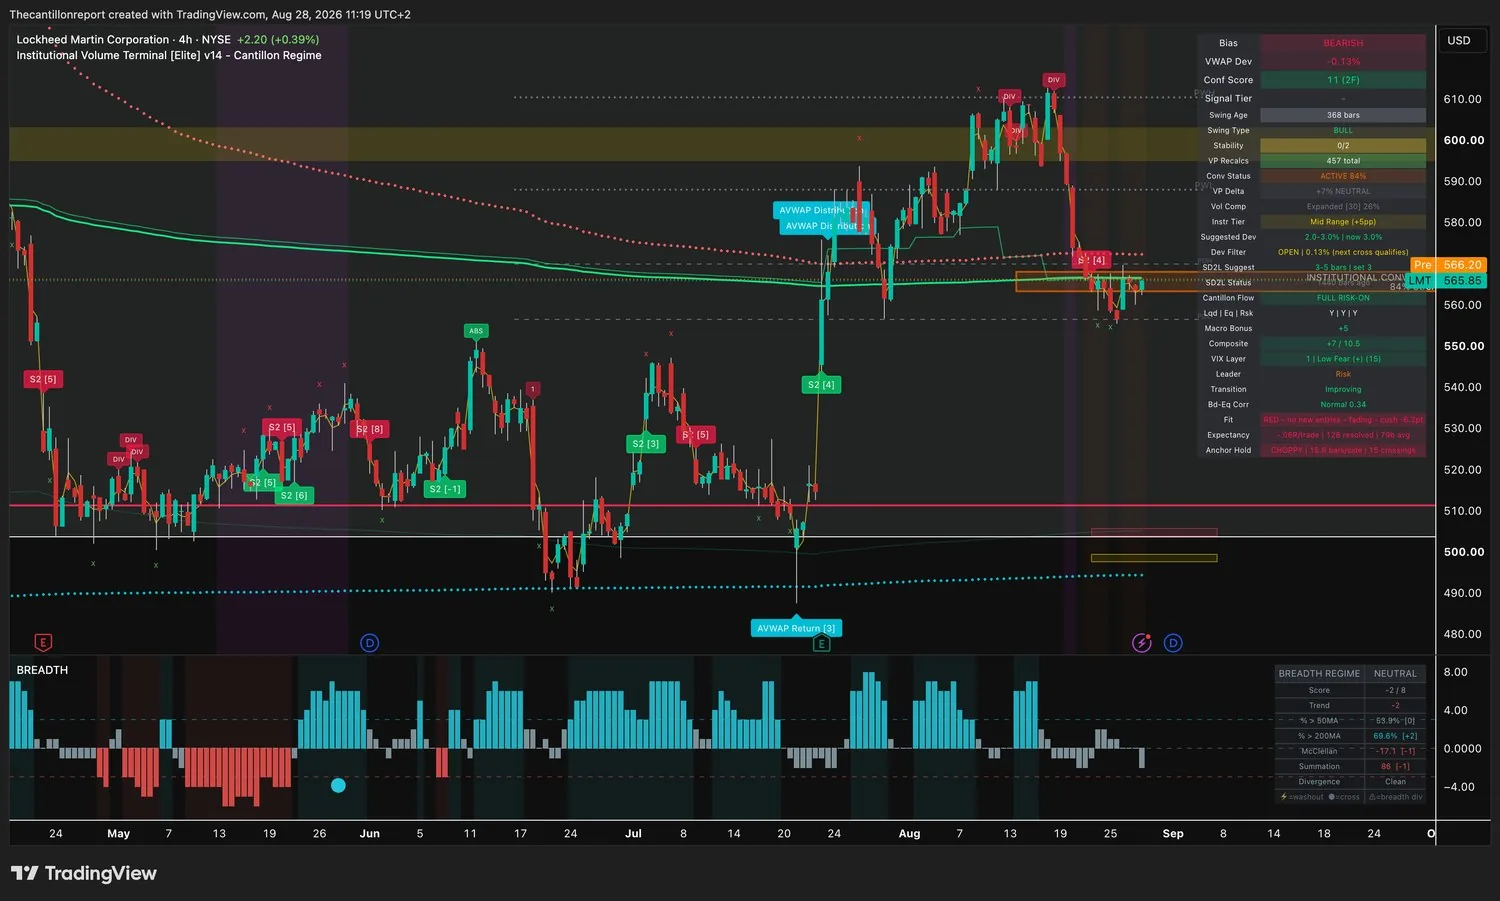
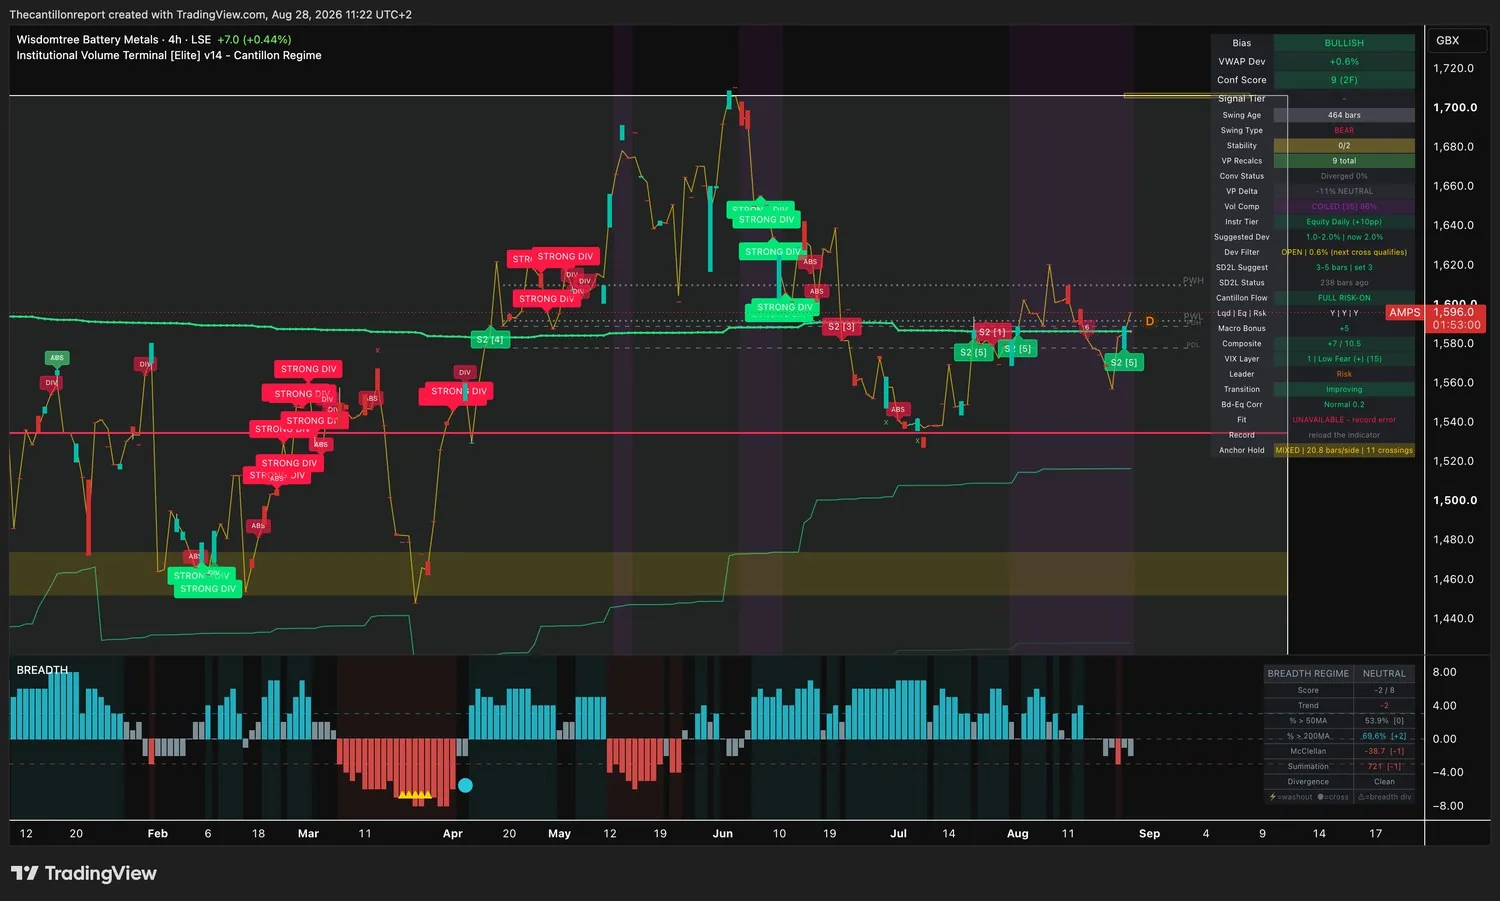
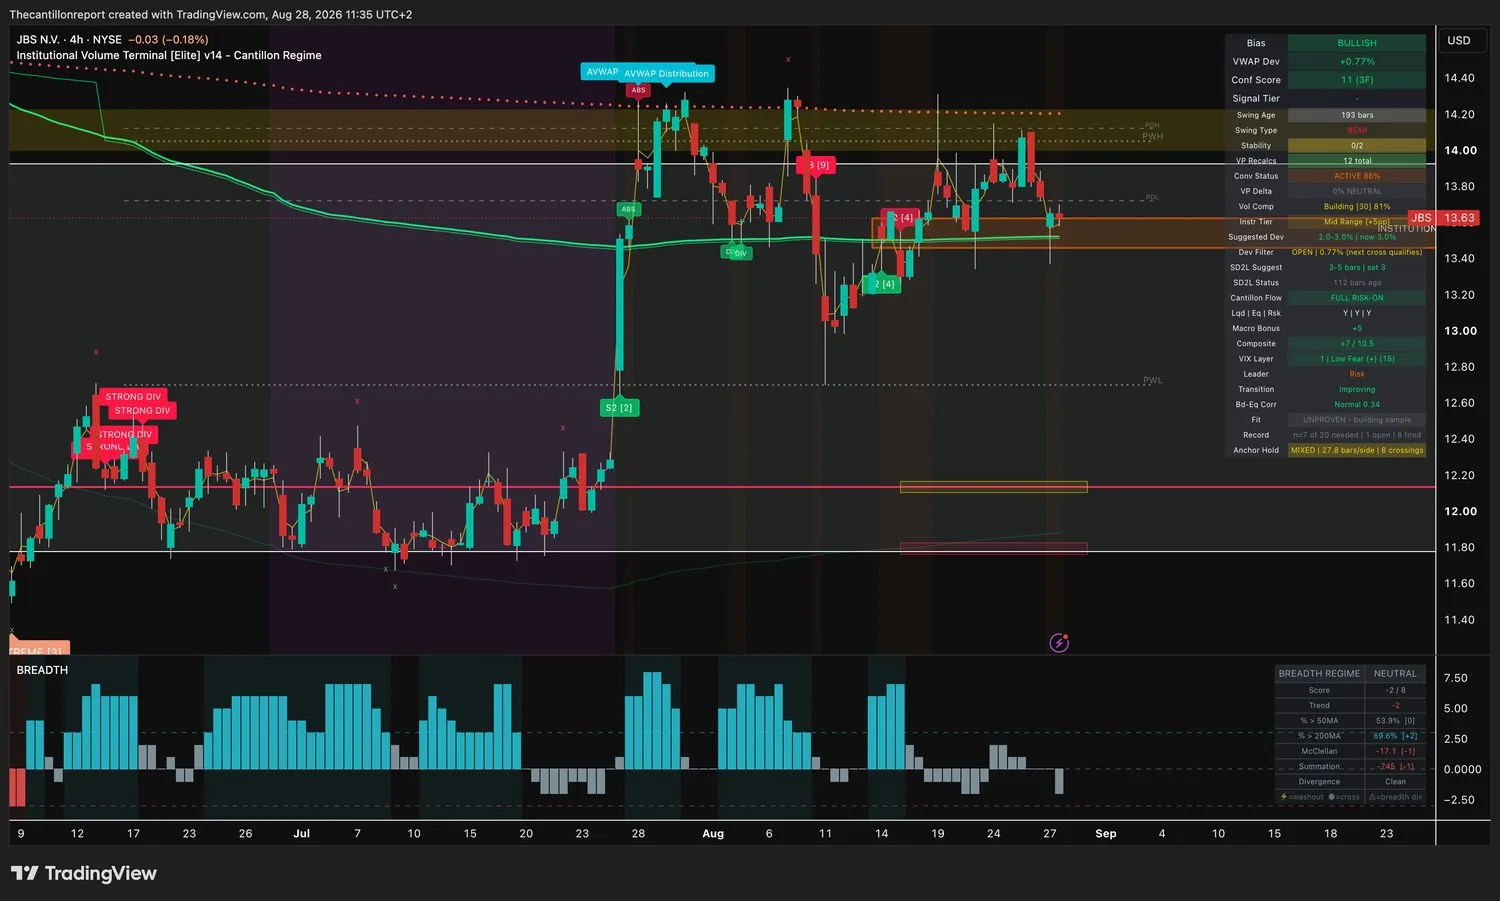
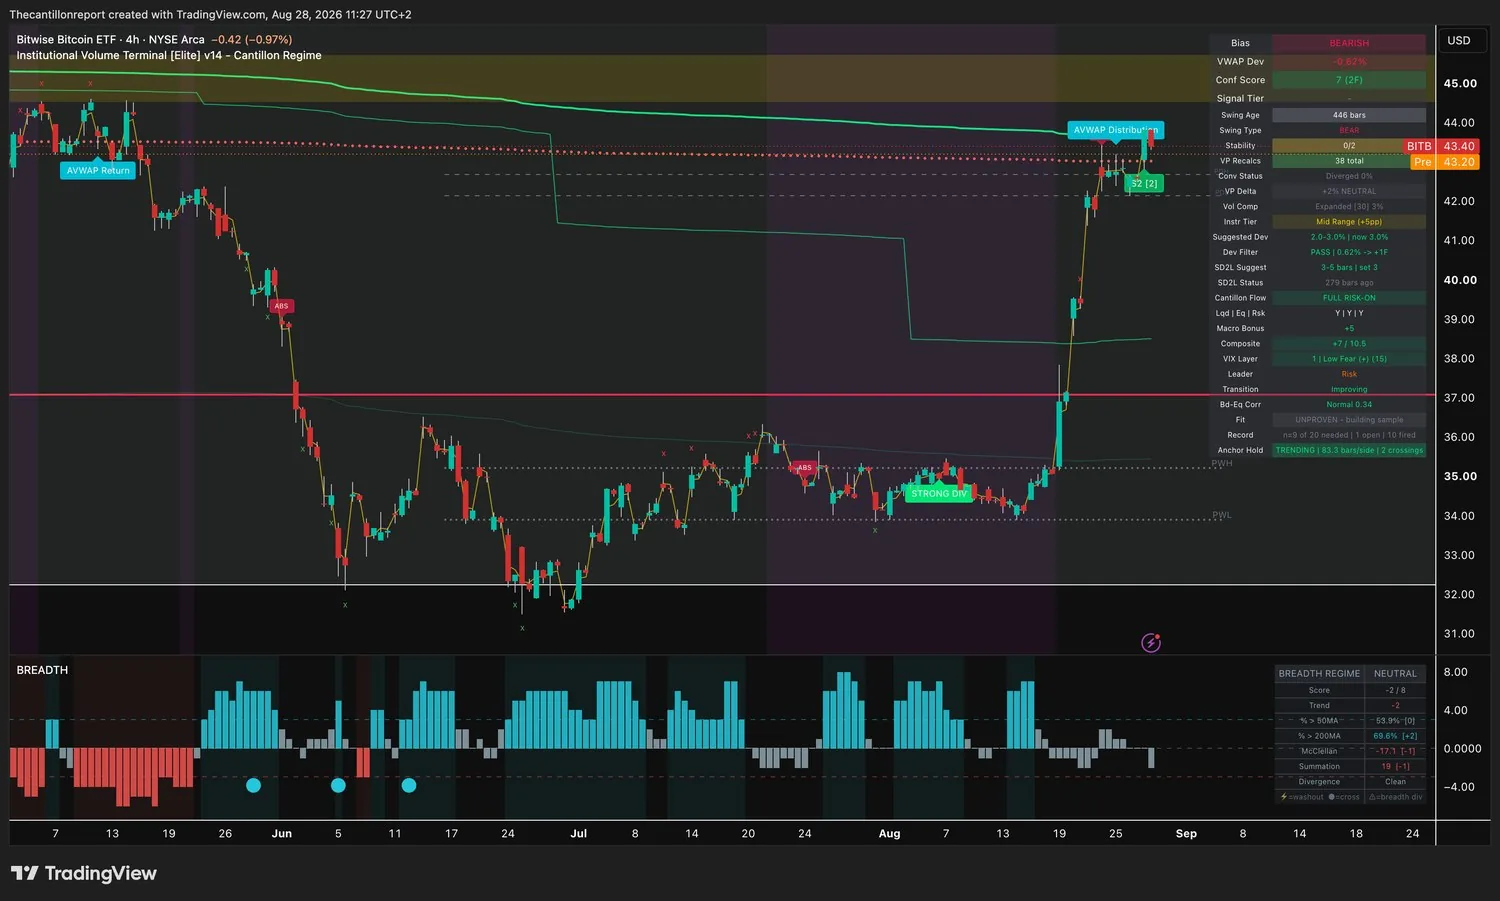
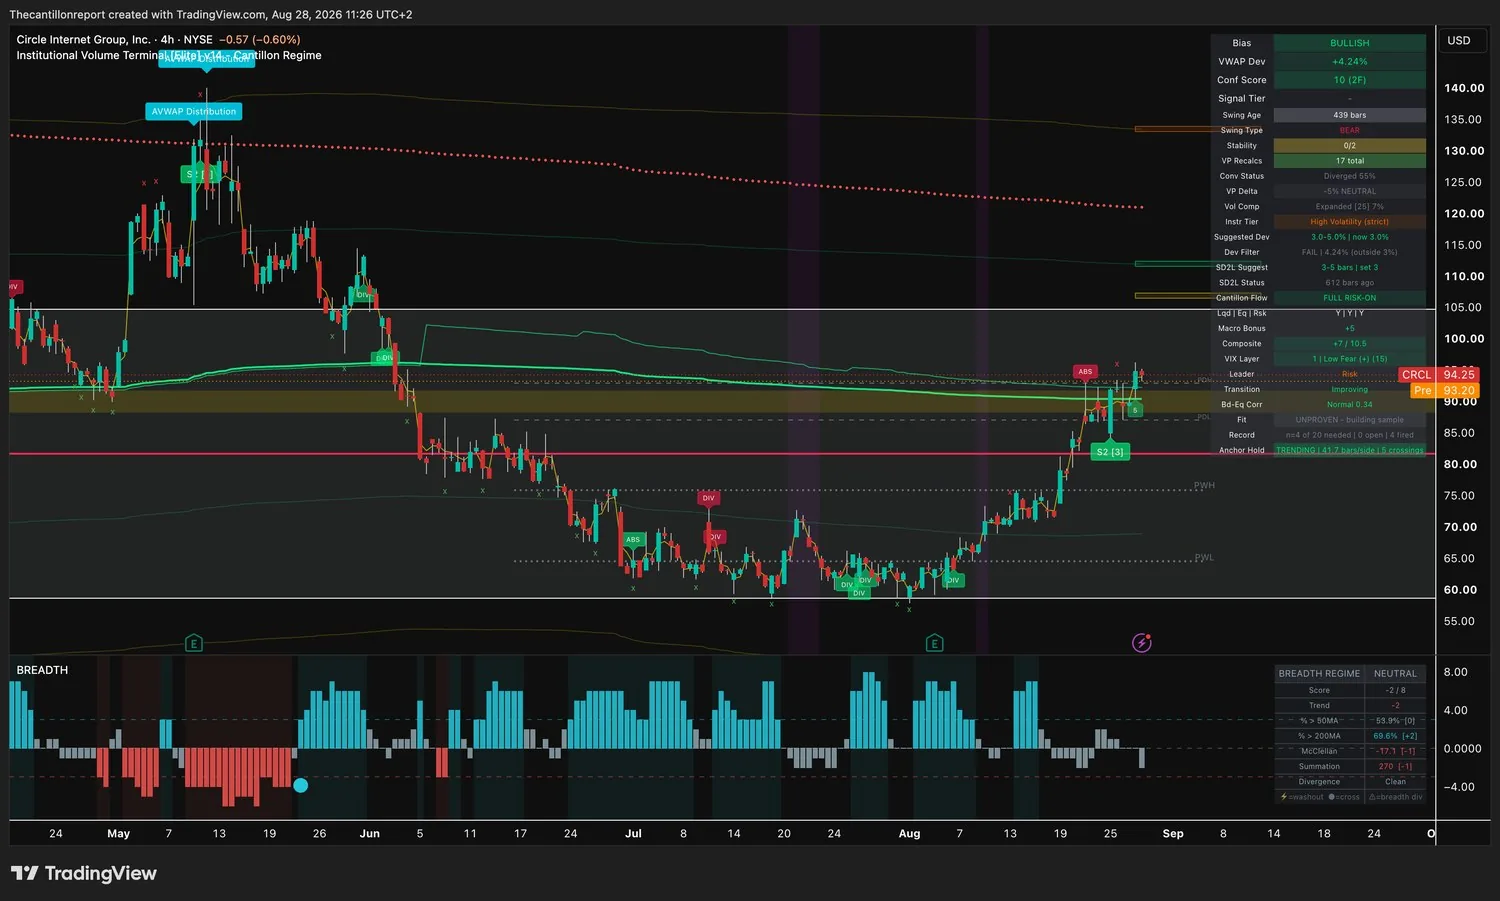
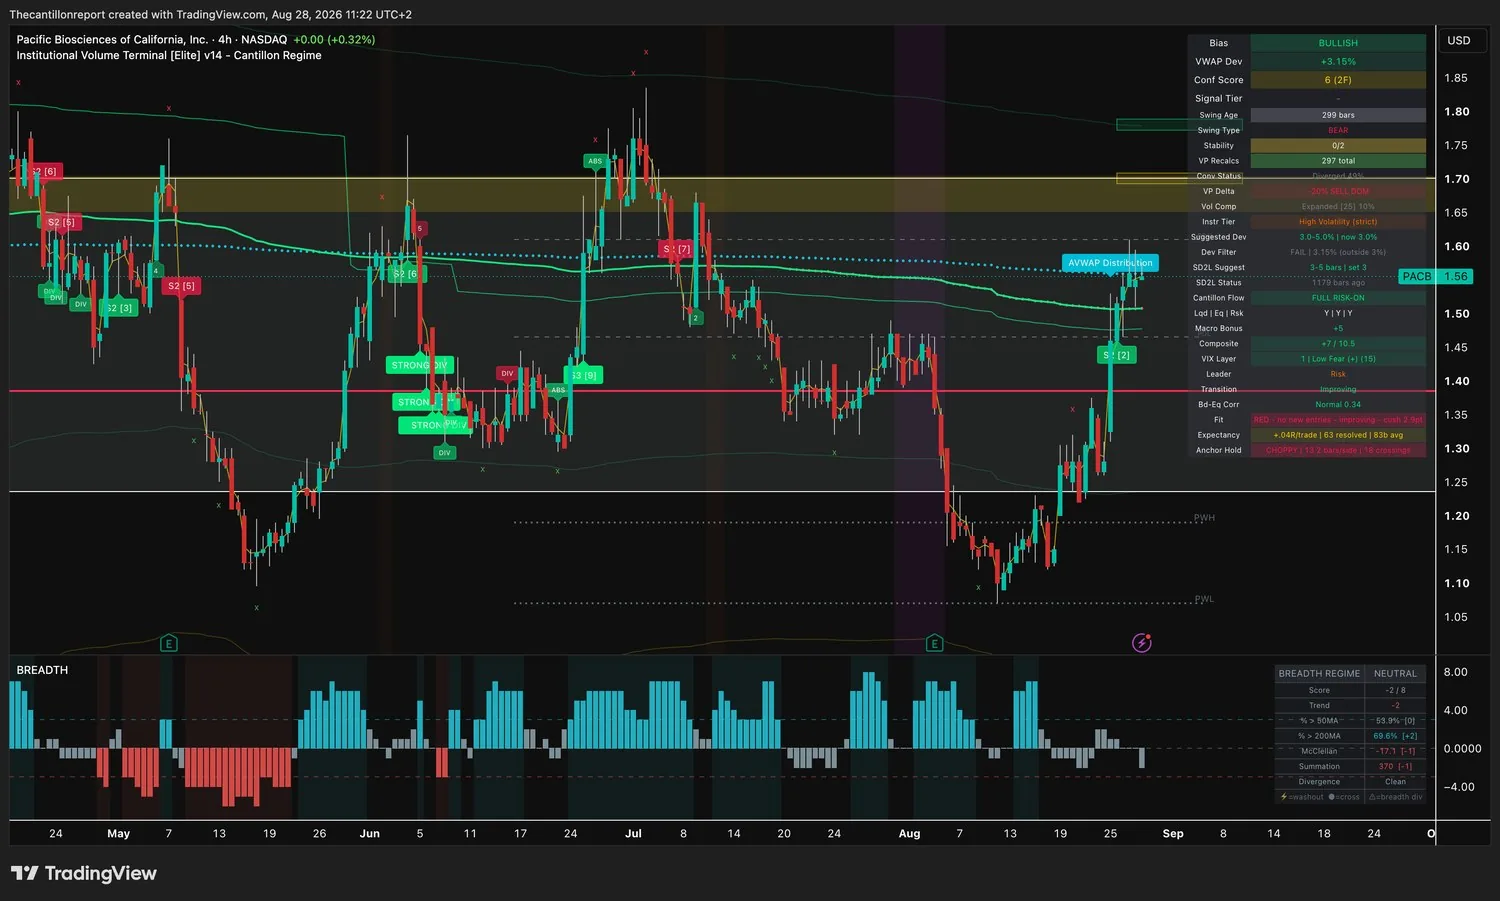
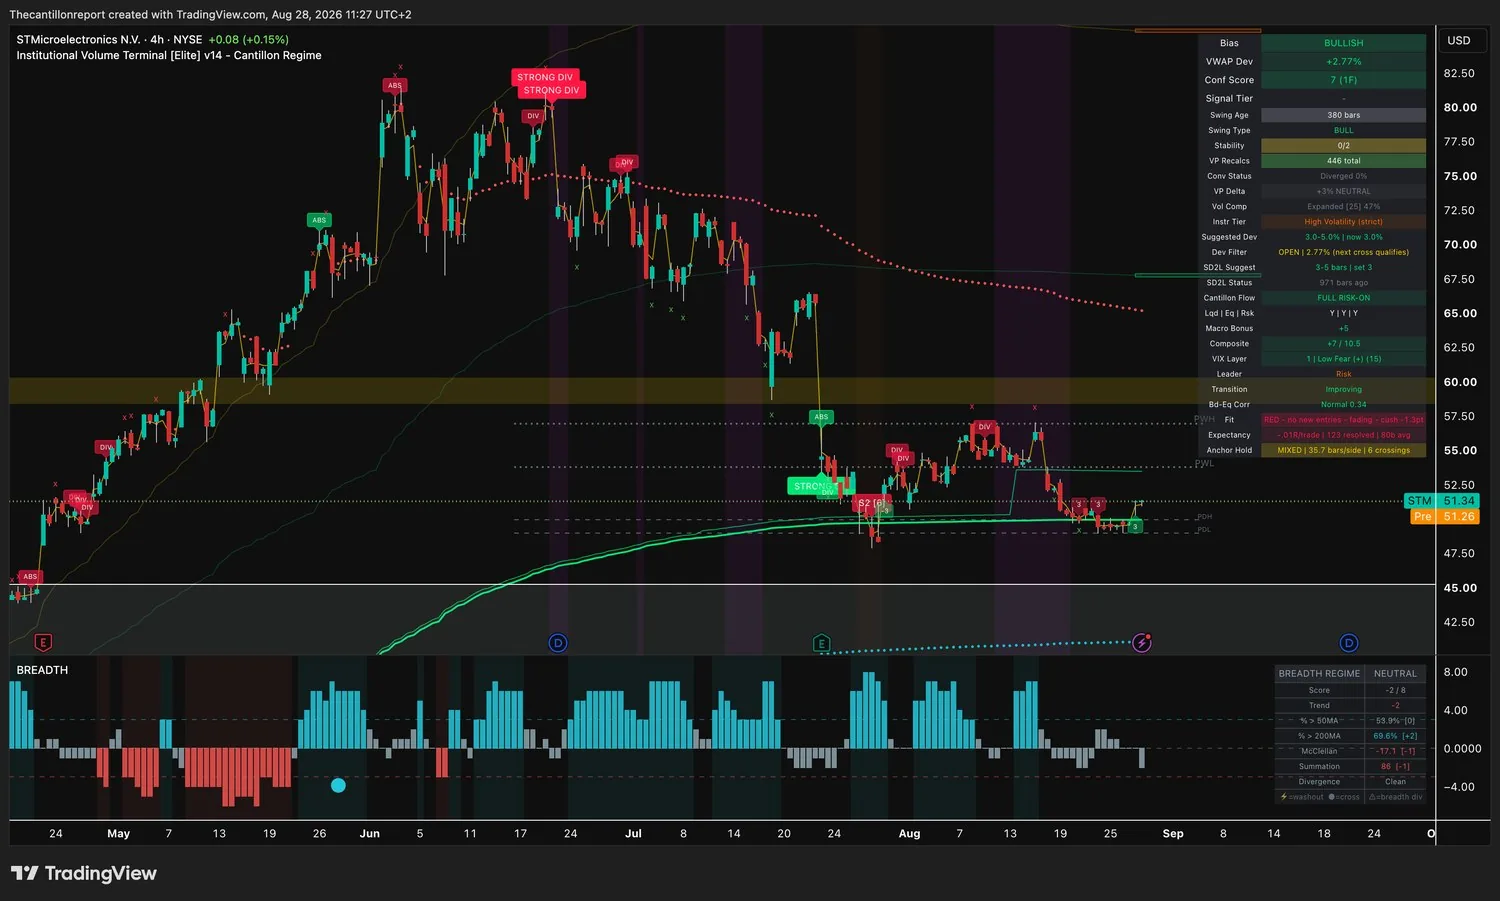
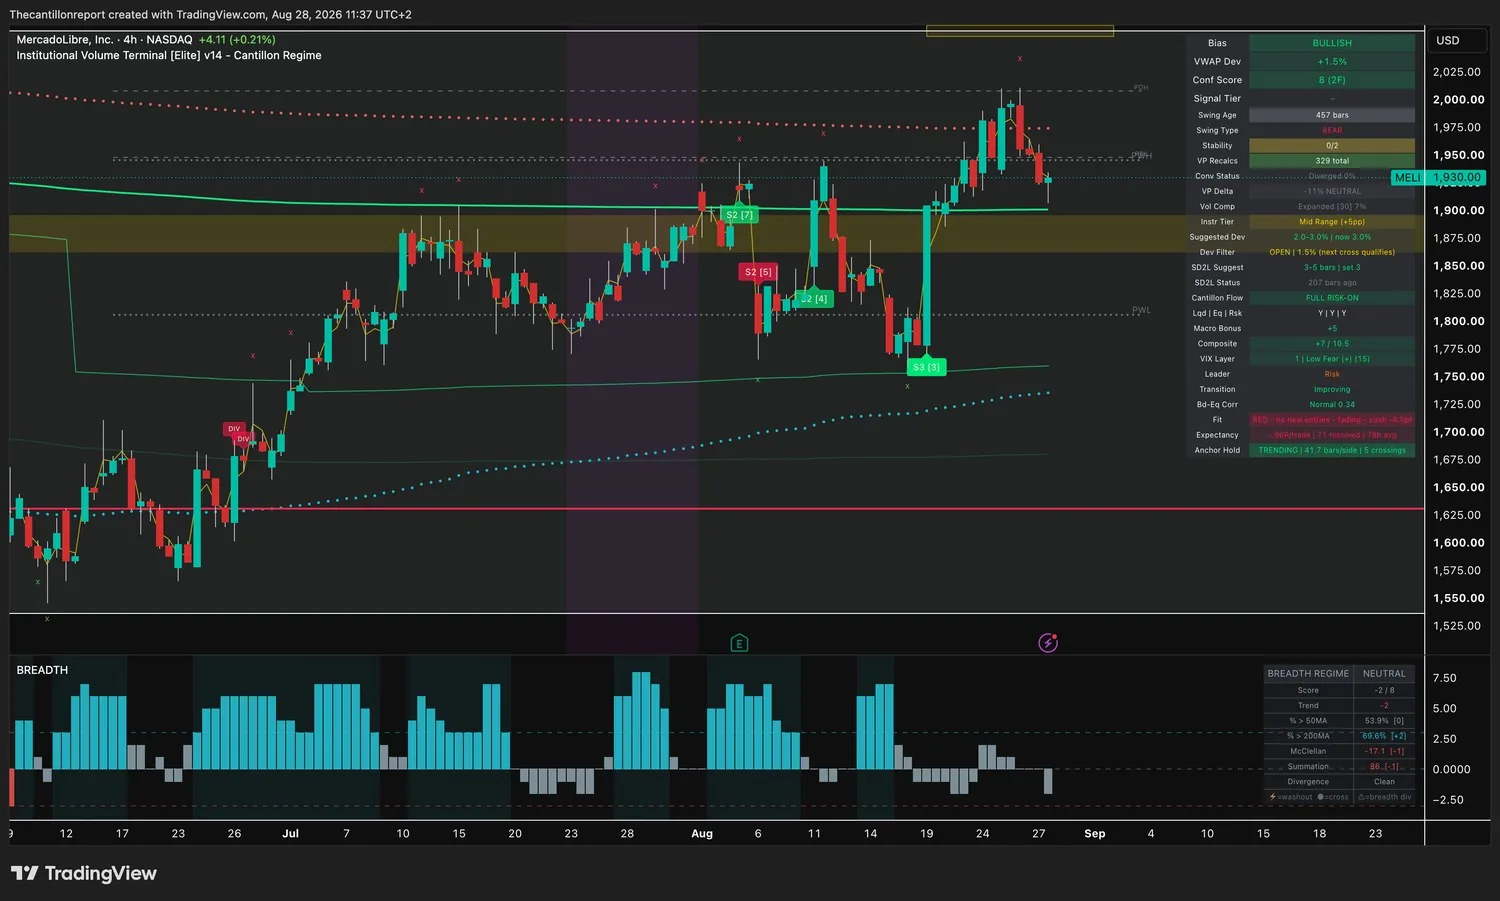
Cost line (the anchor) · the volume-weighted price large money actually paid over the current swing. Everything in this brief is measured as distance from it, and that distance is what "deviation" means. Sell near it and you are selling where they bought. Sell far below it and you are handing them the profit. Entry window · how far from the cost line a new entry can still be sensibly priced. The width depends on the instrument's own volatility tier: two percent for indices and large caps, three percent for mid-range names, three to five for the high-volatility list. Open means you are inside it and waiting on the cross. Qualified means the cross has already printed inside it. Shut means the move has run and you wait for a pullback or a fresh coil. Every trigger in this brief is a four-hour close, in the trade's direction, never a touch. Compression · how tightly the range has wound, from 0 to 100%. Building means it is loading. Coiled means it is nearly full, and coiled spring is the terminal's own label for the tightest version. High compression means the next move should be a big one, says nothing about direction, and never overrides a shut window or a red light. Confirmation · how many independent readings agree, and across how many timeframes. Higher on both counts is better, and two timeframes at 6 beats one timeframe at 8. Buyer or seller dominance · which side is actually transacting at the most-traded price, as a percentage skew. Neutral means the two sides are matched and the volume is telling you nothing about direction. This is the reading that has gone flat across most of the scan. Stability · a two-part check that the current reading has held long enough to be relied on. Zero of two means neither part has passed. Convergence · how tightly the separate institutional cost lines have clustered. High convergence means several cohorts of large money paid roughly the same price, so the line underneath is thicker than usual. Signal tier · awarded when the entry cross, the confirmation and the window all line up at once. One name carries one today and eighteen do not. Record · the average result per signal in units of risk, where being stopped out is exactly −1.00. Always published with the number of finished signals behind it, and never published at all below 20 of them. It is in-sample, so read it as a description of the past and not a forecast. Where the average is distorted by a small number of very large winners, this brief says so and tells you not to size off it. Trend light and cushion · green means full size, amber means half, red means no new entry however good the chart looks, and unproven means the sample is still being built. The cushion is how far the light is from changing, and a negative cushion means it has already changed against you.
Readings captured Friday 28 August 2026, 11:16–11:37 CEST, from the IVT v14 terminal, on four-hour bars that had not yet closed. That is why every trigger here is a close and not a touch, and it matters more than usual today: four of the eleven sized instruments are inside one percent of their own cost line, where an intraday wick carries no information, and a Fed chair speaks at 10:00 Eastern.
Records are in-sample, calculated over the same history the settings were chosen on, so they describe the past and forecast nothing. No rate is published on fewer than twenty finished signals, and the sample size is printed beside every one. Globus Medical's expectancy field is reported as faulty rather than published. Index levels come from cash CFD feeds and will differ from your own index or futures contract. Entry windows are derived from the percentage distances the terminal publishes, so treat them as accurate to the nearest cent or index point; trigger levels are set at the nearest structural shelf and are ours, not the terminal's. No level here is meant to survive an earnings gap.
Charts are unmodified terminal captures provided for reference, not as entry instructions. Educational content only. Not financial advice. Past results do not predict future ones.