Composite +1/9. Correlation 0.41. The Headwind Just Went To Zero.
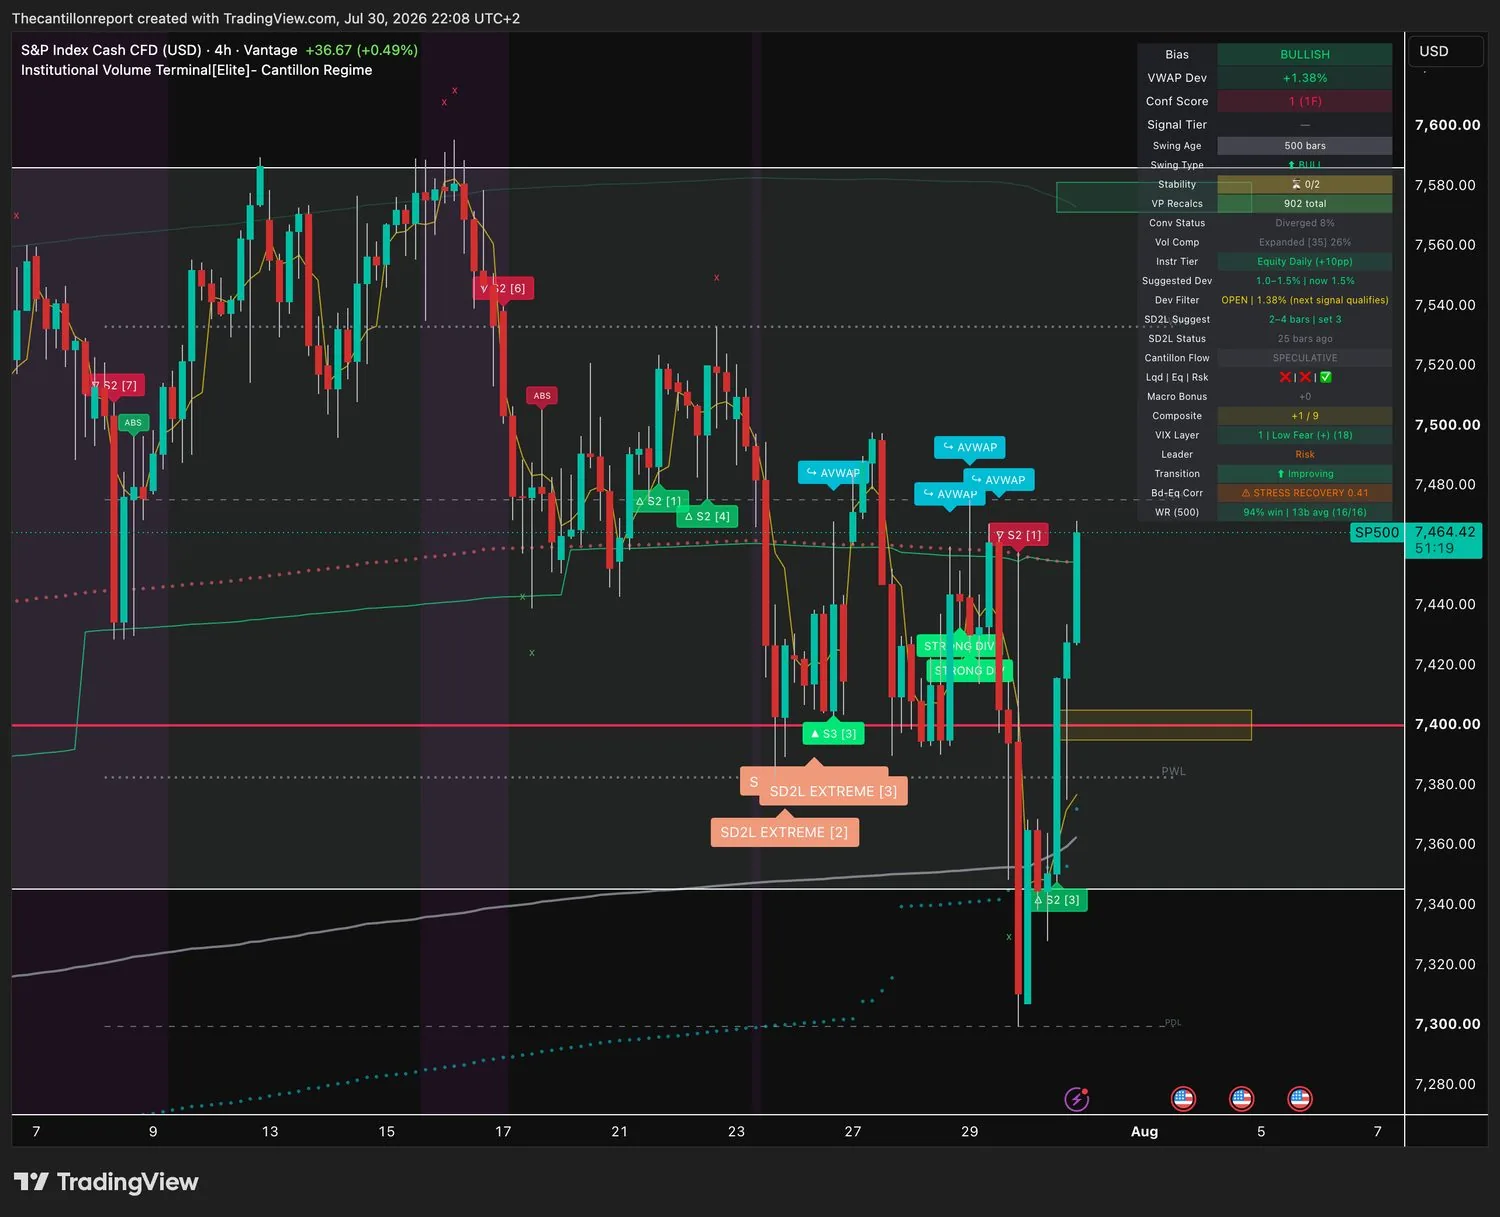
The risk layer switched back on and took the whole regime with it. Three of the four index feeds now read SPECULATIVE at Composite +1/9, against FULL RISK-OFF at −6/9 twenty-four hours earlier. That is a seven-point swing, and the −3 macro headwind that was working against every long has gone to zero. Bond-equity correlation fell from 0.52 to 0.41. That is progress and it is not an all-clear, because 0.41 still sits above the 0.35 line where bonds stop hedging equities. Four setups now sit on their institutional anchors with the entry filter passing, and Rivian's earnings are finally behind it.
Date July 31, 2026
Session Friday · Thursday's Close
Access Free · No Paywall
RegimeSpeculative
Composite+1 / 9
LayersLqd ✗ · Eq ✗ · Rsk ✓
VIXLow Fear (17–18)
Macro Bonus0
LeaderRisk
Bd-Eq CorrStress Recovery 0.41
Transition↑ Improving
New here? Six words decode the whole brief.
Composite · how many of the 9 market layers are risk-on. Negative means risk-off.
Macro bonus · the regime's tailwind (+) or headwind (−) applied to every trade today.
Dev · how far price sits from the price institutions actually paid. Small is good. PASS is better than OPEN.
Conf · how many timeframes agree with the signal. Higher is better.
COILED · volatility wound tight. A big move is coming; the reading does not say which way.
WR (n/m) · win rate across m signals that have finished, not m signals fired.
SPECULATIVE at Composite +1/9. The risk layer is the only one on, and it is carrying the entire reading. A macro bonus of zero means the framework neither helps nor hinders a long today, so position size has to come from the setup itself rather than from the regime. That is a real improvement on a −3 headwind and it is still a long way from a tailwind. The structural caveat is the correlation at 0.41. It is labelled STRESS RECOVERY rather than STRESS, but it sits above 0.35, which means a long equity book still has no bond hedge underneath it. Bonds and equities are moving together with slightly less conviction than yesterday, and that is the whole of the improvement.
Read this before you use any number below. Readings were captured between 21:55 and 22:08 CEST and the regime moved inside that window. The four index charts are the most recent captures, and three of them read SPECULATIVE at +1/9 with the macro bonus at zero. The single-name captures are two to thirteen minutes older and their dashboards still read FULL RISK-OFF at −1/9 to −3/9. The index reading is the current one. Treat the regime rows on the single-name charts as stale and their instrument rows as current. That means bias, deviation, confidence, compression and win rate. Separately, the Dow feed lags the other three indices by roughly one bar and shows the old regime on the latest capture. Institutional anchor prices below are derived from the deviation percentage rather than read directly, so treat every anchor as approximate and the deviation percentage as the number that matters.
What Changed
The Risk Layer Did The Whole JobLayers now read Lqd ✗ · Eq ✗ · Rsk ✓. Bonds and equities are both still off. The only thing that changed is the risk layer switching on, and leadership has moved to Risk with it. That single flip took the Composite from −6/9 to +1/9 and the macro bonus from −3 to zero. Understand what that does and does not mean: it removes the penalty the framework was applying to every long, and it does not add support. One layer holding a regime up is the definition of a thin recovery.
Correlation 0.41 · Better, Not FixedBond-equity correlation on the index feeds reads 0.41, down from 0.52 a session ago. The terminal now labels it STRESS RECOVERY rather than STRESS. The distinction matters less than the level. Above 0.35 the framework still treats bonds and equities as one risk, so a bond position does not offset an equity position today. Single-name feeds read a normal 0.22 to 0.23, so the stress remains concentrated in the index complex exactly as it was yesterday. This number falling through 0.35 is what would turn today's improvement into a regime you can lean on.
Four Gates Passed, And This Time They Were EarnedYesterday three index gates opened because price collapsed into the anchors, which is location without opportunity. Tonight is different. Rivian, MercadoLibre, Pacific Biosciences and Editas all read Dev PASS, not merely open, and all four got there by price stabilising near the anchor rather than falling through it. A PASS adds a confluence factor rather than just permitting an entry. Three of the four also carry compression above 90%, which means a coil is loading underneath the location rather than an exhausted move sitting on top of it.
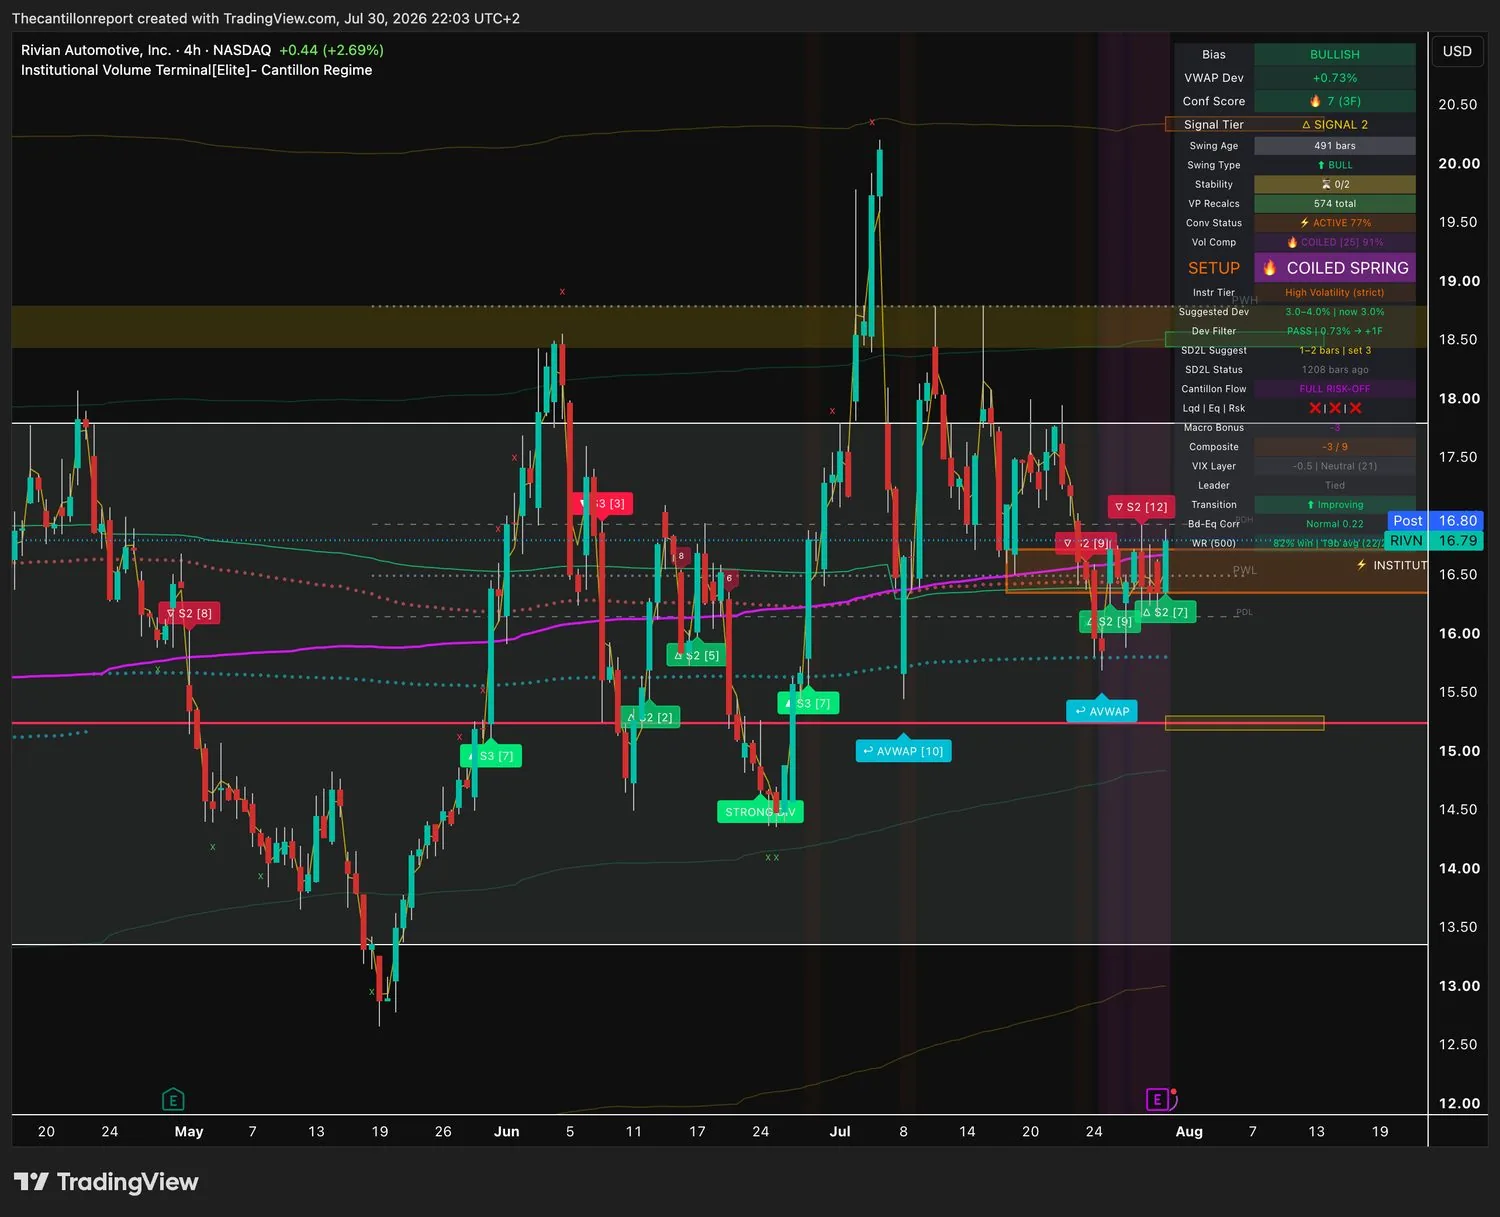
Rivian Cleared Its EventRivian reported after Thursday's close and trades +2.69% on the session at $16.79. Its confidence reading has recovered from 4 across two timeframes back to 7 across three, institutional convergence holds at ACTIVE 77%, and the terminal is still labelling the structure a COILED SPRING at 91%. The event risk that made it untouchable for two sessions is now behind it. Post-print names normally need a full session for anchors to re-form, and that caveat applies here, but the deviation filter already reads PASS at +0.73%.
On The Clock
• Friday 8:30am ET · June PCE, the last macro print of the week. With correlation at 0.41 this lands on bonds and equities at the same time instead of trading them off.
• Friday pre-open · Chevron reports. Not on tonight's board and not enterable ahead of the print.
• Tuesday 4 August · Gilead. Still an alert rather than a setup.
The Board · Every Tradeable Setup, Ranked · Full Levels, Free
#
Ticker
Dir
Entry (dev · price)
Trigger
Invalidation
Edge (WR · Conf · Comp)
Size
1
RIVN
Long
PASS +0.73% · $16.60–16.80
4h close > $16.85
4h close < $16.15
82% (22/25) · Conf 7 (3F) · COILED SPRING 91% · Conv ACTIVE 77%
High-Vol strict: −30–40%
2
MELI
Long
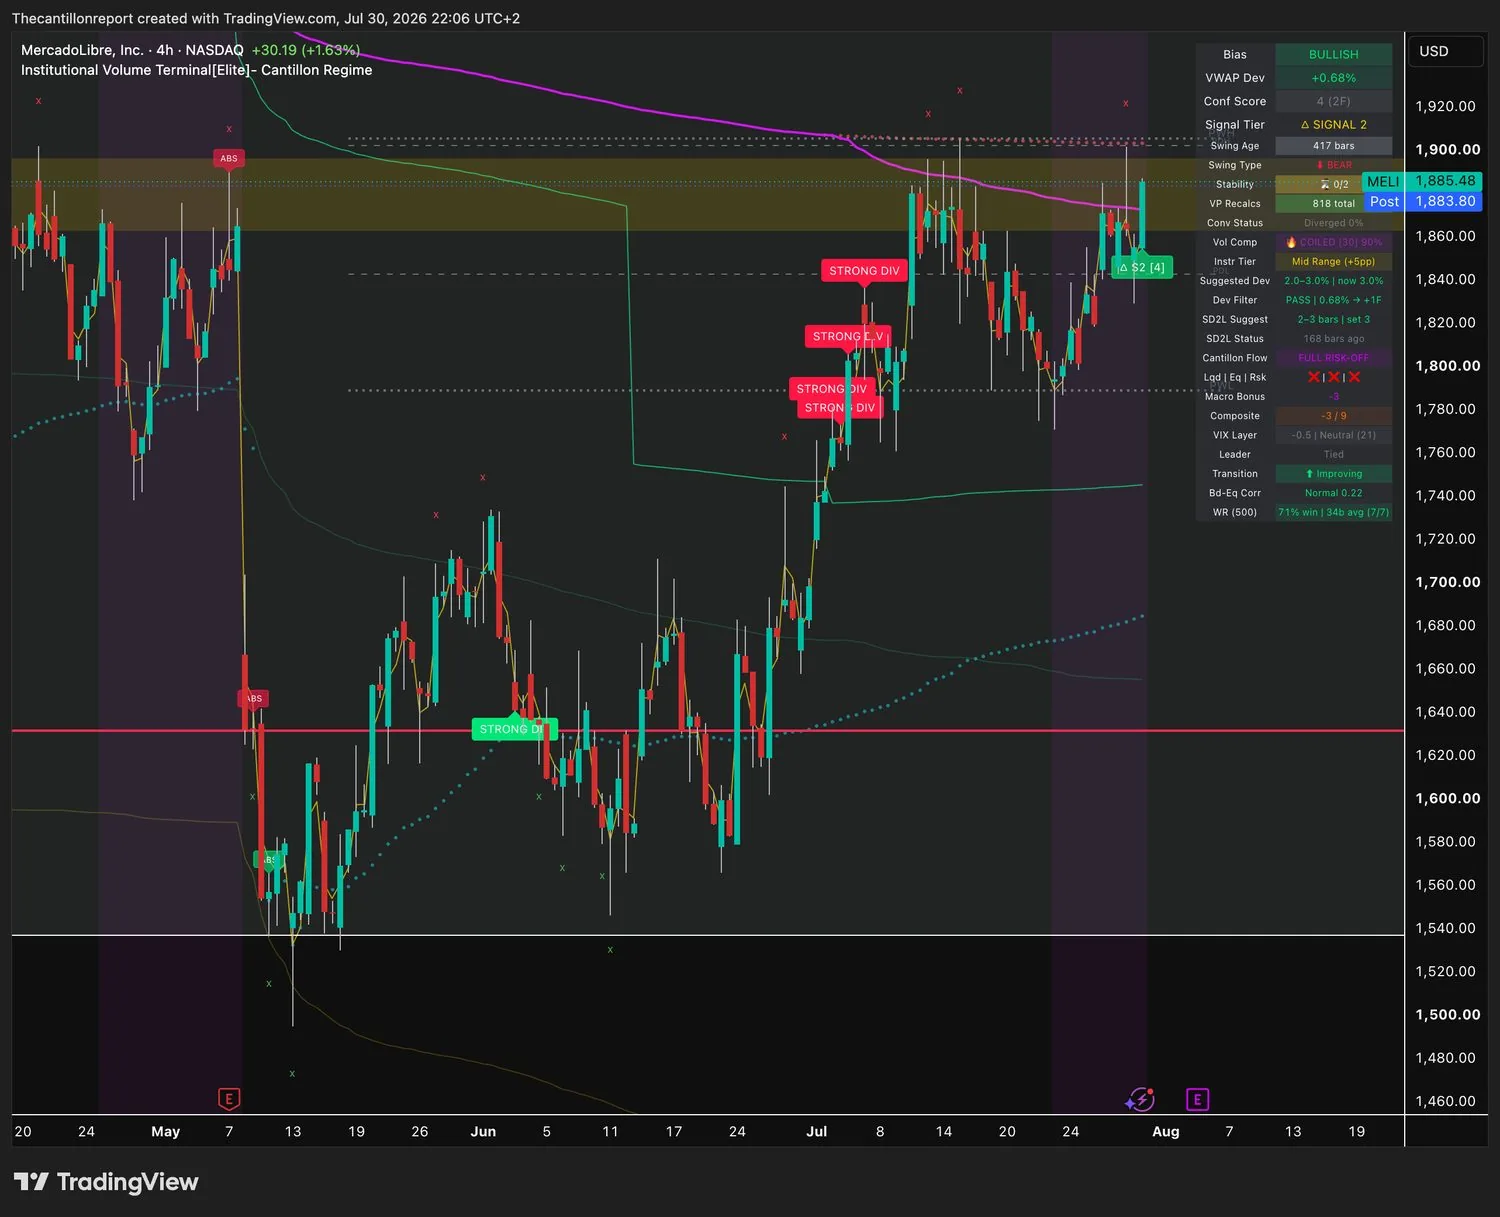
PASS +0.68% · $1,870–1,890
4h close > $1,900
4h close < $1,840
71% (7/7) · Conf 4 (2F) · COILED 90% · Signal 2
Mid-Range: standard
3
PACB
Long
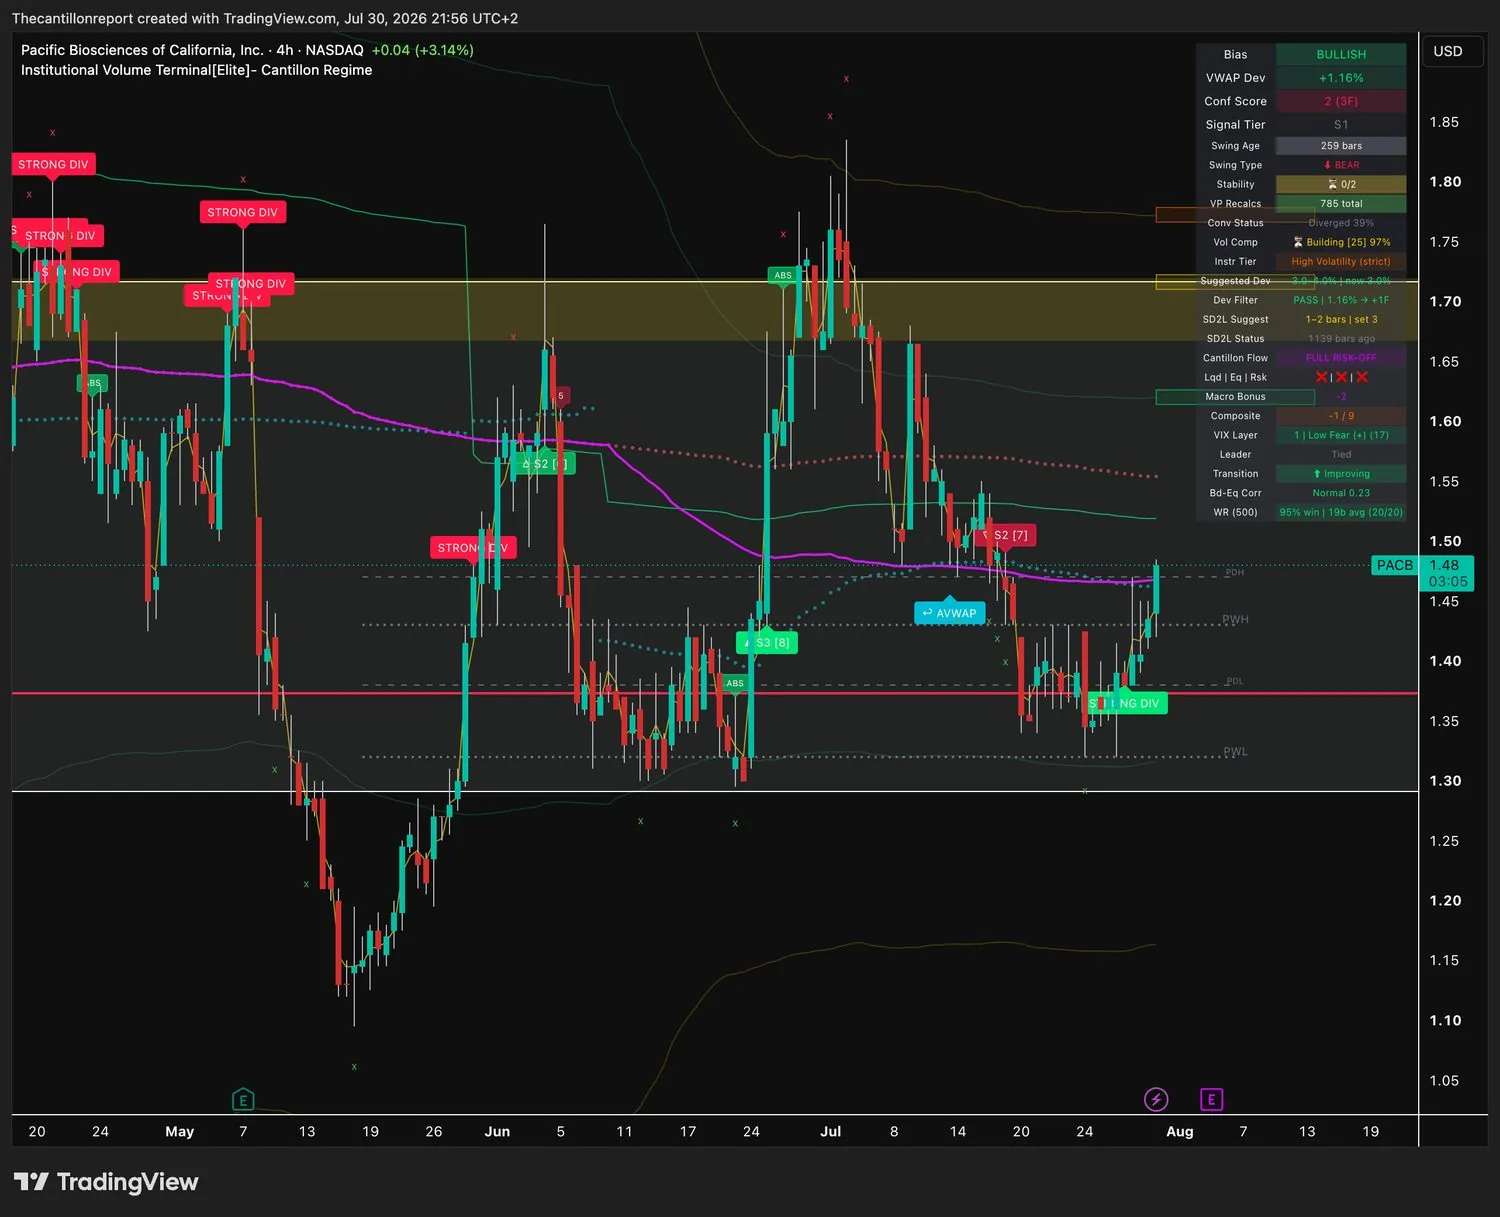
PASS +1.16% · $1.44–1.48
4h close > $1.50
4h close < $1.38
95% (20/20) · Conf 2 (3F) · Building 97%
High-Vol strict · micro-cap sizing only
4
EDIT
Long
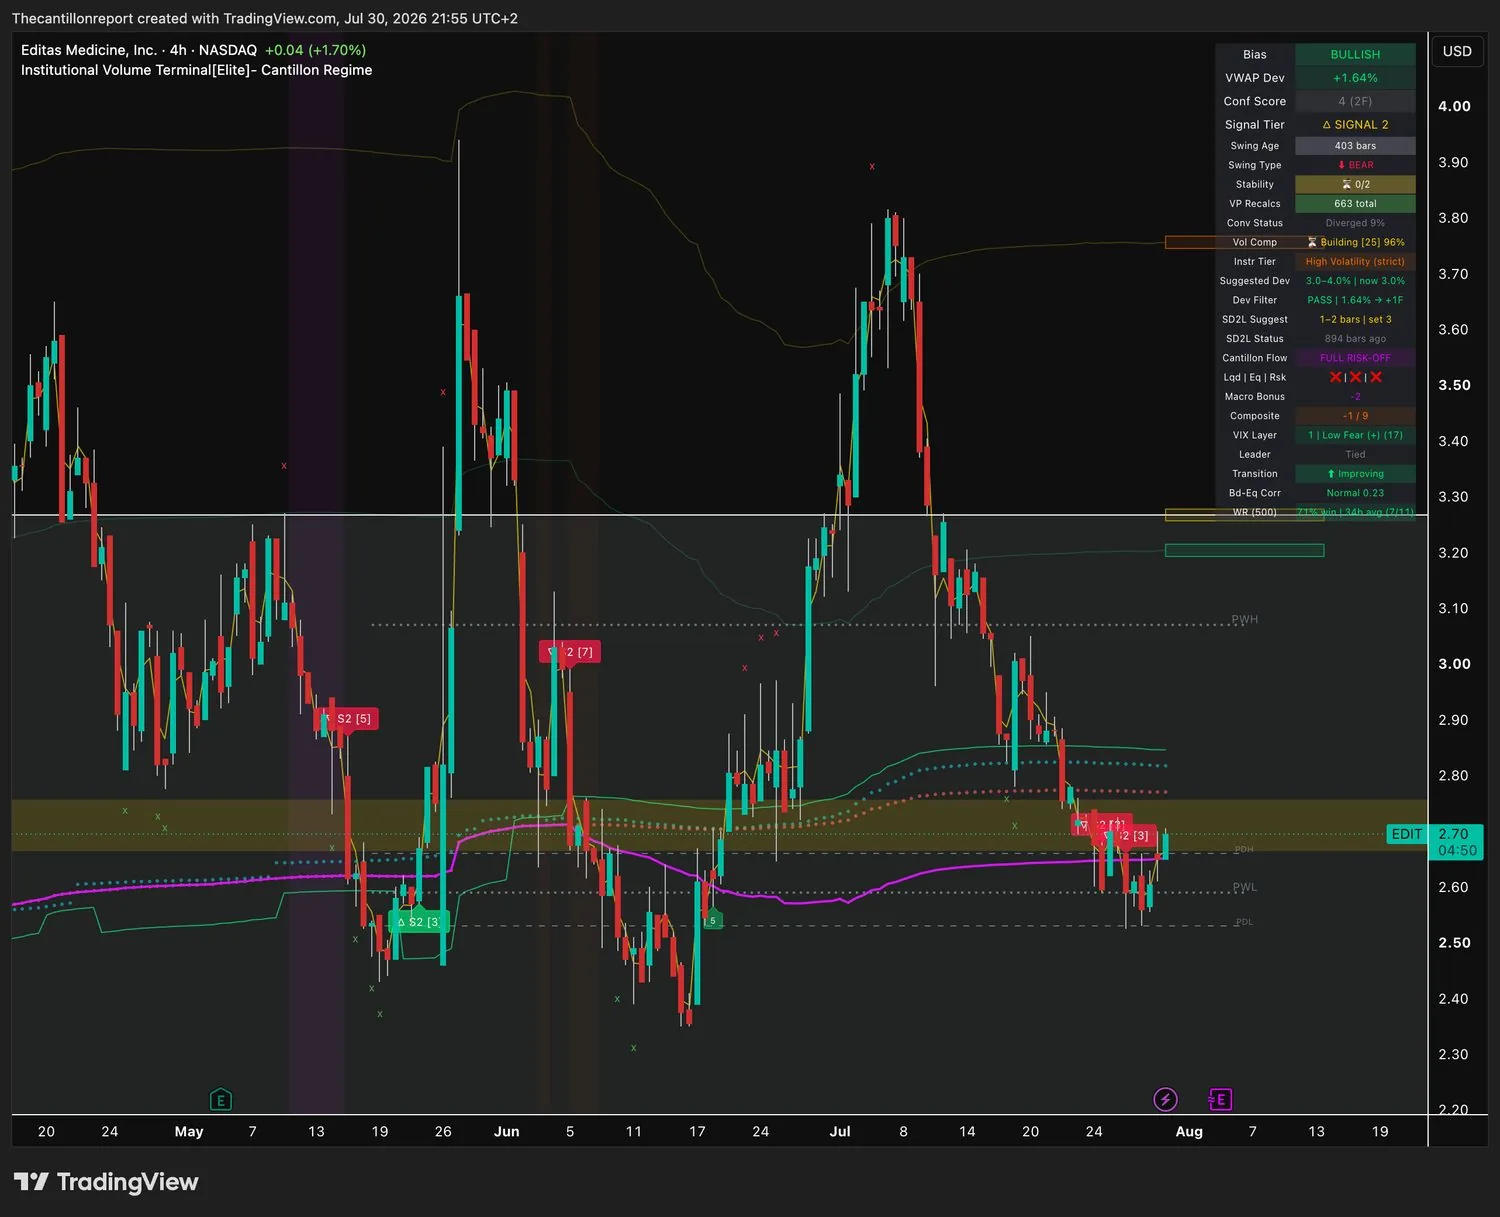
PASS +1.64% · $2.62–2.70
4h close > $2.78
4h close < $2.55
71% (7/11) · Conf 4 (2F) · Building 96% · Signal 2
High-Vol strict · micro-cap sizing only
5
SP500
Long
OPEN +1.38% · 7,380–7,420
4h close > 7,480
4h close < 7,340
94% (16/16) · Conf 1 (1F) · Expanded 26%
Equity-daily: half size into PCE
6
NVDA
Long
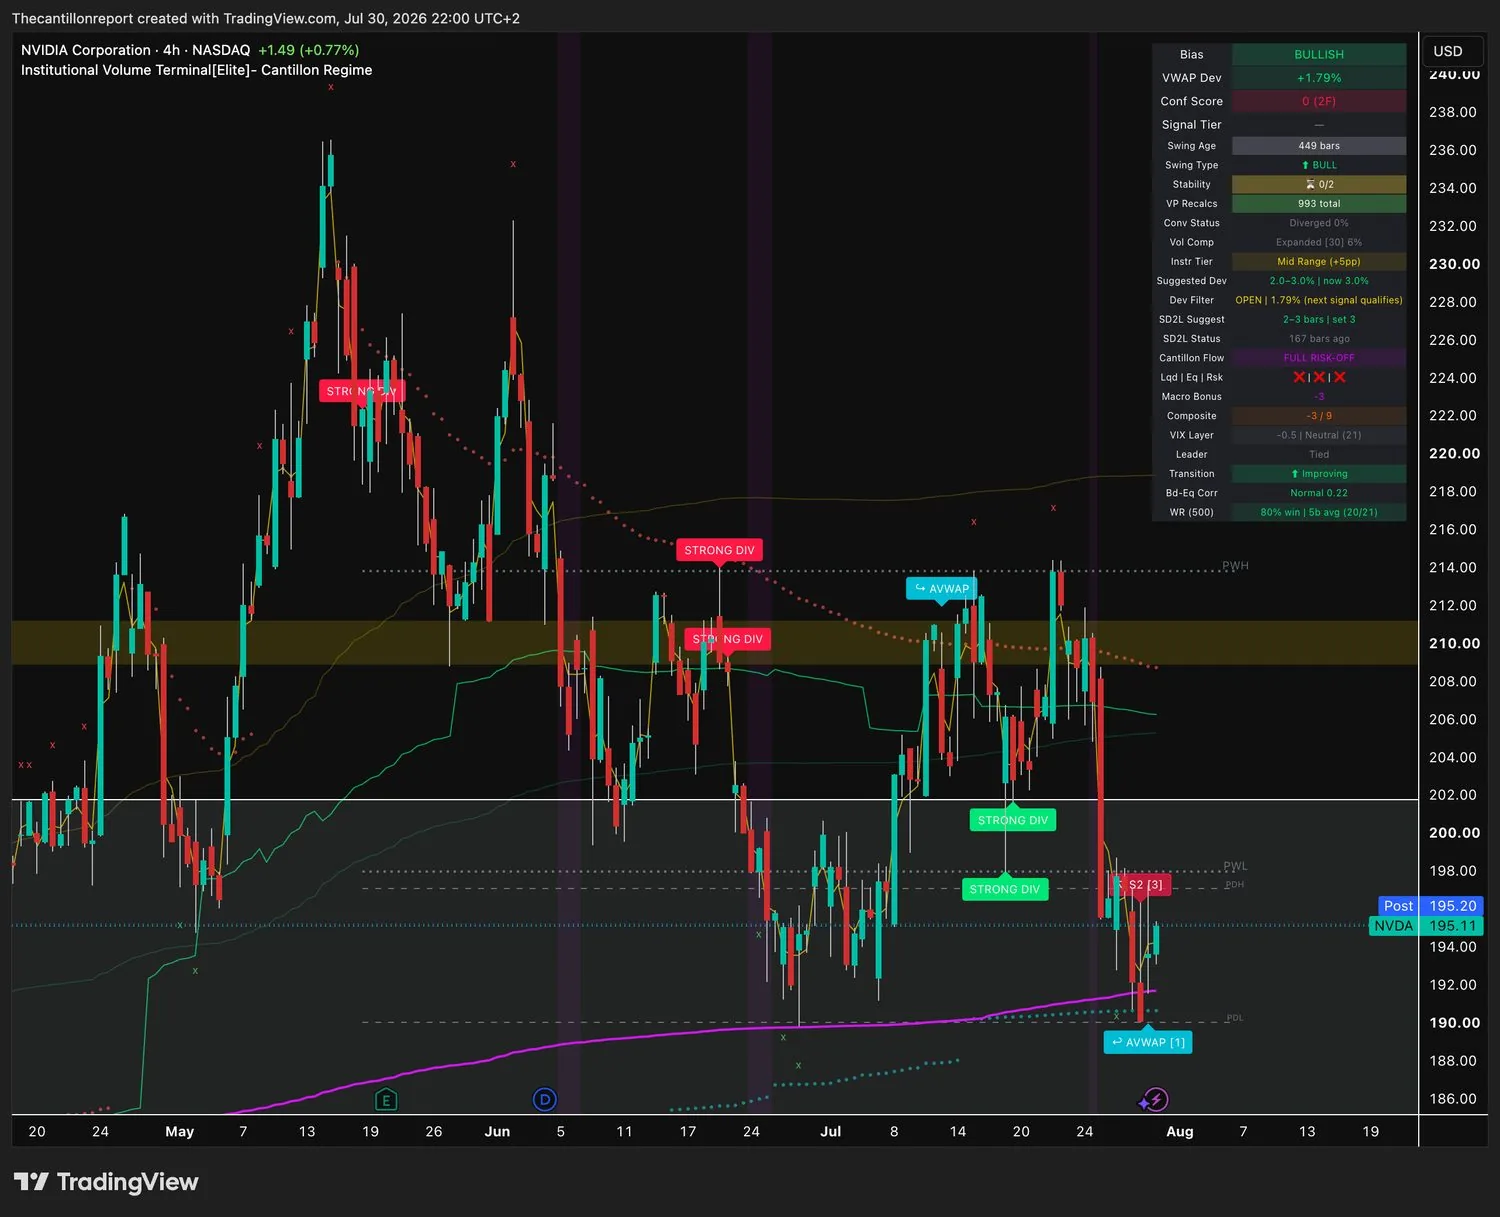
OPEN +1.79% · $191–193
4h close > $197
4h close < $189.50
80% (20/21) · Conf 0 (2F) · Expanded 6%
Mid-Range: half size
7
DE
Long
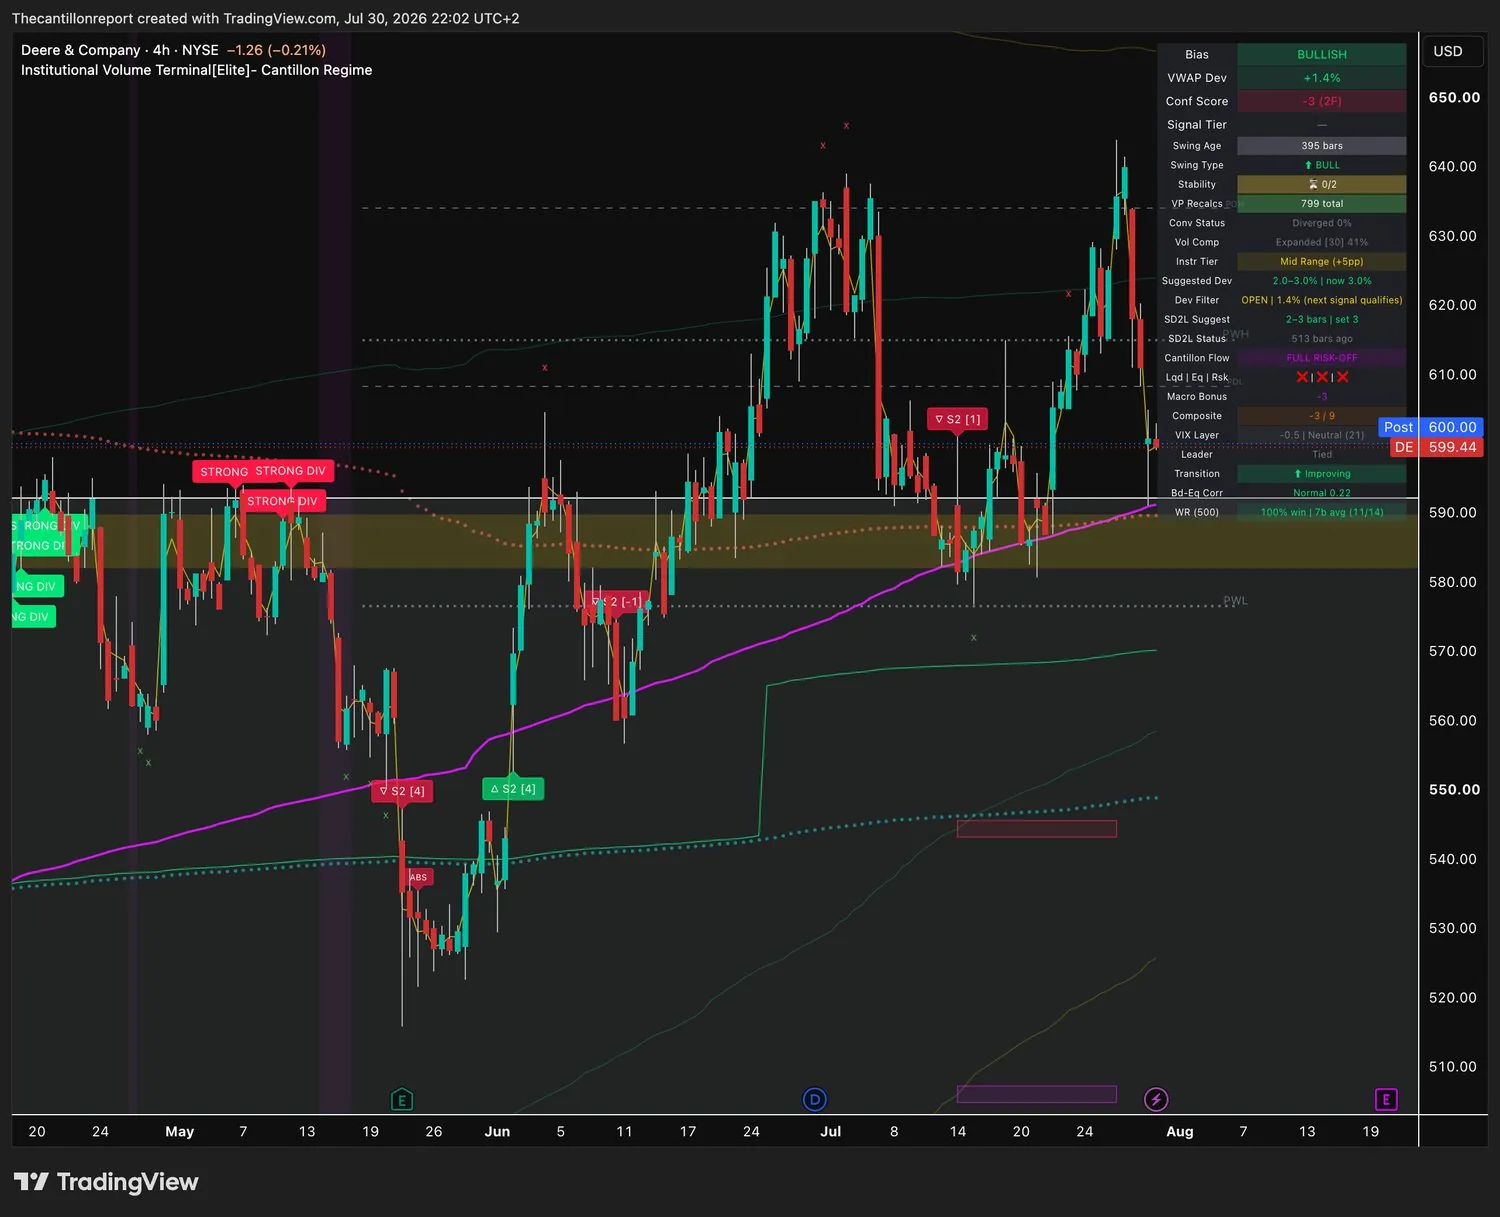
OPEN +1.40% · $591–595
4h close > $605
4h close < $584
100% (11/14) · Conf −3 (2F) · Expanded 41%
Quarter size or none
8
RUSSELL
Long
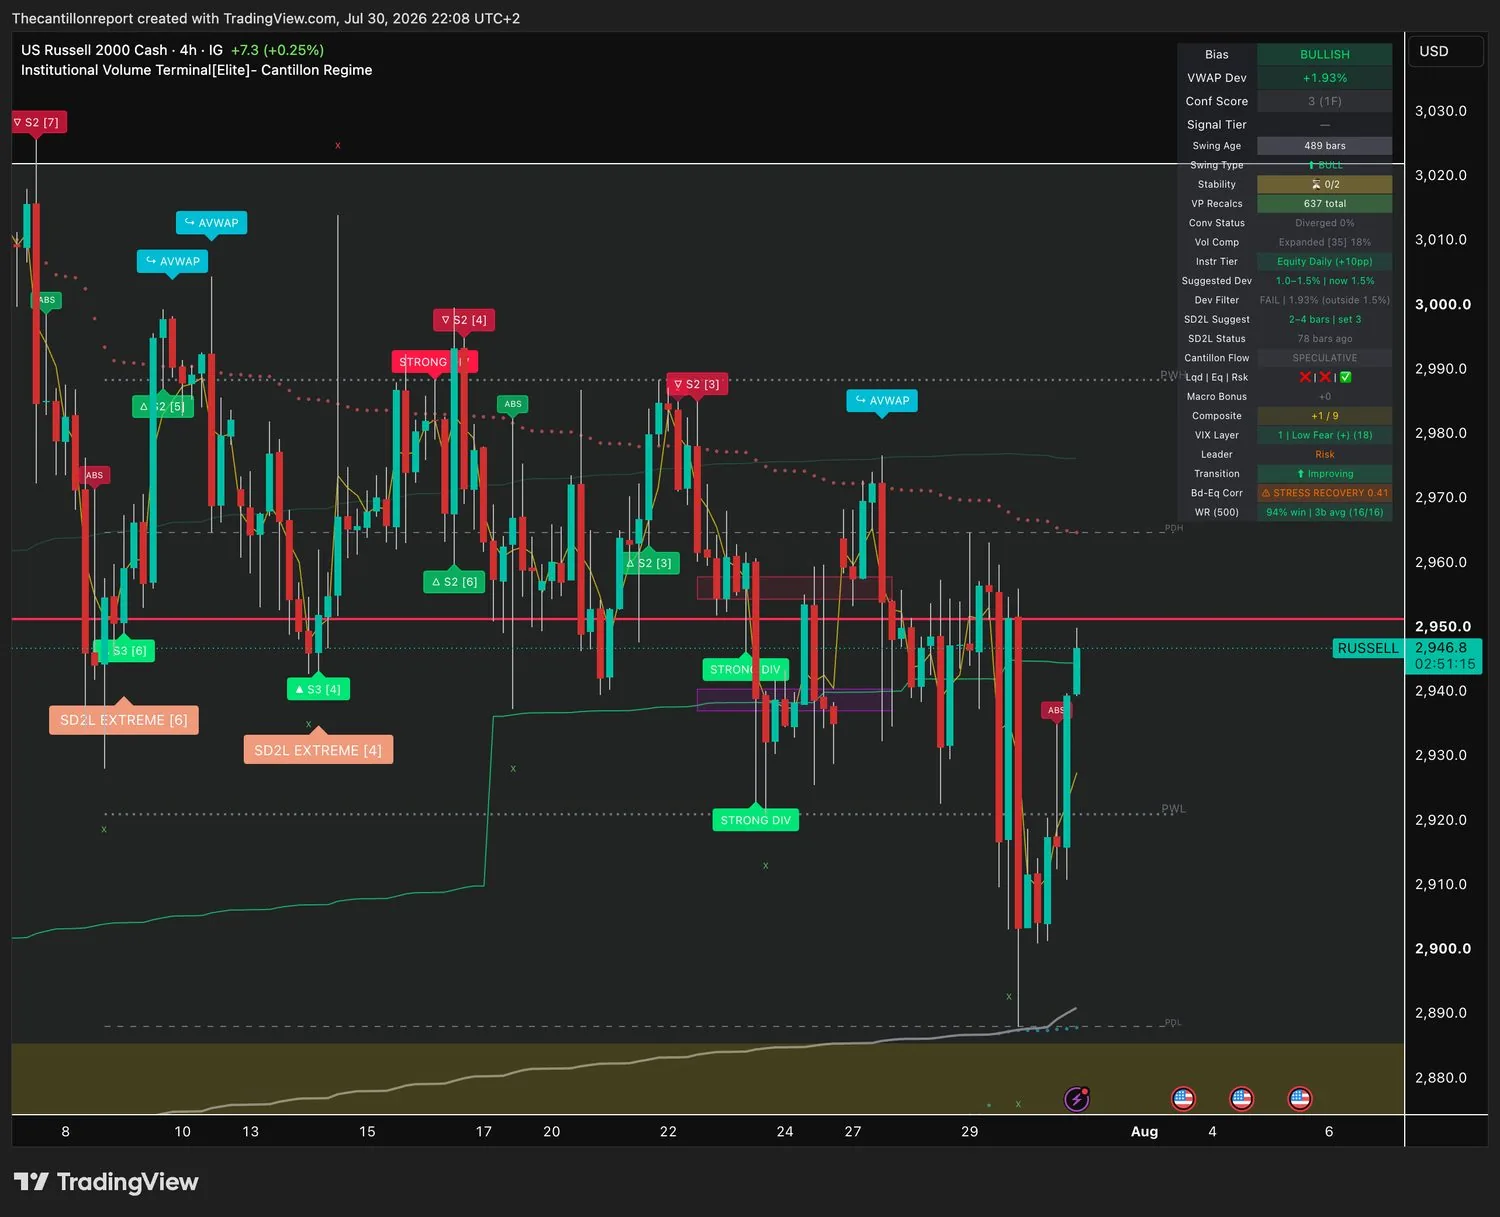
FAIL +1.93% vs 1.5% band
filter must reset first
4h close < 2,880
94% (16/16) · Conf 3 (1F) · Expanded 18%
None until the gate reopens
If you watch one: Rivian. Confidence 7 across three timeframes is the highest reading on tonight's sheet, it is the only name carrying both a COILED SPRING at 91% and active institutional convergence at 77%, its deviation filter reads PASS at less than a percent from the anchor, and twenty-two of twenty-five signals in its record have resolved at 82%. The event that made it untouchable for two sessions has now happened. The honest catch is that it reported eighteen hours ago, and post-print anchors take a session to re-form, so the trigger matters more here than on any other row.
$16.60–16.80, the institutional convergence band. Deviation reads PASS at +0.73% against a 3.0% suggested band, so price is sitting effectively on the anchor near $16.67. This is the tightest location available on a name that also has the best signal.
Trigger
A 4-hour close above $16.85, clearing the band top and the post-print high. Do not enter on location alone the session after an earnings release.
Invalidation
A 4-hour close below $16.15, beneath the prior-day low and the convergence band. That breaks the coil and the anchor reclaim in one move.
Edge
82% win rate across 22 resolved signals of 25 fired · 19-bar average hold · Conf 7 (3F), the highest on the board and recovered from 4 (2F) a session ago · SIGNAL 2 active · COILED SPRING at 91%, tightened from 89% · convergence ACTIVE 77%. Bias reads bullish and the multi-bar swing structure reads bull, so there is no direction conflict here.
Size
High Volatility tier, strict. Reduce 30% to 40% from your standard unit. With the macro bonus at zero the regime adds nothing, so the whole position case rests on the signal.
RIVN · 4h. Coiled spring at 91%, convergence band intact, price back on the anchor after the print.
$1,870–1,890. Deviation reads PASS at +0.68%, the tightest location anywhere on this sheet, with the anchor near $1,873.
Trigger
A 4-hour close above $1,900, clearing the prior-week high and the top of the value band. The coil has now held for three sessions without releasing, so the break is the entry, not the location.
Invalidation
A 4-hour close below $1,840. Below that the compression has resolved downward and the long is simply wrong.
Edge
71% win rate across 7 resolved signals of 7 fired, so the sample is complete · 34-bar average hold, the longest on the board · Conf 4 (2F), up from 3 · SIGNAL 2 active · COILED at 90%. The honest weakness: intraday bias reads bullish while the multi-bar swing structure still reads bear. That makes this a reversal attempt against the larger structure, which is why it needs the $1,900 close and not a dip buy.
Size
Mid Range tier. Standard size, on the trigger only.
MELI · 4h. Third session coiled at 90%, price on the anchor, swing structure still bear.
$1.44–1.48. Deviation reads PASS at +1.16% against a 3.0% band, anchor near $1.46.
Trigger
A 4-hour close above $1.50, clearing the prior-day high and the round number together.
Invalidation
A 4-hour close below $1.38, beneath the prior-day low.
Edge
95% win rate across 20 resolved signals of 20 fired. That is the best fully-settled record anywhere in this brief, with nothing left hanging · 19-bar average hold · Conf 2 across three timeframes · compression Building at 97%, effectively maximum · S1 tier. Against that: confidence is only 2, convergence reads Diverged at 39% so there is no institutional cluster underneath, and the multi-bar structure reads bear against a bullish intraday bias.
Size
High Volatility tier, strict, and a $1.48 share price. Micro-cap sizing only. The record is excellent and the liquidity is not.
PACB · 4h. Compression building at 97%, 20 of 20 signals resolved, convergence diverged.
The One Number
0.35 · the bond-equity correlation line.
Correlation reads 0.41 today, down from 0.52. Every improvement in this brief is provisional until it closes below 0.35. Under that line bonds hedge equities again, the accumulation bonus stops being neutralised, and a +1/9 Composite becomes a regime you can size into rather than one you have to trade around. Above it, today is a one-layer recovery carried entirely by risk assets, and every long on the board is unhedged by definition. Friday's PCE print lands directly on this number.
Watch / Avoid
Ticker
Dev
Reset zone
Why not
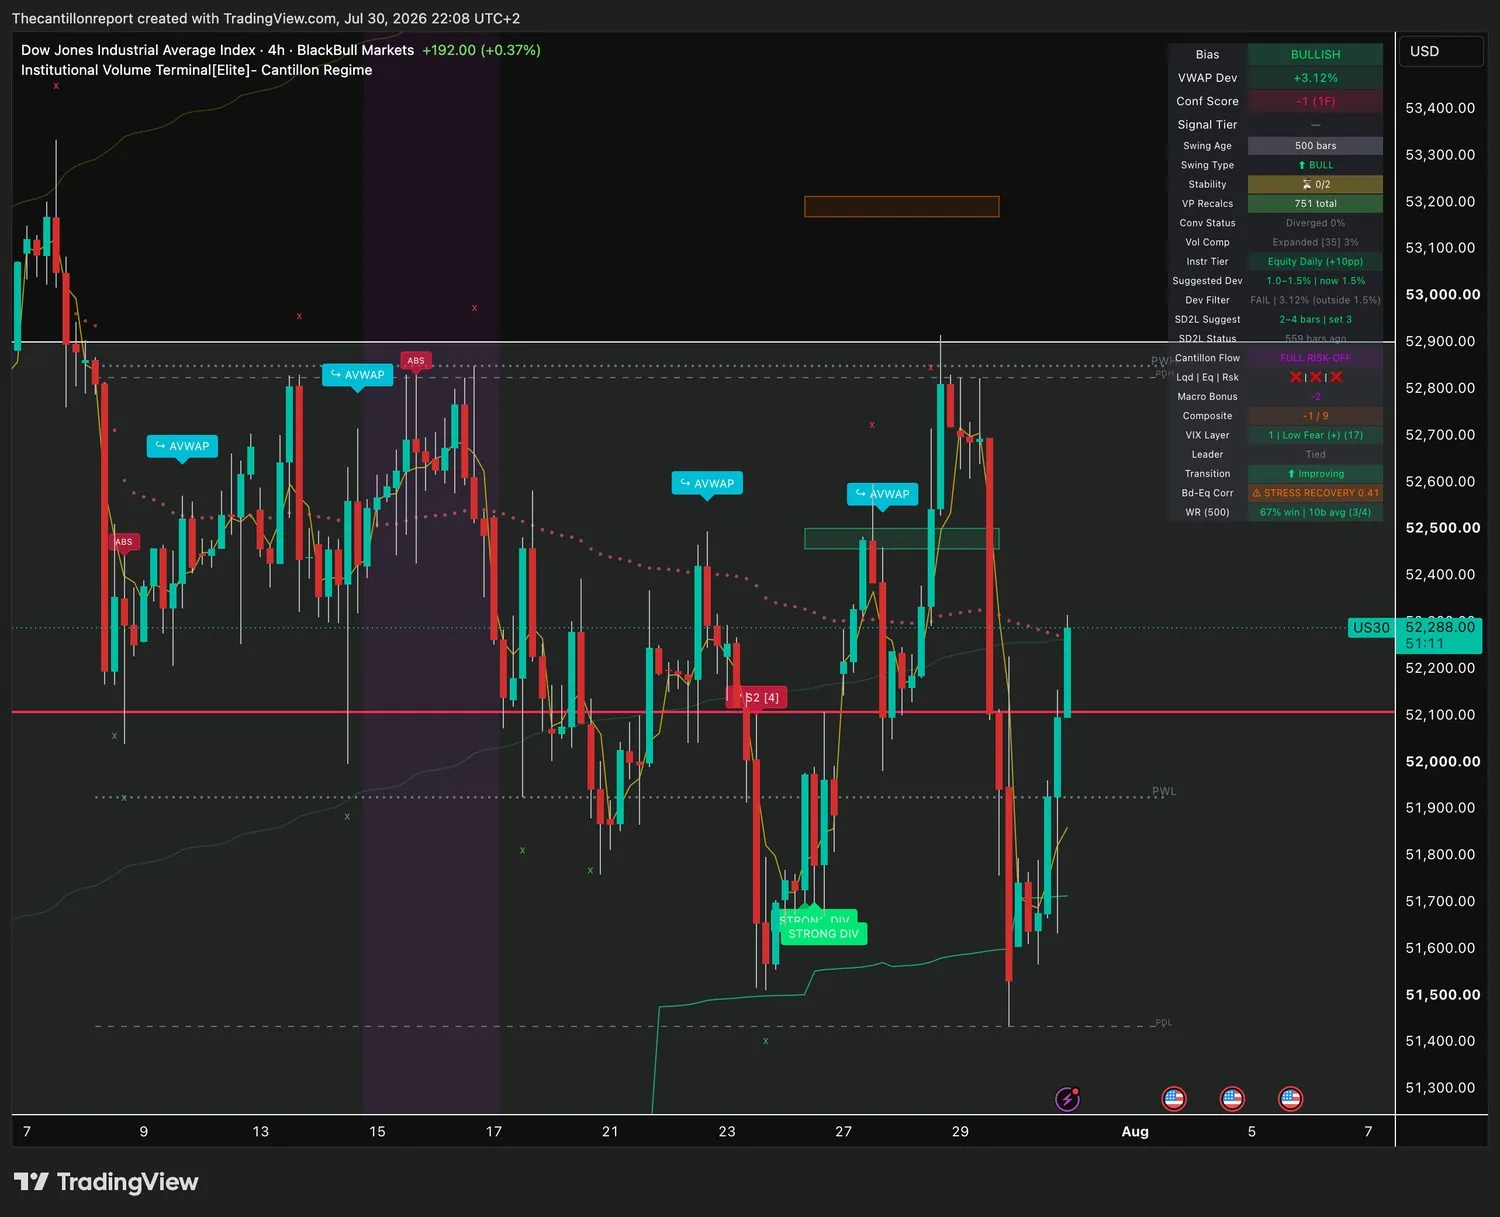
US30
FAIL +3.12%
~50,700–51,450
More than twice its 1.5% band. Conf −1 (1F). This feed also lags the others by a bar and still prints the old regime.
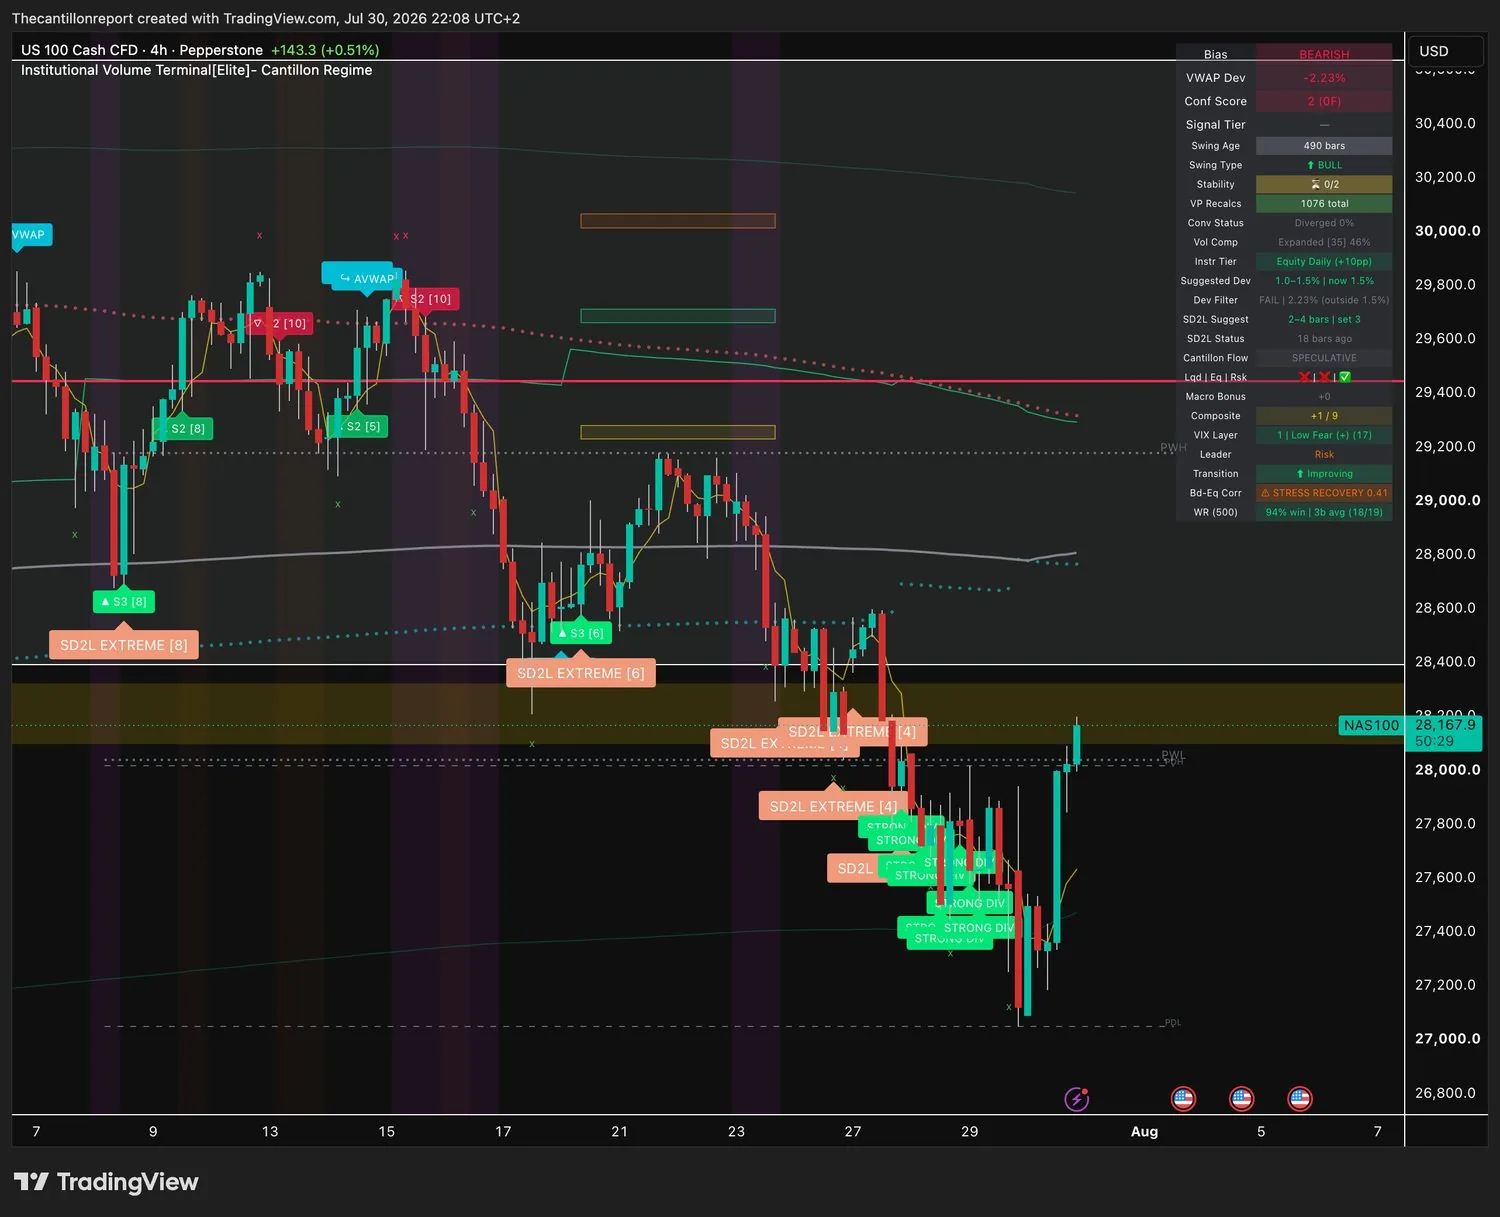
NAS100
FAIL −2.23%
~28,380–28,810
The only index with a bearish bias, and the most expanded compression on the sheet at 46%. Extended below the anchor, not above it.
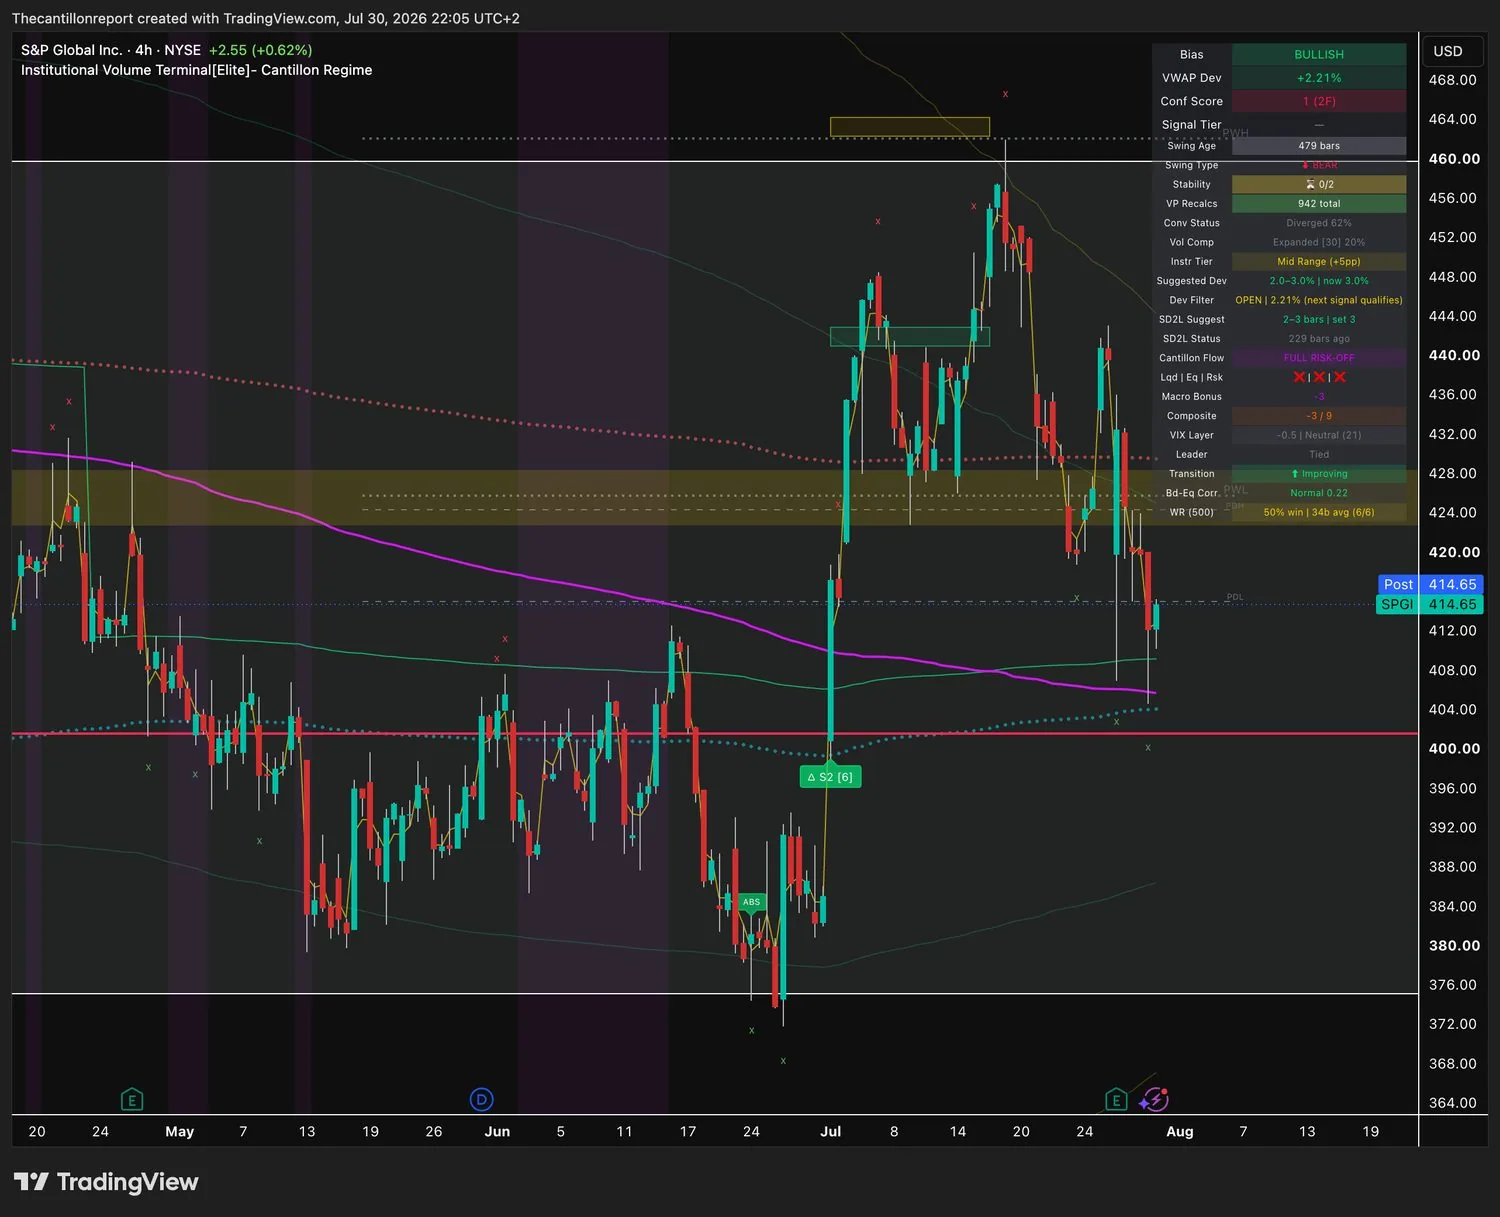
SPGI
OPEN +2.21%
n/a
Gate is open but the record is a coin flip: 50% on 6 of 6 resolved. Convergence Diverged 62%, swing structure bear. Nothing to lean on.
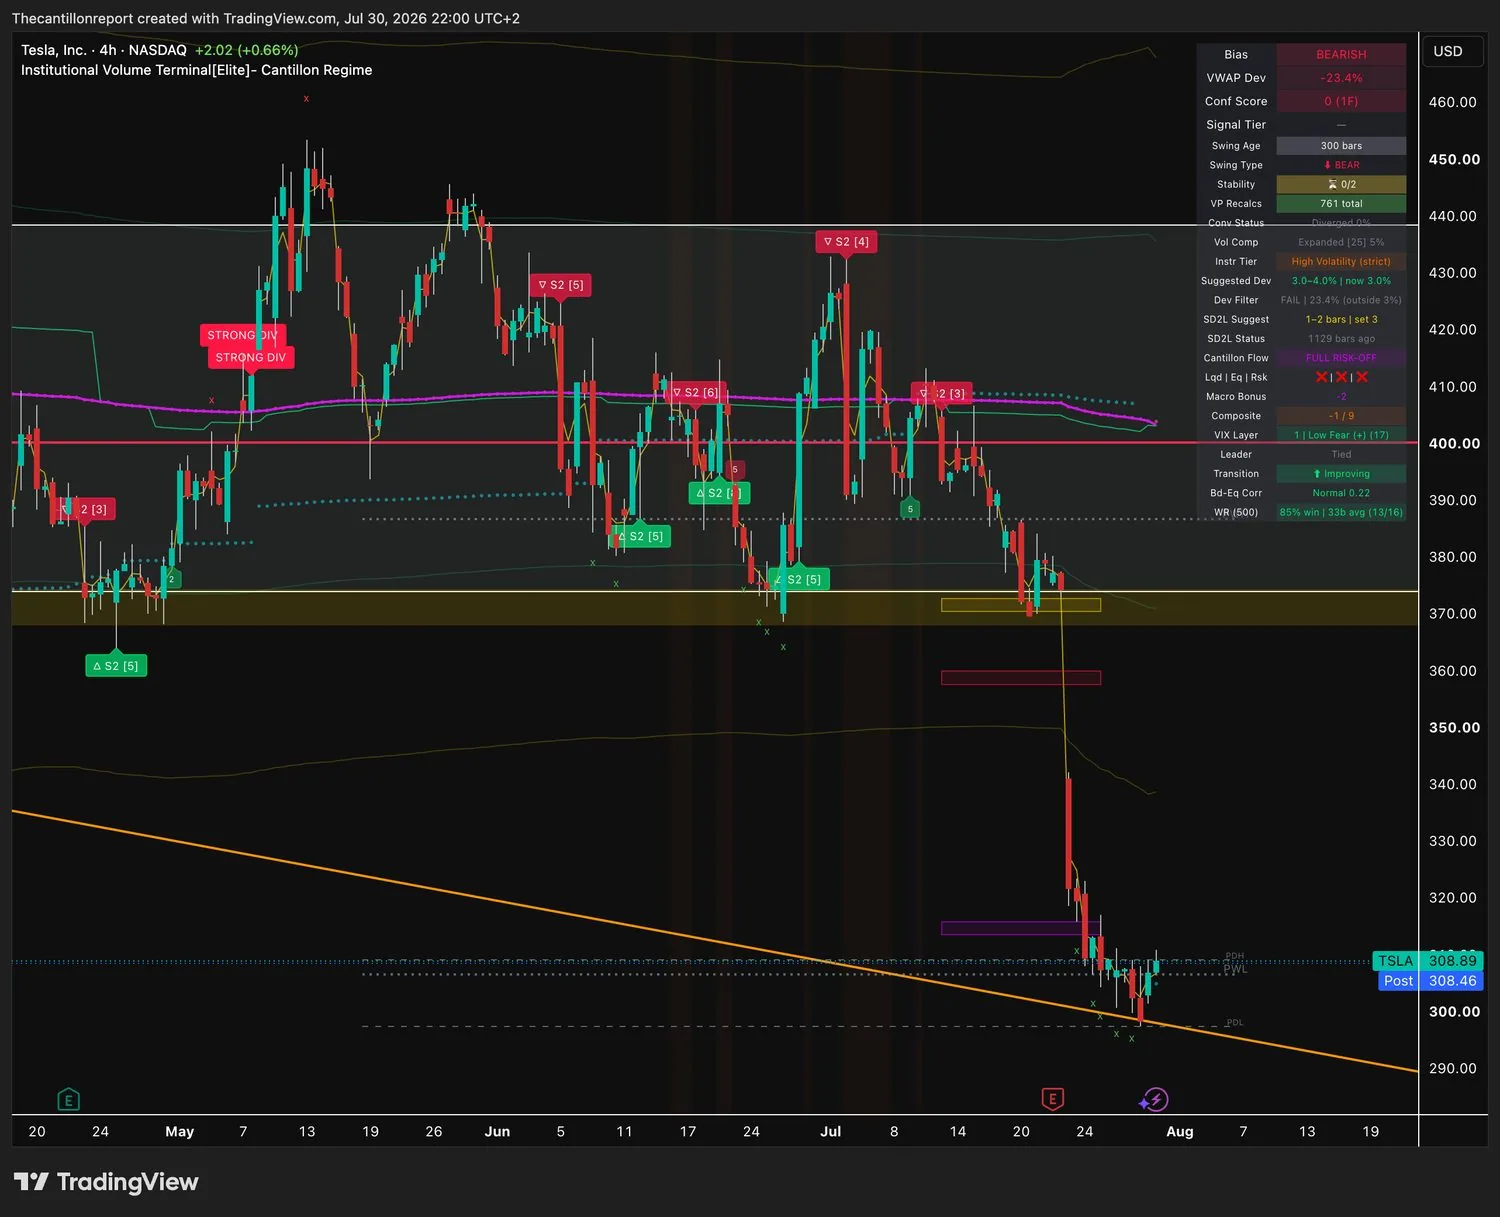
TSLA
FAIL −23.4%
~$390–403
Twenty-three percent below its anchor against a 3% band. Bearish bias, Conf 0. Not a setup at any size; the anchor is a different market.
The rule for today, stated once. A macro bonus of zero is permission, not encouragement. Longs no longer carry a regime penalty, so a good signal can be taken at its normal size. But nothing on this board gets a size bump, because there is no tailwind either. Two things still bind. Every entry needs its trigger, because four names have good location and the coil has not released on any of them. And with correlation at 0.41 a long equity book is still not hedged by a bond position, so total exposure should be smaller than eight rows on a board would suggest.
Yesterday's calls, scored. Two right, one wrong on timing. The instruction to stand aside on Rivian into its print held: it reported, it trades +2.69%, and its confidence has recovered from 4 (2F) to 7 (3F), so the re-entry available today is better than the pre-print entry would have been. The correlation call was right in direction, wrong in duration. The note said 0.52 removed the bond hedge, and it did, but it reversed to 0.41 in one session rather than holding. The call that was wrong is the regime read itself. Yesterday's brief described a −3 headwind as the frame for the session and the terminal flagged Transition as ↓ Deteriorating. Twenty-four hours later it reads ↑ Improving at +1/9. A seven-point Composite swing inside one session is the framework changing its mind faster than the brief allowed for, and the deterioration read gave no warning of it.
This one is free. The other four this week were not.
Every Friday edition is published in full: every level, every trigger, every invalidation, no gate. Monday through Thursday the Board goes to members. If today's format worked for you, the daily version is the same brief with the same discipline, four more times a week.
Includes the IVT Regime Playbook (PDF) · the 9 regime states and how to trade each one.
The Rest Of The Scan
EDIT · 4h. Dev PASS, building 96%, 4 of 11 signals still open.SP500 · 4h. Best complete record on the sheet, thinnest confidence.NVDA · 4h. Gate open, confidence zero. Location without conviction.DE · 4h. Perfect record, negative confidence. The framework arguing with itself.RUSSELL · 4h. Ran away from the gate it reset into yesterday.US30 · 4h. Twice its band. Dashboard here is one bar stale.NAS100 · 4h. The only bearish index bias on the board.SPGI · 4h. Open gate, 50% record, convergence diverged 62%.TSLA · 4h. 23.4% below anchor. Not a setup at any size.
Legend
Dev · percentage distance from the institutional VWAP anchor, the volume-weighted price institutions actually paid. Dev Filter · PASS means price is close enough to that anchor that an entry is priced well and the reading adds a confluence factor; OPEN means inside the band; FAIL means too extended for a clean new entry.
Conf (XF) · institutional confidence score confirmed across X timeframes. Higher is better; a negative score means the aggregate reading points against the setup.
COILED / Building % · volatility compression. Higher means a larger expected move when it releases. COILED is maximum; Building is partial. Neither states direction.
COILED SPRING · maximum compression with confirmed convergence, the framework's strongest pre-breakout structure.
Conv / Convergence · how tightly the multiple institutional anchors are stacked. ACTIVE with a high percentage means a real cluster of institutional cost basis; Diverged means no cluster underneath.
WR (n/m) · win rate across m signals that have fully resolved out of those fired. Open signals are excluded, which is why n/m matters as much as the percentage.
Signal tiers · S1 is the base crossover; SIGNAL 2 adds two independent confirming factors; S3 adds four; S4 adds six plus regime alignment.
SD2L · oversold snapback signal fired two standard deviations below the anchor.
Composite · the sum of the nine active Cantillon layers, maximum +9. Macro bonus · the regime's tailwind or headwind applied to every trade. Bd-Eq Corr · 60-bar rolling correlation of bond and equity returns; above 0.35 the two are treated as one risk and bonds stop hedging equities.
Tiers · High-Volatility strict (size down 30% to 40%), Mid-Range (+5pp band), Equity-daily (+10pp band).
Readings captured Thursday 30 July 2026 between 21:55 and 22:08 CEST from the IVT v13.3 terminal, and published as the Friday 31 July free edition. Timeframes are 4-hour throughout. The regime changed during the capture window; the index charts carry the current regime reading and the single-name charts carry a stale one, as flagged above. Index readings come from cash CFD and futures feeds and will differ from your own cash index or futures contract, so convert and re-check every index level before acting. Institutional anchor prices are derived from the terminal's deviation percentage rather than read directly and are approximate. Rivian reported after Thursday's close and its anchors have not fully re-formed around the new price. June PCE is released 31 July at 8:30am Eastern and will move every index level in this brief. Several names show intraday Bias disagreeing with the underlying multi-bar Swing structure; verify the higher-timeframe trend on your own screen before acting on any level here. Charts are unmodified terminal captures and are provided for reference, not as entry instructions. This brief is for informational and educational purposes only. Not financial advice. Past win rates do not guarantee future results.