Fourteen Charts, Two Green Lights.
The two setups the terminal is shouting about this morning, Astera Labs at the only signal tier on the page and Sui at 96% convergence, both carry no permission to trade them. The two you can actually size are a Canadian telco and Toyota. And the number that decides the session is 291.05, which is where Astera's entry window shuts. It opens 0.70 underneath.
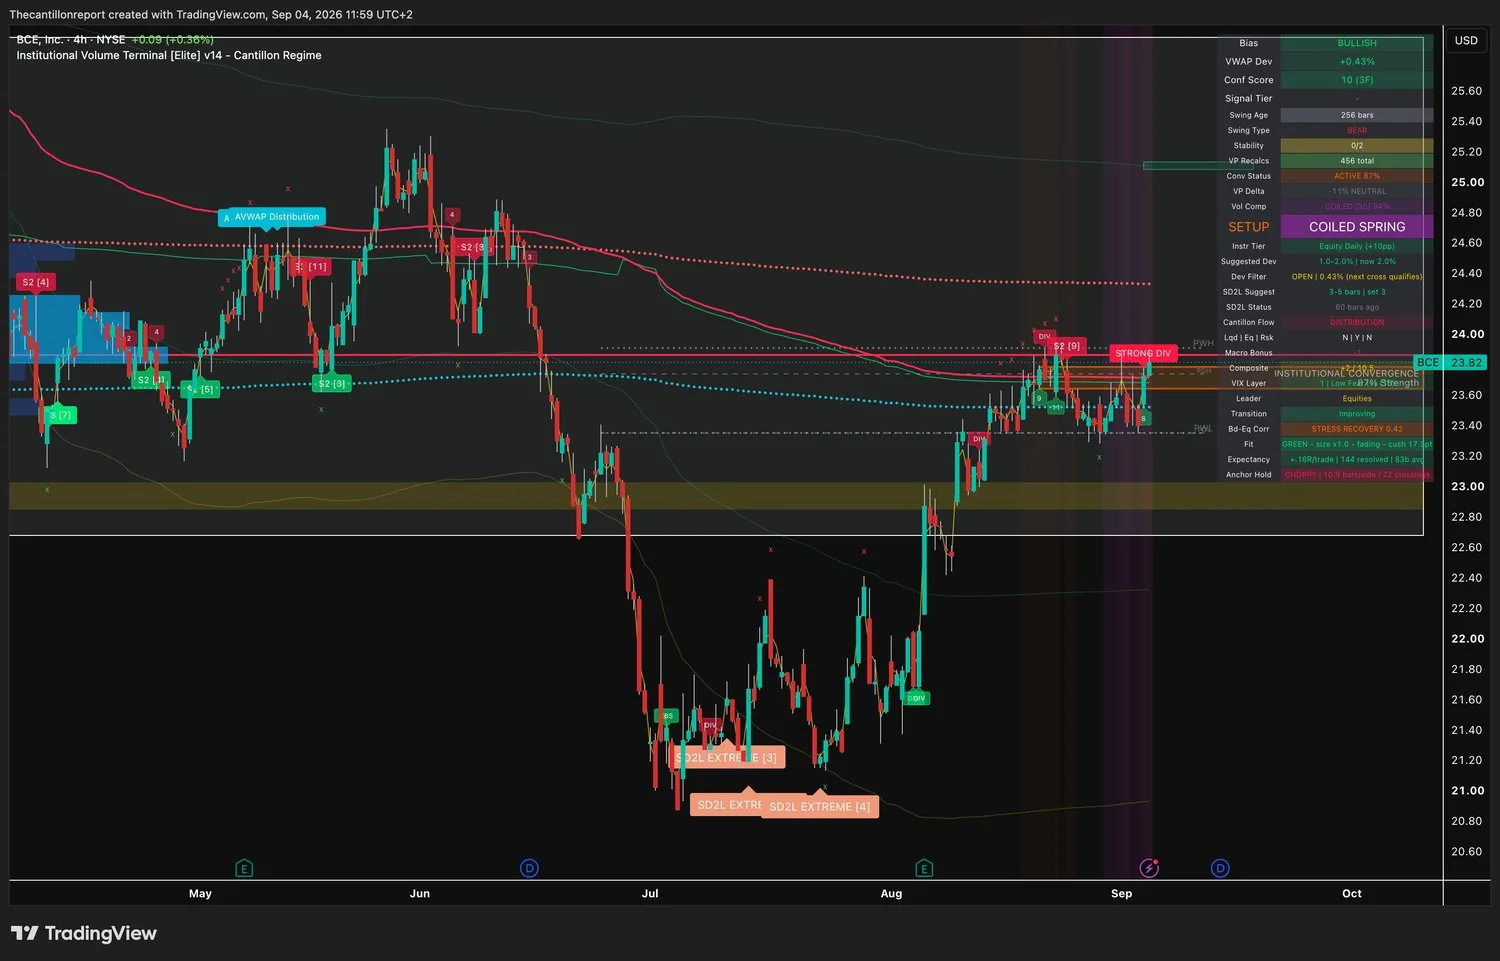
- BuyBCE (BCE), full size. Ten readings across three timeframes is the highest confirmation in the scan and it beats the next chart by two. It is the only instrument the terminal has labelled a coiled spring today, the cost lines underneath are clustered at 87%, and it sits 0.43% above them at 23.82. Green light, deepest record on the page across 144 finished signals.
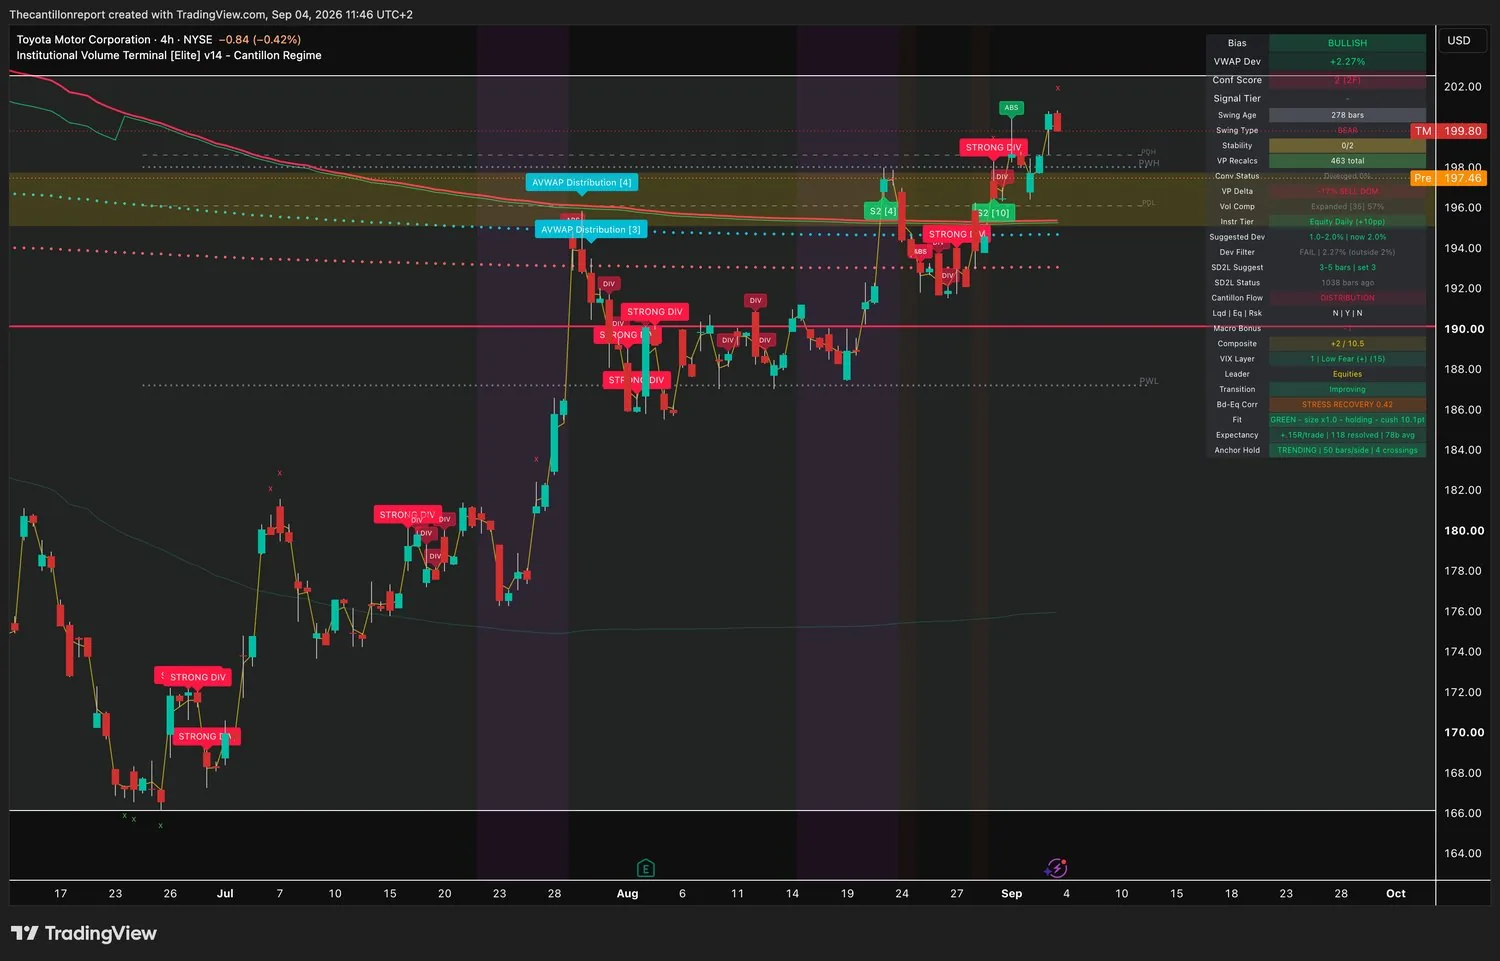
- BuyToyota (TM), half size. It closed too extended to enter, 2.27% over cost. The pre-market print at 197.46 puts it back inside the window at an implied 1.07%. Half rather than full because the volume at the most-traded price runs 17% against the direction.
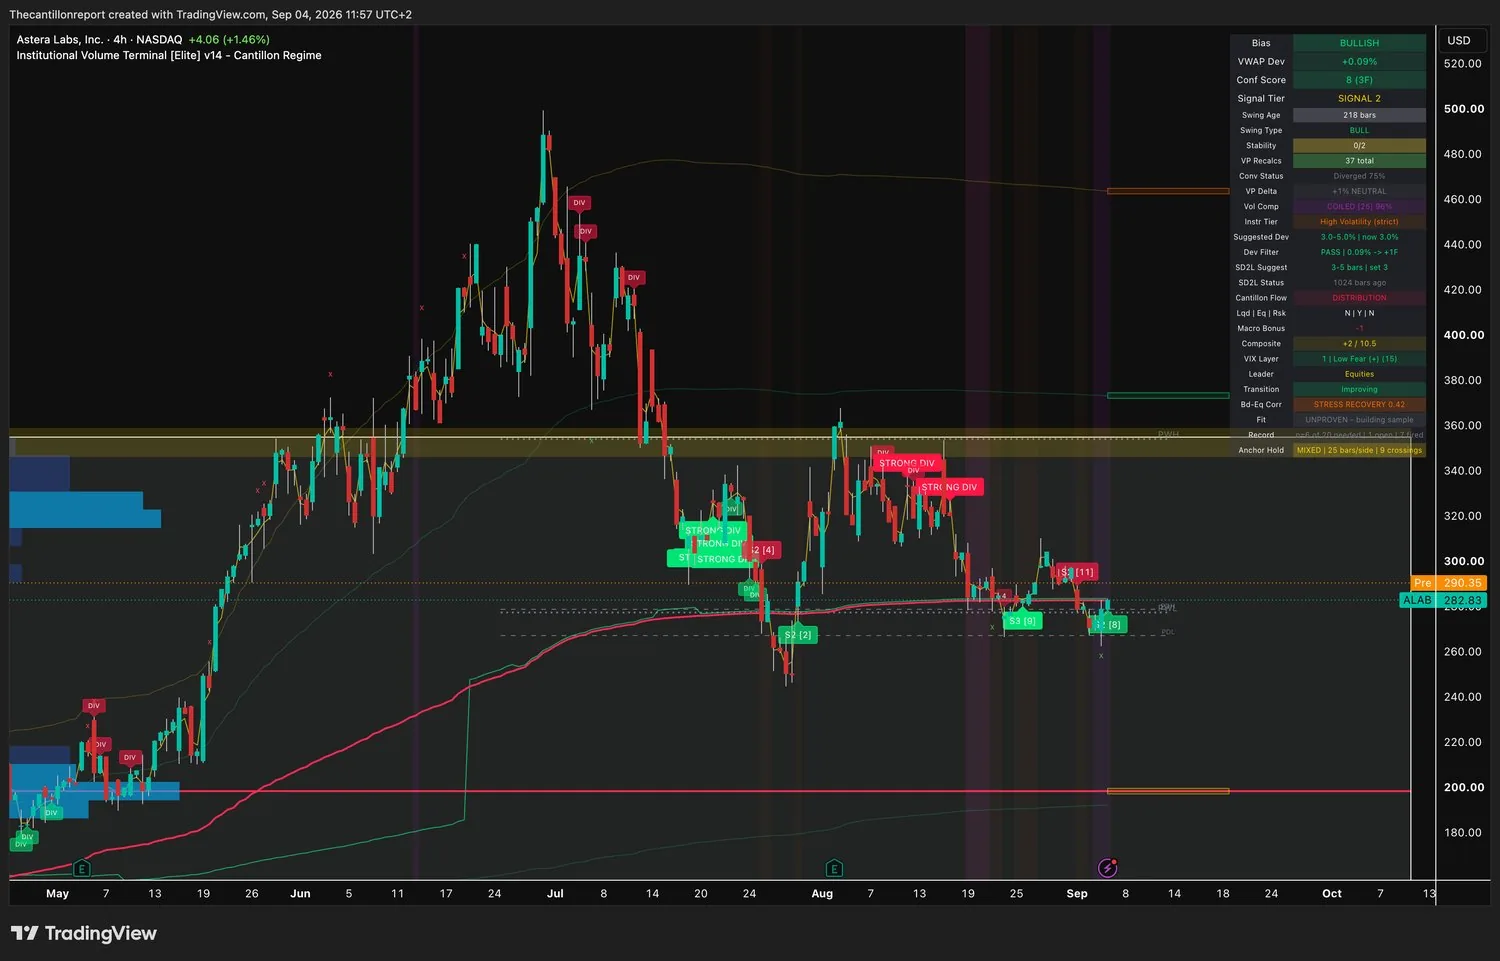
- WatchAstera Labs (ALAB). Coiled to 96%, eight readings across three timeframes, and the only signal tier awarded anywhere in the brief. It has no record: six finished signals of the twenty required. Nothing publishable, so nothing to size. Watch where it opens against its window ceiling, which is The One Number below.
- AvoidSui (SUI) and Comcast (CMCSA). The best convergence on the page at 96% and the only maximum compression reading at 100%. Both on red lights, Sui at −.11R over 60 signals and Comcast at −.01R over 131. Loud charts, no permission.
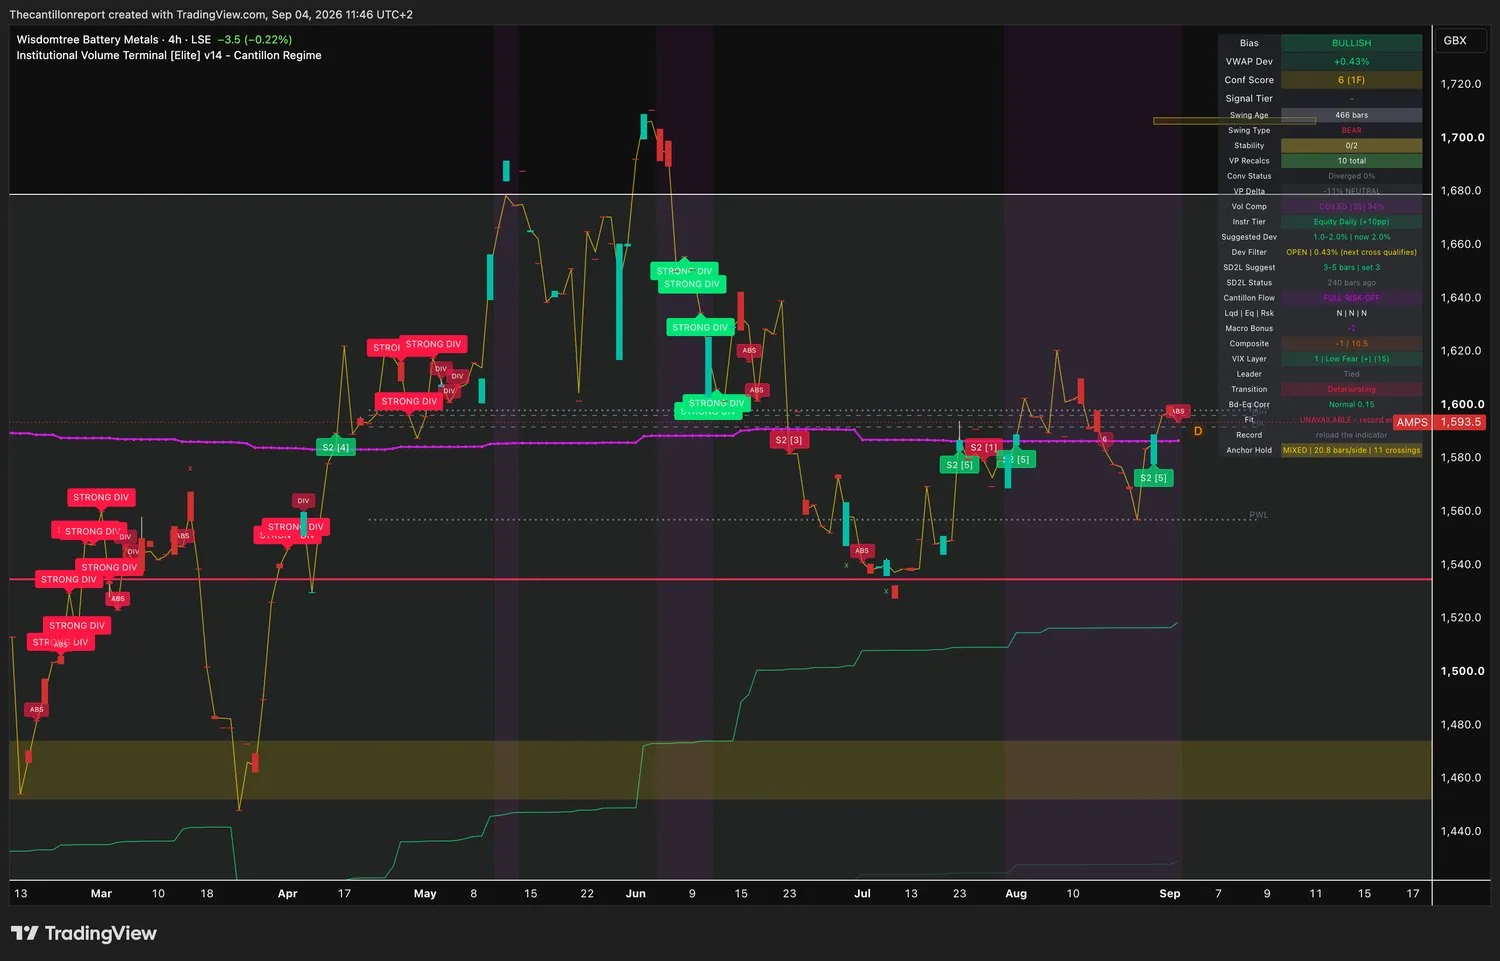
- NoteTwo record fields are broken. SpaceX and WisdomTree Battery Metals both return a terminal fault instead of a record. Those rows keep their compression and confirmation readings and carry no size. Reload the indicator before trusting either.
The August employment report lands at 08:30 Eastern, and what makes it unusual is which way the risk points. Consensus is roughly +55,000 after July came in at −23,000, with unemployment expected to hold at 4.1%. The Fed's target range is 3.50 to 3.75% and the argument at the September meeting is not about a cut. It is about a hike. Christopher Waller moved that argument on Thursday by saying he would support holding rates if progress toward 2% continues, and would consider hiking if inflation runs hot. Hike odds fell from around two thirds to a coin flip, and equities had their best session in a month on it: the Dow up 1.18% to 53,686.11, the S&P up 1.06% to 7,747.71, the Nasdaq Composite up 1.40% to 26,584.06. Futures went into this morning flat. So a weak print does not simply buy a dovish Fed today, and a strong one does not simply delay a cut. Both tails are live.
- Bitcoin took 81,000 Up about 4.6% in twenty-four hours to a multi-month high, with Ethereum near 2,501 and the whole crypto market cap at 2.74 trillion. The risk leg of the framework still reads off, which is the disagreement worth watching over the weekend rather than resolving this morning.
- Lululemon lost a fifth of itself Down roughly 18% before the open on cut revenue and profit guidance. A consumer name giving back that much on the same morning as a payrolls print is the sort of thing that makes a soft jobs number read worse than it is.
The cycle score is +2 of 10.5 with the bond leg and the risk leg both off, so a long on this page earns half the size the same chart would have earned yesterday, and nothing here is sized off the regime itself. Read the four index charts further down against that number before you trust either: they were captured seventeen minutes earlier and they print +6 of 10.5 with the risk leg on. The engine downgraded between 11:44 and 11:46 CEST, the macro tailwind went from +1 to −1, and every single-name panel after 11:46 reads the lower number. This brief uses the later reading throughout.
The breadth strip runs when it argues with the regime, and this morning it argues hard. The cycle score fell by four points while participation improved. These are last night's closing figures across our own scan universe, not the S&P 500, so read them as a description of who is taking part rather than as a market call.
| Reading | Cantillon universe | What it says |
|---|---|---|
| Advancing versus declining | +20 net, 47 advancing | More names up than down, at a ratio of 1.74 to 1 |
| Cumulative advance-decline line | +1,086 | Still building rather than rolling over |
| McClellan oscillator | +13.9 | Positive, so short-horizon participation is expanding |
| Summation index | +11,669 | The structural version of the same, and it is rising |
| Above the 50-day line | 63.5% | Healthy, and off its August highs |
| Above the 200-day line | 71.6% | The structural reading, and the strongest number here |
The terminal's own banner on this strip reads breadth recovery, breadth improving against price. That is the honest counterweight to a +2 cycle score, and it is why the two green lights below are worth taking at all rather than sitting the day out. It reopens no shut window and it turns no red light green.
Every reading in this brief was taken off a four-hour bar that had not closed, and seven of the fourteen charts carry the terminal's own pre-market print alongside it. Those two prices are not the same trade. A gap moves price away from the cost line before you can act on it, and on four names this morning it moves the window with it. The implied column is arithmetic on the terminal's last price and its published deviation, not a field the terminal prints.
| Name | Close · deviation | Pre-market · implied | What it does to the window |
|---|---|---|---|
| TM | 199.80 · +2.27% over | 197.46 · +1.07% | Opens it. Shut on the close at 2.27% against a 2.0% band. The gap down puts it back inside and is the only reason Toyota carries a size today. |
| STM | 51.27 · +2.64% over | 52.36 · +4.82% | Shuts it. Open on the close inside a 3.0% band, outside it after the gap. Compression is building at 96% and you still cannot enter. |
| SPCX | 149.66 · −0.32% under | 150.80 · +0.44% over | Kills it. The short was priced under the cost line. The gap puts price above it, which is the invalidation, before the session starts. |
| ALAB | 282.83 · +0.09% over | 290.35 · +2.75% | Holds it, barely. The gap spends nine tenths of a 3.0% band in one print and leaves 0.70 of room. See The One Number. |
| DNN | 3.41 · +0.18% over | 3.47 · +1.94% | Holds it. Still inside a 3.0% band with a fresh bullish divergence printed at the right edge, on a flat record over 110 signals. |
| CMCSA | 26.66 · +1.49% over | 26.69 · +1.60% | No change. Three cents. The 100% coil and the red light are both exactly where they were. |
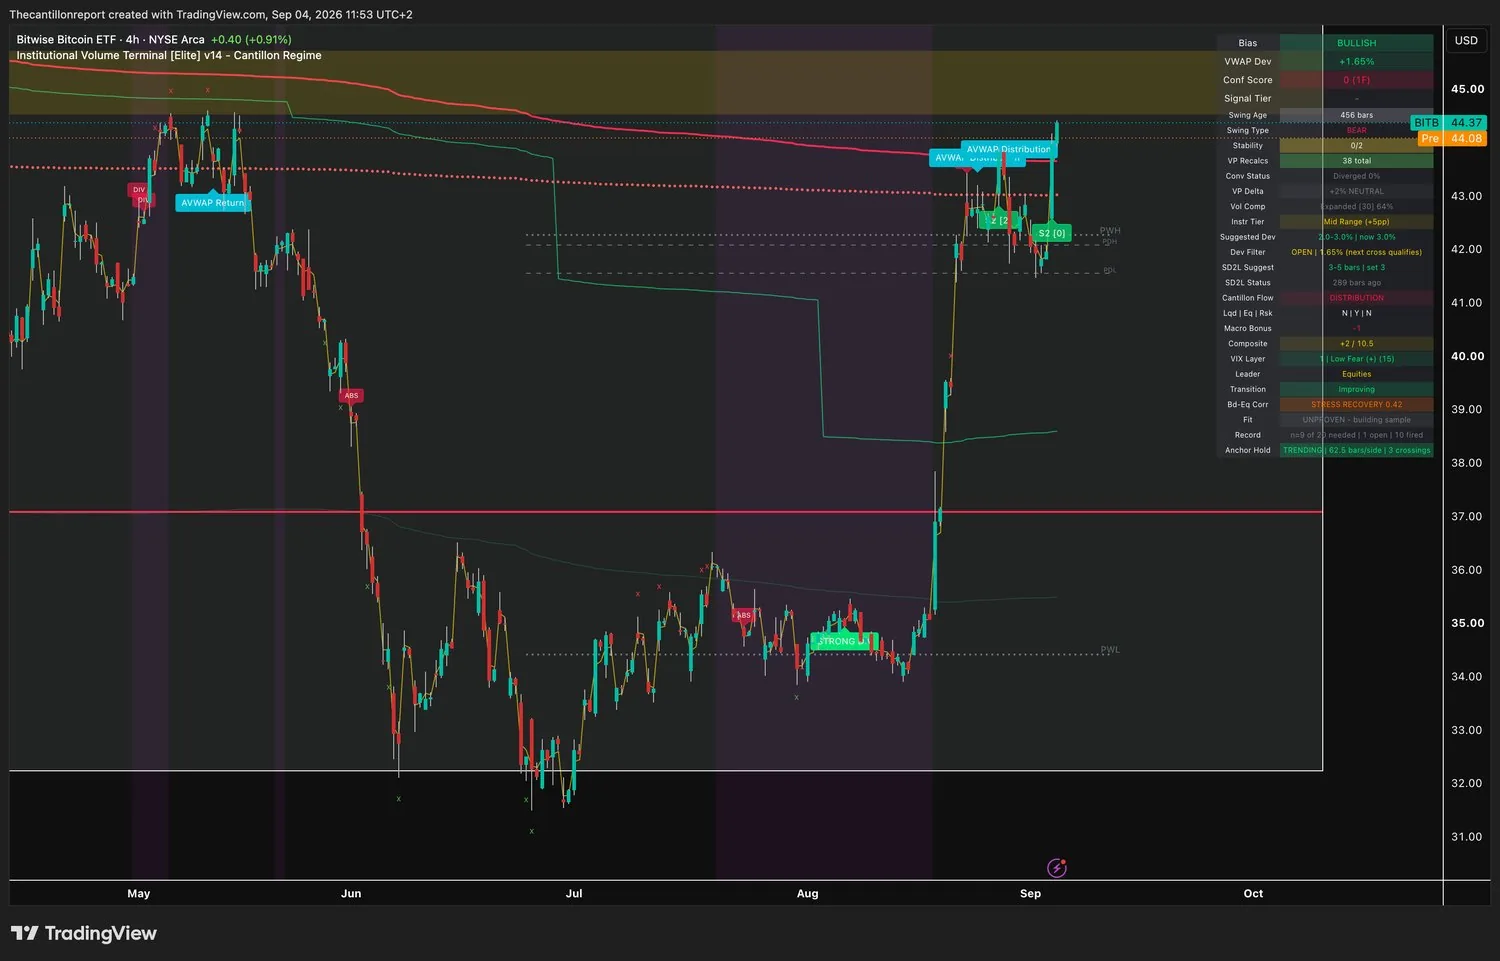
| BITB | 44.37 · +1.65% over | 44.08 · +0.99% | Improves it. Closer to cost than it closed, on the lowest confirmation in the scan at zero. |
Two windows opened, two shut, and none of it was visible in last night's readings. Check the gap against the band before you act on any row below.
Six instruments have a live window and a side. Two of them carry a size. Every trigger is a four-hour close in the trade's direction and never a touch, and the get-out is always a close back through the cost line. The other eight instruments are in the Watch and Avoid table further down, and four of those are the indices.
| # | Name | Side | Entry · trigger · get out | Why it is on this list | Size |
|---|---|---|---|---|---|
| 1 | BCE BCE Inc | Long | +0.43% · $23.82 window $23.72–$24.19 trigger $23.95 · out $23.72 |
Ten readings across three timeframes is the highest confirmation in fourteen charts and it beats the next by two. It is the only coiled spring the terminal has labelled today, wound to 94%, with the separate institutional cost lines clustered at 87%. Its last snapback reset was 60 bars ago, third freshest here, and the two fresher ones carry no size. Confirmation 10 across 3 timeframes · compression coiled at 94% · convergence active at 87% · record +.16R on 144 signals · light green, fading, 17.3-point cushion · crosses its own line every 11 bars | Full |
| 2 | TM Toyota Motor | Long | +1.07% implied · $197.46 pre window $195.37–$199.27 trigger $198.20 · out $195.37 |
The only other green light on the page, on the second deepest record here, and the trend direction is improving rather than fading. It closed outside its window and the gap handed it back. The reason this is a half and not a full sits in the volume: sellers run the most-traded price by 17% against a long reading. Record +.15R on 118 signals · light green, size x1.0, holding, 10.1-point cushion · confirmation 2 across 2 timeframes · compression expanded at 57% · buyers and sellers at −17%, sell dominant | Half |
| 3 | ALAB Astera Labs | Long | Qualified · $290.35 pre cost line $282.58 out $282.58, a close back under it |
The loudest chart in the brief and the only one carrying a signal tier, awarded when the entry cross, the confirmation and the window all line up at once. Coiled to 96%, eight across three timeframes, and it already crossed inside its window on the close. Then it gapped 2.66% and spent most of the room it had. Signal tier 2, the only one in the scan · confirmation 8 across 3 timeframes · compression coiled at 96% · cost lines diverged 75% · record 6 of the 20 signals needed, 1 open, 7 fired · no light, sample still building | None |
| 4 | SUI Sui perpetual | Long | +0.47% · 0.7760 window 0.7724–0.7955 trigger 0.7800 · out 0.7724 |
Best convergence reading anywhere in the scan at 96%, meaning several cohorts of large money paid almost exactly the same price, and it is sitting half a percent above that price with the cross already qualified. The record is the problem and it is not close: worst on the page. Confirmation 8 across 3 timeframes · convergence active at 96% · compression expanded at 35% · record −.11R on 60 signals · light red, improving, −11.9-point cushion · bonds versus stocks at stress recovery 0.5 | None |
| 5 | CMCSA Comcast | Long | +1.60% implied · $26.69 pre window $26.27–$27.06 trigger $26.80 · out $26.27 |
The only instrument in the brief at maximum compression, 100 out of 100, with a snapback reset 59 bars old. Five readings across a single timeframe is thin support for that, and the record over 131 signals is a coin flip once you pay commission. The cushion has already gone negative. Compression coiled at 100% · confirmation 5 across 1 timeframe · cost lines diverged 34% · record −.01R on 131 signals · light red, holding, −0.9-point cushion · buyers and sellers at −8% | None |
| 6 | SPCX Space Exploration Technologies | Short | Invalidated pre-open · $150.80 pre was 149.66, cost line 150.14 out $150.14, already through |
Six across two timeframes, coiled to 93%, and the freshest snapback reset in the whole brief at 56 bars. It reads short and the price is now above the line the short was measured from, so the get-out has printed before the open. The record field returns a fault rather than a number, so there was never a size here anyway. Confirmation 6 across 2 timeframes · compression coiled at 93% · snapback reset 56 bars ago, freshest on the page · record unavailable, terminal fault · anchor still building, needs 250 bars | None |
Large money paid 282.58 for Astera Labs across the current swing. It is a high-volatility instrument, so the terminal allows a new entry up to 3.0% above that, which is this price. The chart closed at 282.83, nine hundredths of a percent over cost, with the entry cross already qualified, compression at 96% and the only signal tier awarded in fourteen charts. Then it printed 290.35 before the open. That gap spent nine tenths of the available window in a single move and left 0.70. Open under this price and the best-compressed setup in the brief is still enterable on a four-hour close. Open above it and the setup is not weaker, it is unavailable, and the next thing worth waiting for is a pullback toward 282.58 or a fresh coil rather than a cheaper entry. The get-out never moves: a four-hour close back under 282.58. One caution either way. There is no record behind this name, six finished signals against the twenty required, so whatever it does today it does not earn a size.
This one is free. The other four this week were not.
Every level, every execution block and all fourteen terminal captures, with nothing held back and no gate anywhere on the page. Monday through Thursday the entry levels sit behind the member wall. Every Friday the whole thing ships open.
It is 0.43% above the line and the get-out sits ten cents under the last print, so a wick through it carries no information and a close through it ends the trade. Take the trigger close or take it inside the band, never on the touch.
This one exists because of the gap and nothing else. On last night's close it was 2.27% over cost against a 2.0% band, which is a shut window. The gap down reopened it.
Yesterday this chart was outside its own window on a filter fail at −3.05% against the same 3.0% band, at 273.98, and this brief said it had run without ever qualifying. It has come back inside and crossed. There is no trigger left to wait for. There is only the question of where it opens relative to the ceiling, and that question is The One Number above.
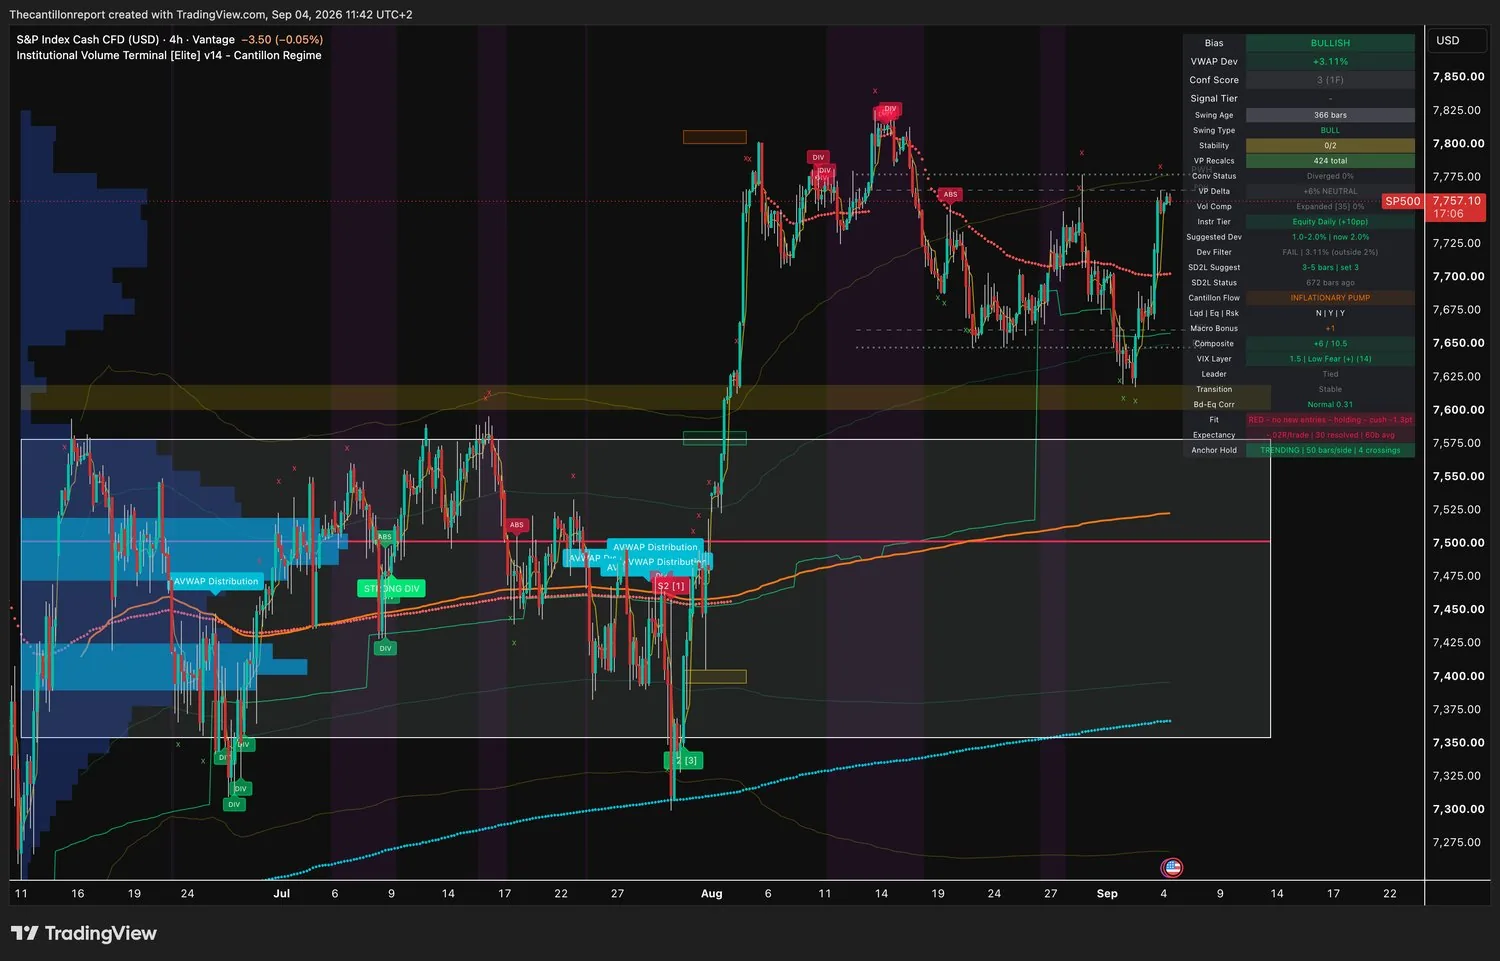
Four indices and four single names. Every one is on a red light, an unproven sample or a broken record field, which is why none carries a size however the chart looks. Two windows are shut, and the reset zone is the price at which each reopens.
| Name | Distance from line | Window | Why not |
|---|---|---|---|
| NAS100 | +0.87% over | Open, cross pending | Best-placed index on the page and the only one with room on both sides: the window runs to 29,925 and the cost line sits at 29,338. Its own record across 181 finished signals is exactly zero, the deepest sample in the brief and the flattest, so the cross changes the regime reading and earns no position by itself. Cushion 0.2 points from turning. |
| RUSSELL | +0.52% over | Open, cross pending | Closest index to its own cost line at 2,951.9, with the window open to 3,010.9 and compression only a quarter loaded. Red light on −.03R over 52 signals and a −3.6-point cushion. Nothing wrong with the location and nothing behind it. |
| SP500 | +3.11% over | Shut, reopens under 7,673.6 | Most extended instrument in the scan, 3.11% above what large money paid at 7,523.1, with the range already expanded and compression at zero. Weakest index confirmation at three across a single timeframe. Record −.02R over 30 signals. Nothing to buy and nothing coiled. |
| US30 | +2.94% over | Shut, reopens under 53,132 | The other shut index, 2.94% over a cost line of 52,090, on −.04R across 81 signals and a −3.1-point cushion. It has run 250 bars on one side of its own line without a single crossing, which is the cleanest trend structure here and the least useful, because you cannot get in. |
| STM | +4.82% implied | Shut by the gap, reopens under 51.45 | Compression building at 96%, second tightest in the brief, and the pre-market print at 52.36 puts it 4.82% over a cost line of 49.95 against a 3.0% band. It was inside the window on the close at 2.64% and it is not now. Record −.01R over 123 signals with a negative cushion, so the gap took away something that was not worth much. |
| DNN | +1.94% implied | Open, cross pending | Closest instrument to its cost line on the close at 0.18% over 3.404, with a fresh bullish divergence printed at the right edge and the pre-market print still inside the band at 3.47. The record is flat at +.00R over 110 signals and the light is red. Good location, no permission, and the divergence is the reason to keep it on the screen. |
| BITB | +0.99% implied | Open, cross pending | Lowest confirmation in fourteen charts at zero, on nine of the twenty signals needed, so there is no record and no light. It reads long into a Bitcoin print above 81,000 while the framework's risk leg reads off. Read it as the disagreement rather than the trade. |
| AMPS | +0.43% over | Open, cross pending | WisdomTree Battery Metals, London listed and quoted in pence, so it runs on its own session and its own panel: full risk-off, −1 of 10.5, all three legs down, transition deteriorating. Coiled to 94% and inside half a percent of cost at 1,586.7, which would put it on the Board anywhere else. The terminal cannot produce a record for it at all. Reload the indicator before trusting anything on this row. |
The remaining eleven captures, unmodified. Read the four index panels first and check their regime block against the chip bar at the top of this page: they print +6 of 10.5 and inflationary pump, the single-name panels taken seventeen minutes later print +2 and distribution, and that gap is the single most important thing in the brief.
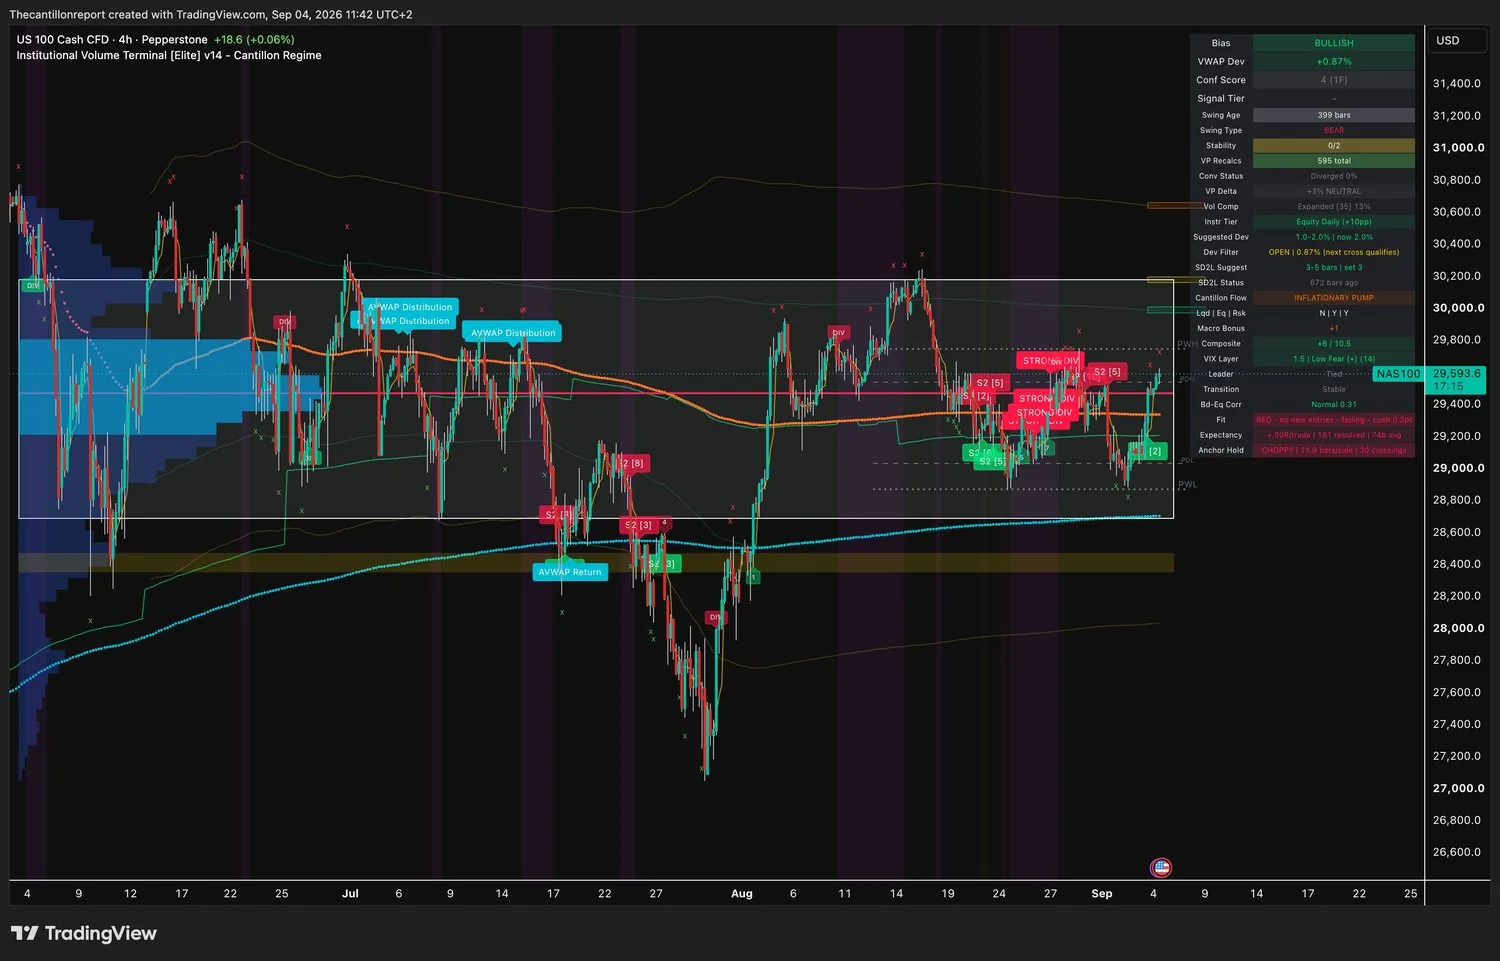
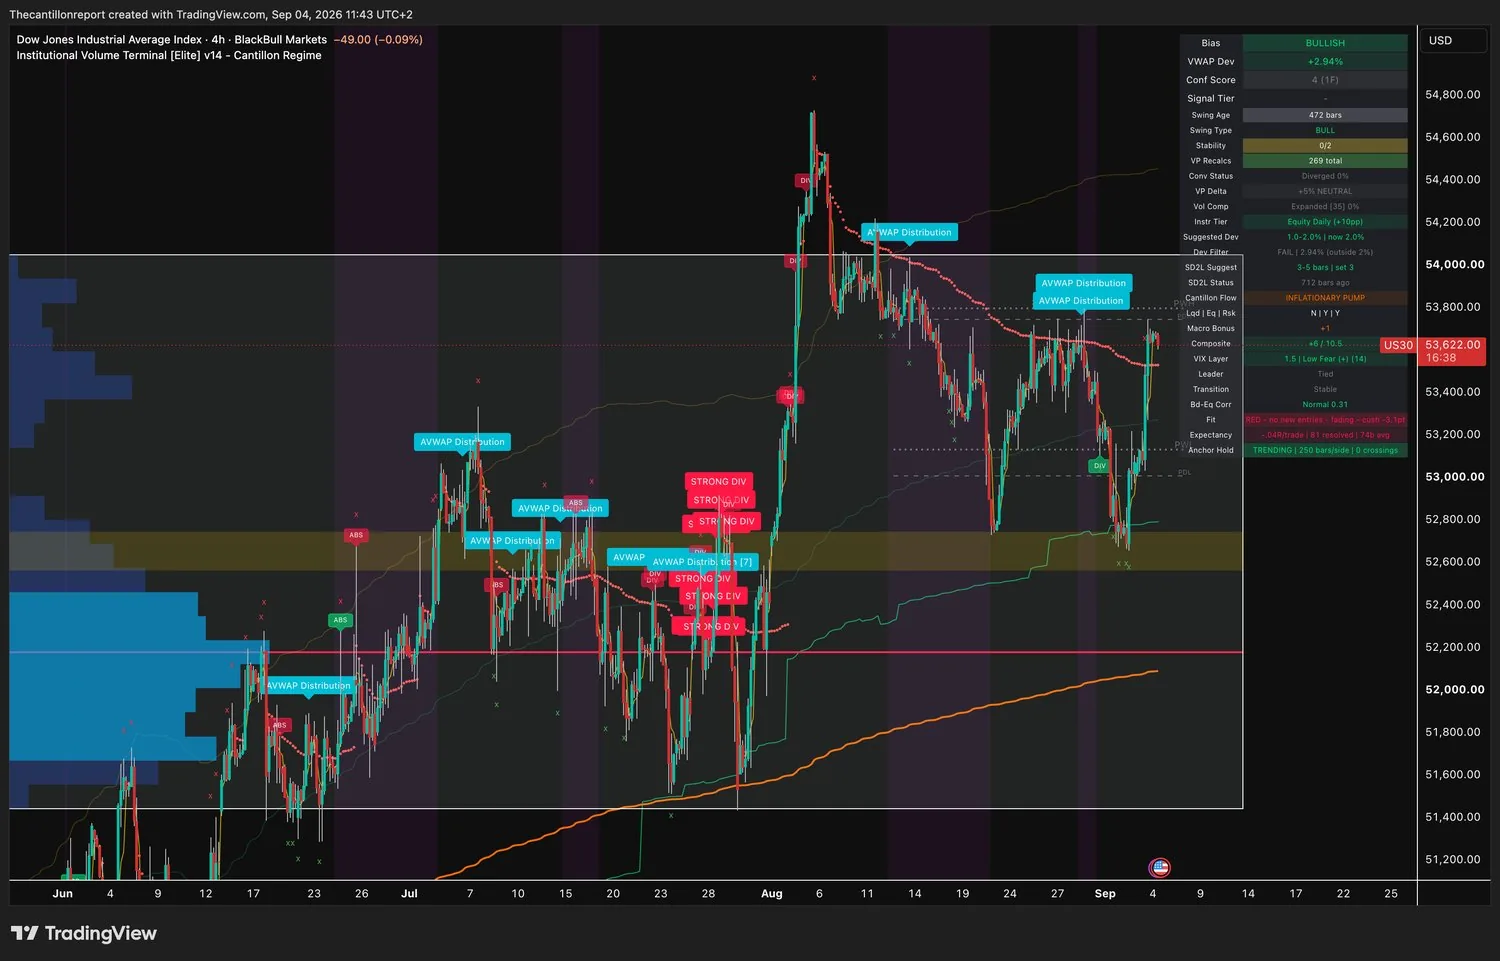
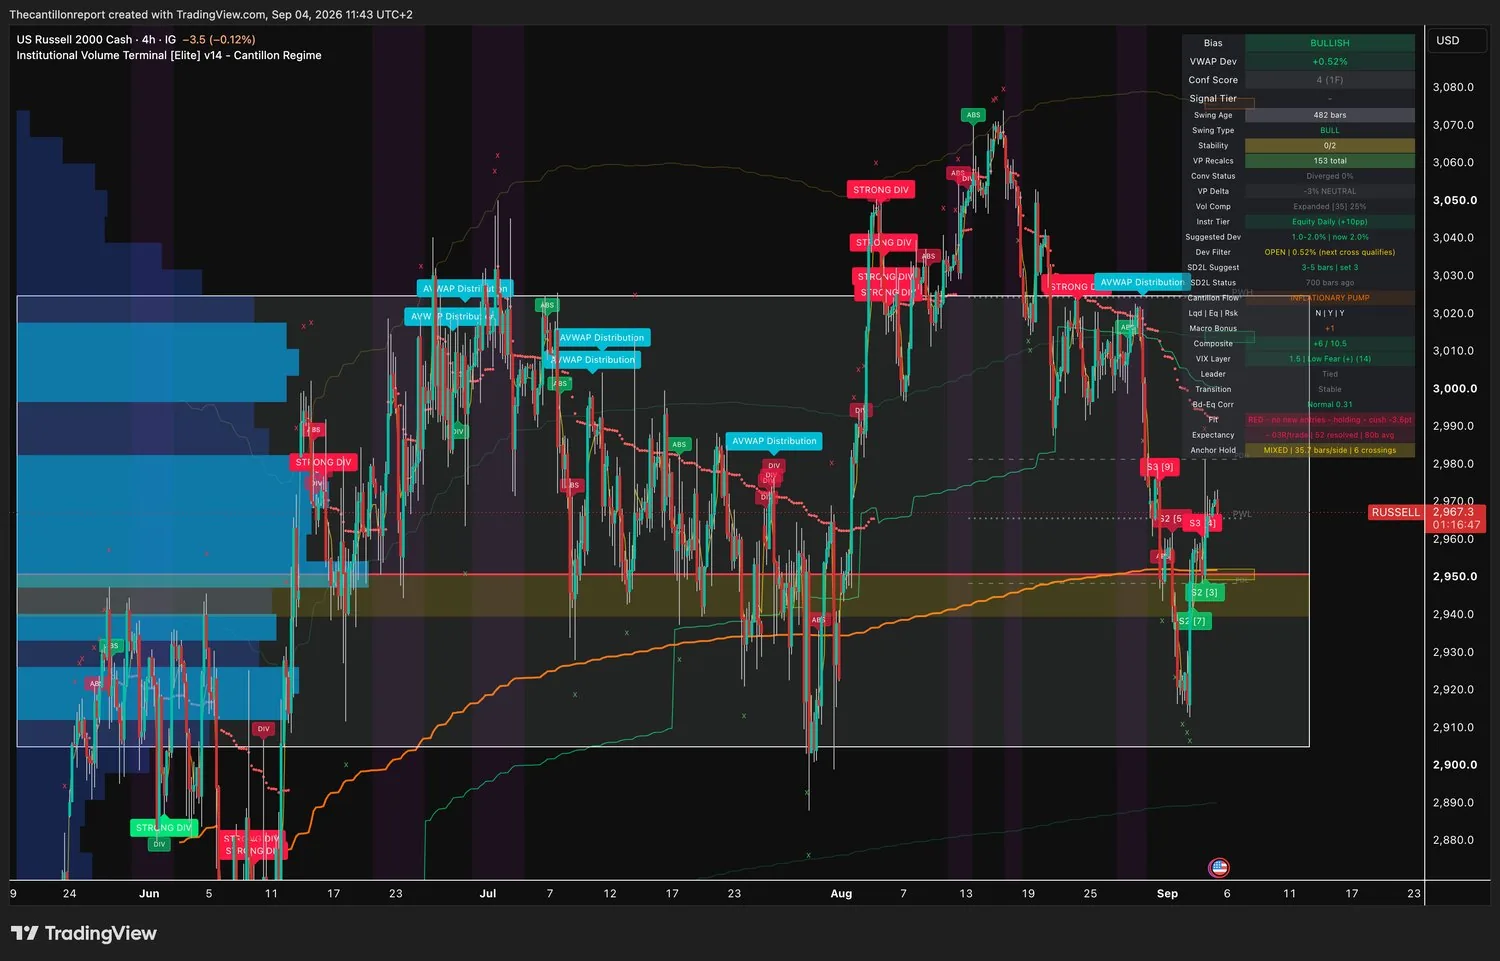
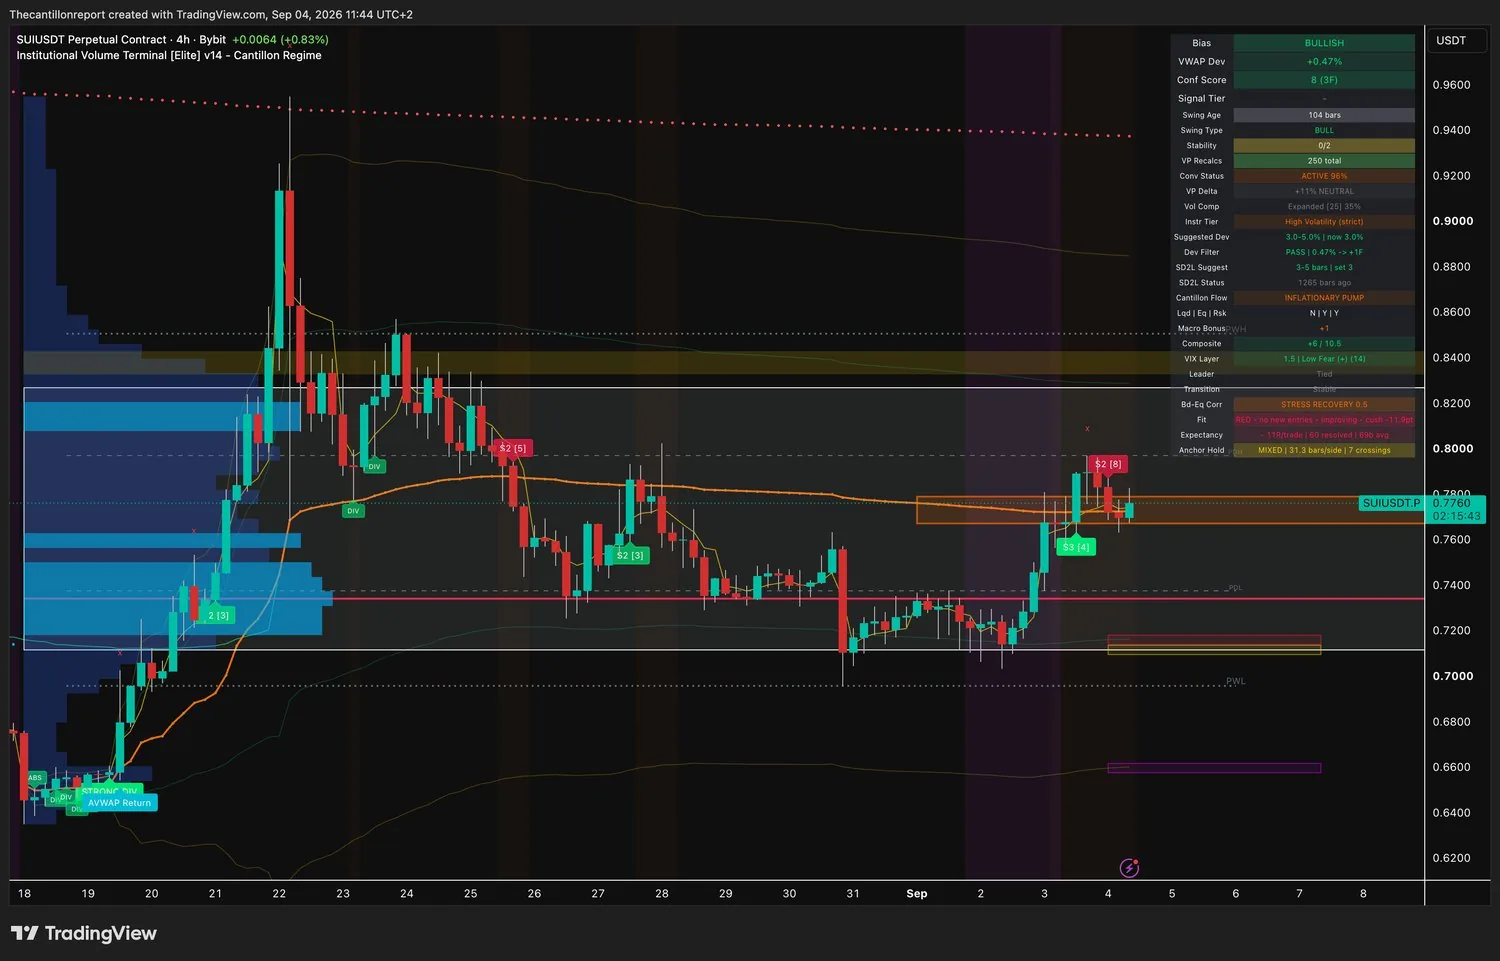
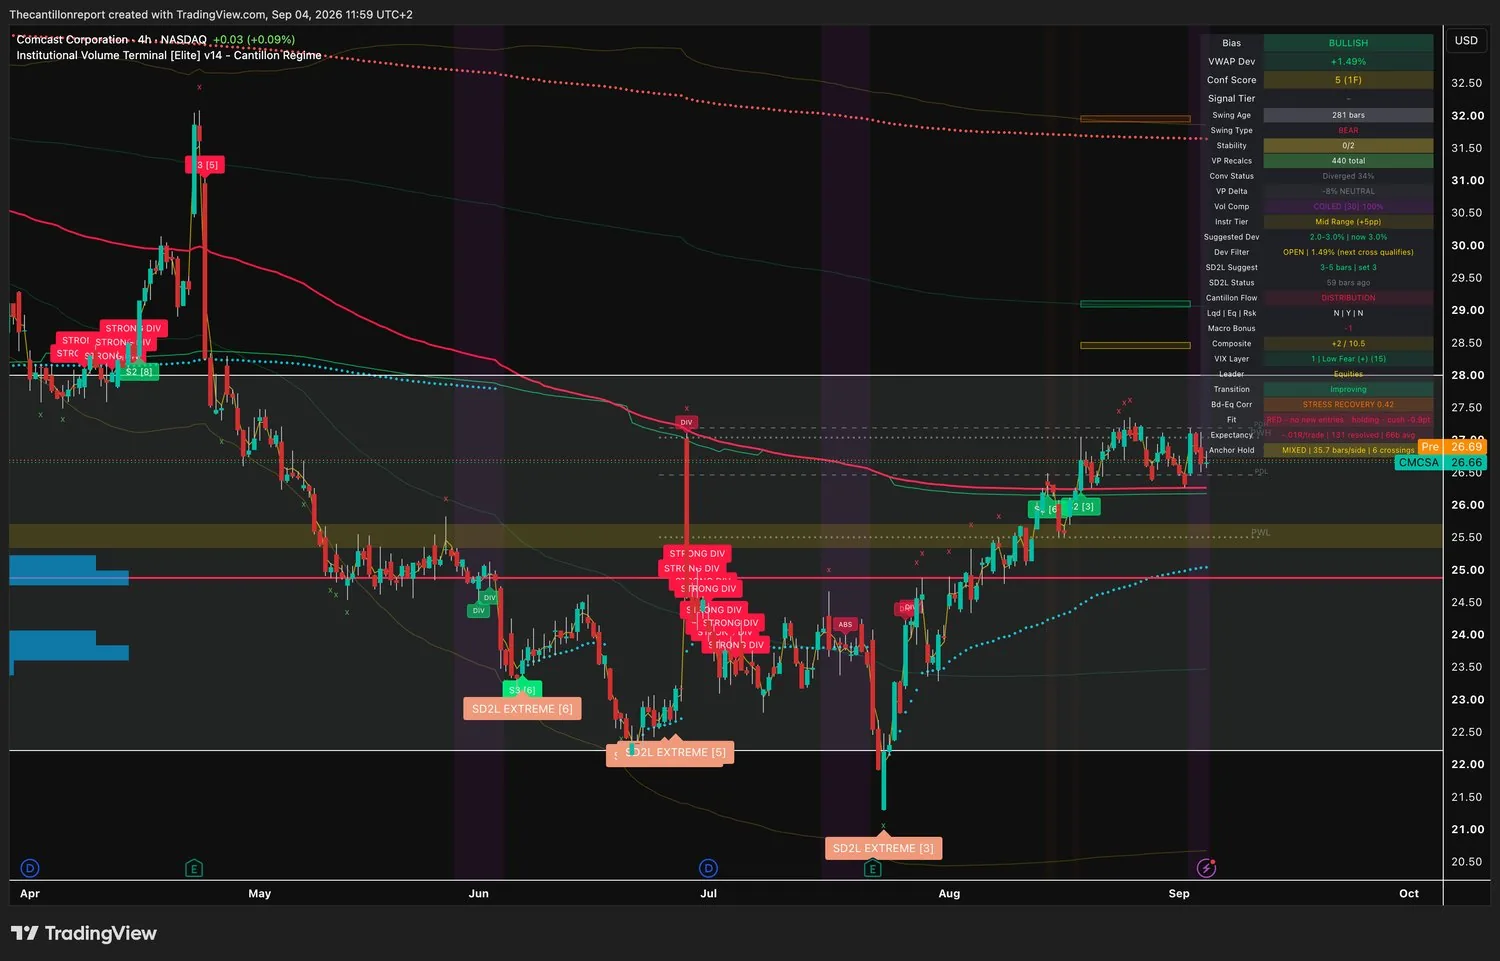
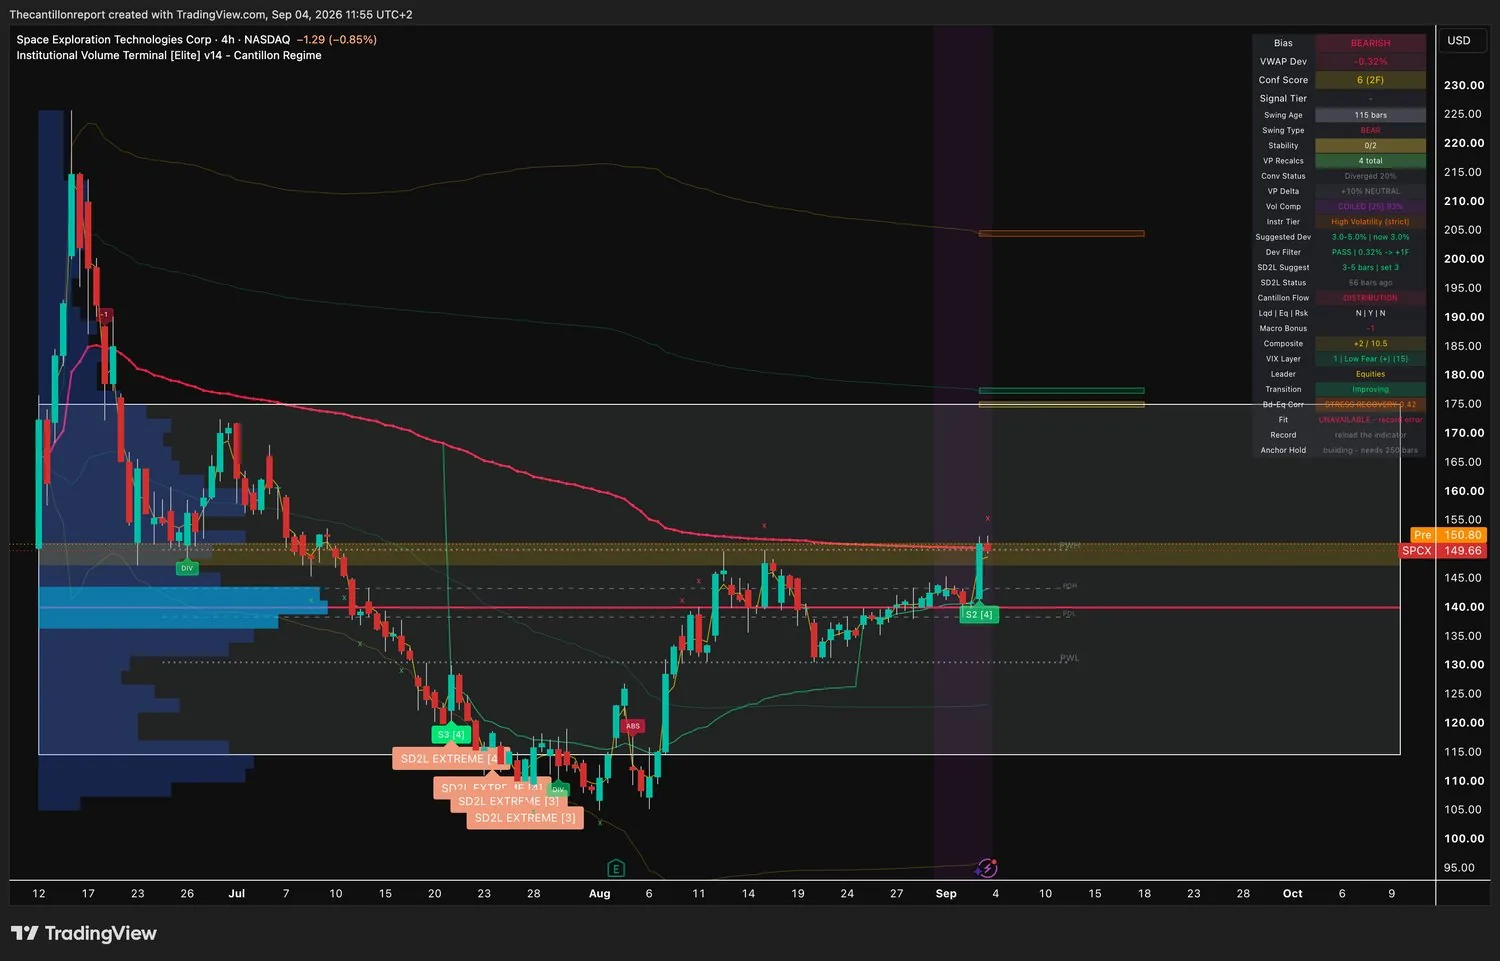
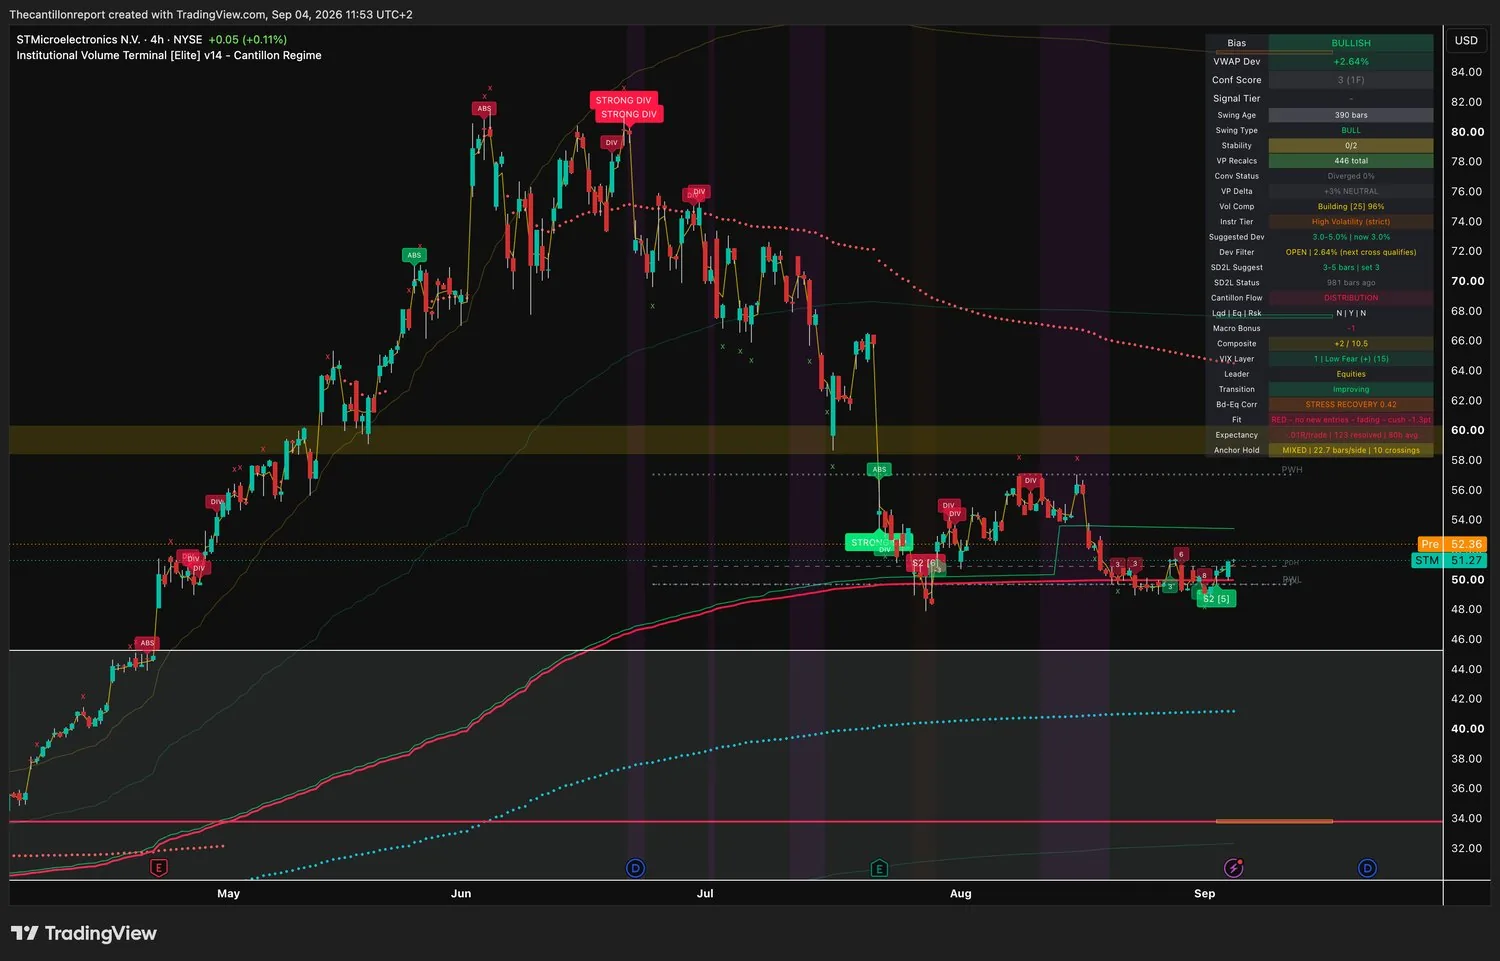
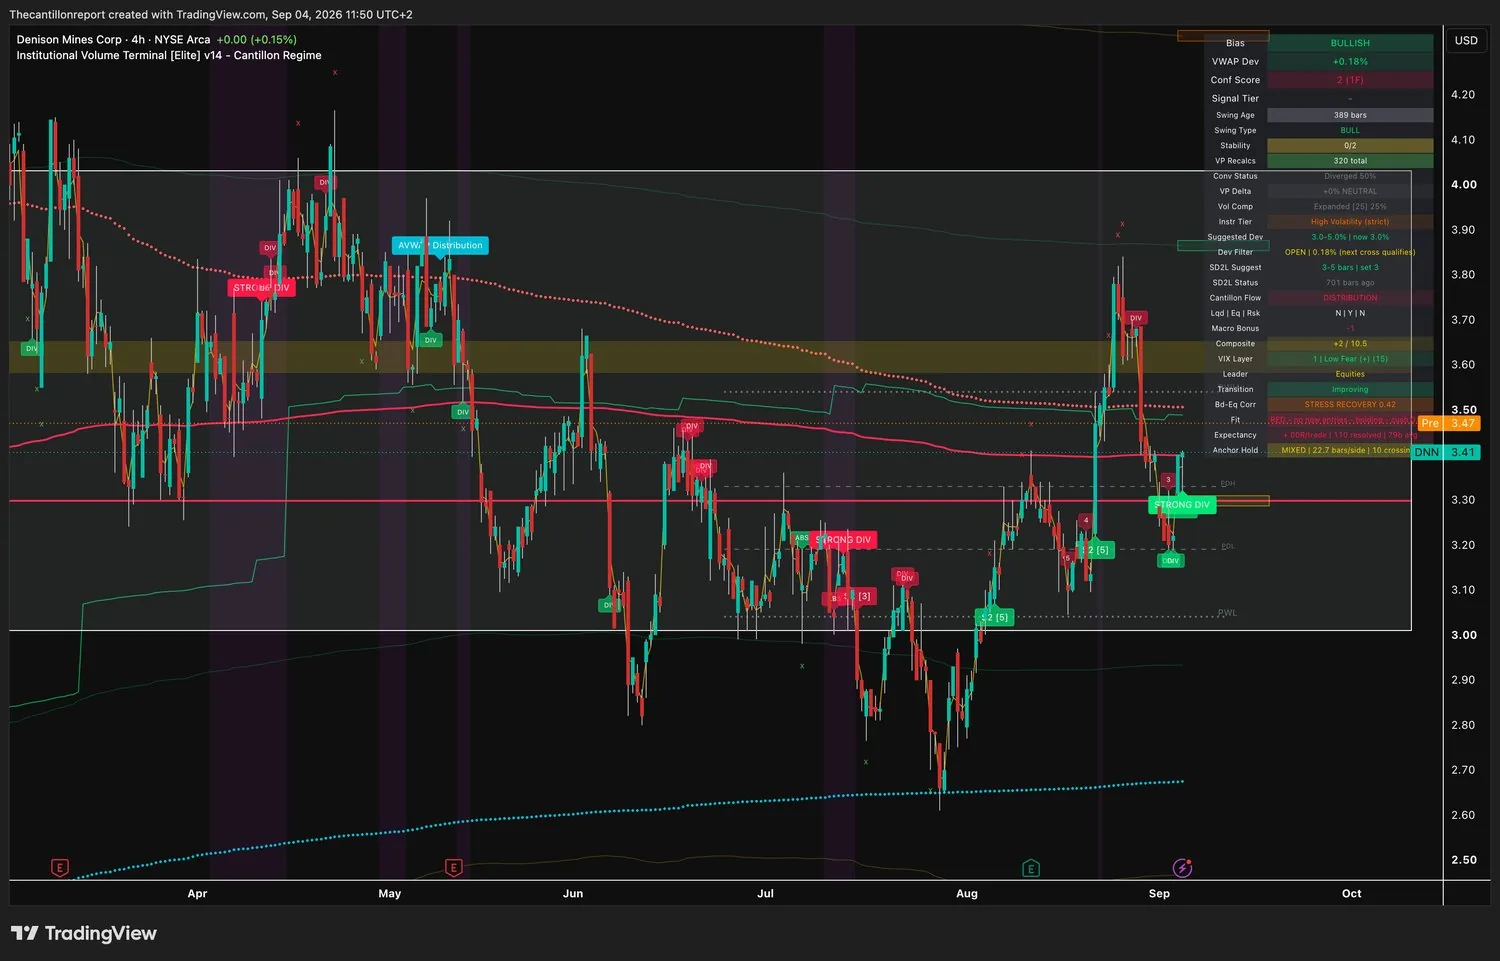
Cost line (the anchor) · the volume-weighted price large money actually paid over the current swing. Everything in this brief is measured as distance from it, and that distance is what "deviation" means. Buy near it and you are buying where they bought. Buy far above it and you are handing them the profit. Entry window · how far from the cost line a new entry can still be sensibly priced. The width depends on the instrument's own volatility tier: two percent for indices and large caps, three percent for mid-range names, three to five for the high-volatility list. Open means you are inside it and waiting on the cross. Qualified means the cross has already printed inside it. Shut means the move has run and you wait for a pullback or a fresh coil. Every trigger in this brief is a four-hour close, in the trade's direction, never a touch. Implied deviation · where a pre-market price sits relative to the cost line, worked out from the two figures the terminal publishes on the close, its last price and its deviation, plus the terminal's own pre-market print. The terminal does not print this field. It is in the brief because a gap can open or shut a window before the session starts, and four of them did this morning. Compression · how tightly the range has wound, from 0 to 100%. Building means it is loading. Coiled means it is nearly full, and coiled spring is the terminal's own label for the tightest version. High compression means the next move should be a big one, says nothing about direction, and never overrides a shut window or a red light. Confirmation · how many independent readings agree, and across how many timeframes. Higher on both counts is better, and three timeframes at 8 beats one timeframe at 10. Buyer or seller dominance · which side is actually transacting at the most-traded price, as a percentage skew. Neutral means the two sides are matched and the volume is telling you nothing about direction. Convergence · how tightly the separate institutional cost lines have clustered. High convergence means several cohorts of large money paid roughly the same price, so the line underneath is thicker than usual. Snapback reset · how long since price pushed through the second deviation band and reclaimed it. A fresh reset means the range has recently been stretched and released; an old one means the current structure has been quiet for a long time. Signal tier · awarded when the entry cross, the confirmation and the window all line up at once. One name carries one today and thirteen do not. Record · the average result per signal in units of risk, where being stopped out is exactly −1.00. Always published with the number of finished signals behind it, and never published at all below 20 of them. It is in-sample, calculated over the same history the settings were chosen on, so read it as a description of the past and not a forecast. Trend light and cushion · green means full size, amber means half, red means no new entry however good the chart looks, and unproven means the sample is still being built. The cushion is how far the light is from changing, and a negative cushion means it has already changed against you.
Readings captured Friday 4 September 2026, 11:42–11:59 CEST, from the IVT v14 terminal, on four-hour bars that had not yet closed. That is why every trigger here is a close and not a touch, and it matters more than usual today: the August employment report is released at 08:30 Eastern, and four of the fourteen instruments had their entry window opened or shut by a pre-market gap before anyone could act on last night's reading.
The regime block differs across the captures in this brief. The four index charts were taken between 11:42 and 11:44 CEST and print Composite +6 of 10.5 under an inflationary pump; every single-name chart taken from 11:46 onward prints +2 of 10.5 under distribution, with the macro bonus moving from +1 to −1. The brief uses the later reading throughout and the earlier one is visible on the index captures. Neither has been edited.
Records are in-sample and forecast nothing. No rate is published on fewer than twenty finished signals, and the sample size is printed beside every one. Astera Labs at six signals and the Bitwise fund at nine are reported as counts rather than rates. The record fields for SpaceX and WisdomTree Battery Metals return a terminal fault and are reported as faults rather than published. Cost lines, entry windows and implied pre-market deviations are derived from the percentage distances the terminal publishes rather than read off it directly, so treat them as accurate to the nearest cent or index point; trigger levels are set at the nearest structural shelf and are ours, not the terminal's. Index levels come from cash CFD feeds and will differ from your own index or futures contract. WisdomTree Battery Metals is London listed and quoted in pence on its own session. No level here is meant to survive a payrolls print.
Charts are unmodified terminal captures provided for reference, not as entry instructions. Educational content only. Not financial advice. Past results do not predict future ones.