The most dangerous sentence in today’s market is: “Volume is low.” It sounds simple. It sounds bearish. It sounds like the kind of thing traders say before a rally fails.
But in April 2026, that sentence is too crude.
The U.S. equity market is not suffering from a broad lack of trading activity. March 2026 regular-hours equity average daily volume reached 20.47 billion shares, up 27.88% year over year and the second-highest month on record. Index options, SPX options, and SPX 0DTE activity also reached record levels in March.
So the question is not: “Where did all the volume go?”
That is the volume paradox. The tape can feel quiet in individual stocks while index options are exploding. It can feel thin during the middle of the day while activity clusters around CPI, earnings, oil headlines, and the U.S. open. It can feel healthy at the index level while the average stock is quietly losing participation.
This is not a low-volume market. It is a market where volume has migrated.
Volume migrated, it did not disappear
Volume has moved into ETFs, index options, 0DTE structures, extended-hours trading, and a narrow group of AI-linked winners. That is why the S&P 500 can sit near record highs while breadth looks much less impressive underneath.
For elite traders, that distinction matters. A genuinely low-volume rally is one thing. A high-volume, narrow-participation rally is something else entirely.
The first is a warning about demand. The second is a warning about structure.
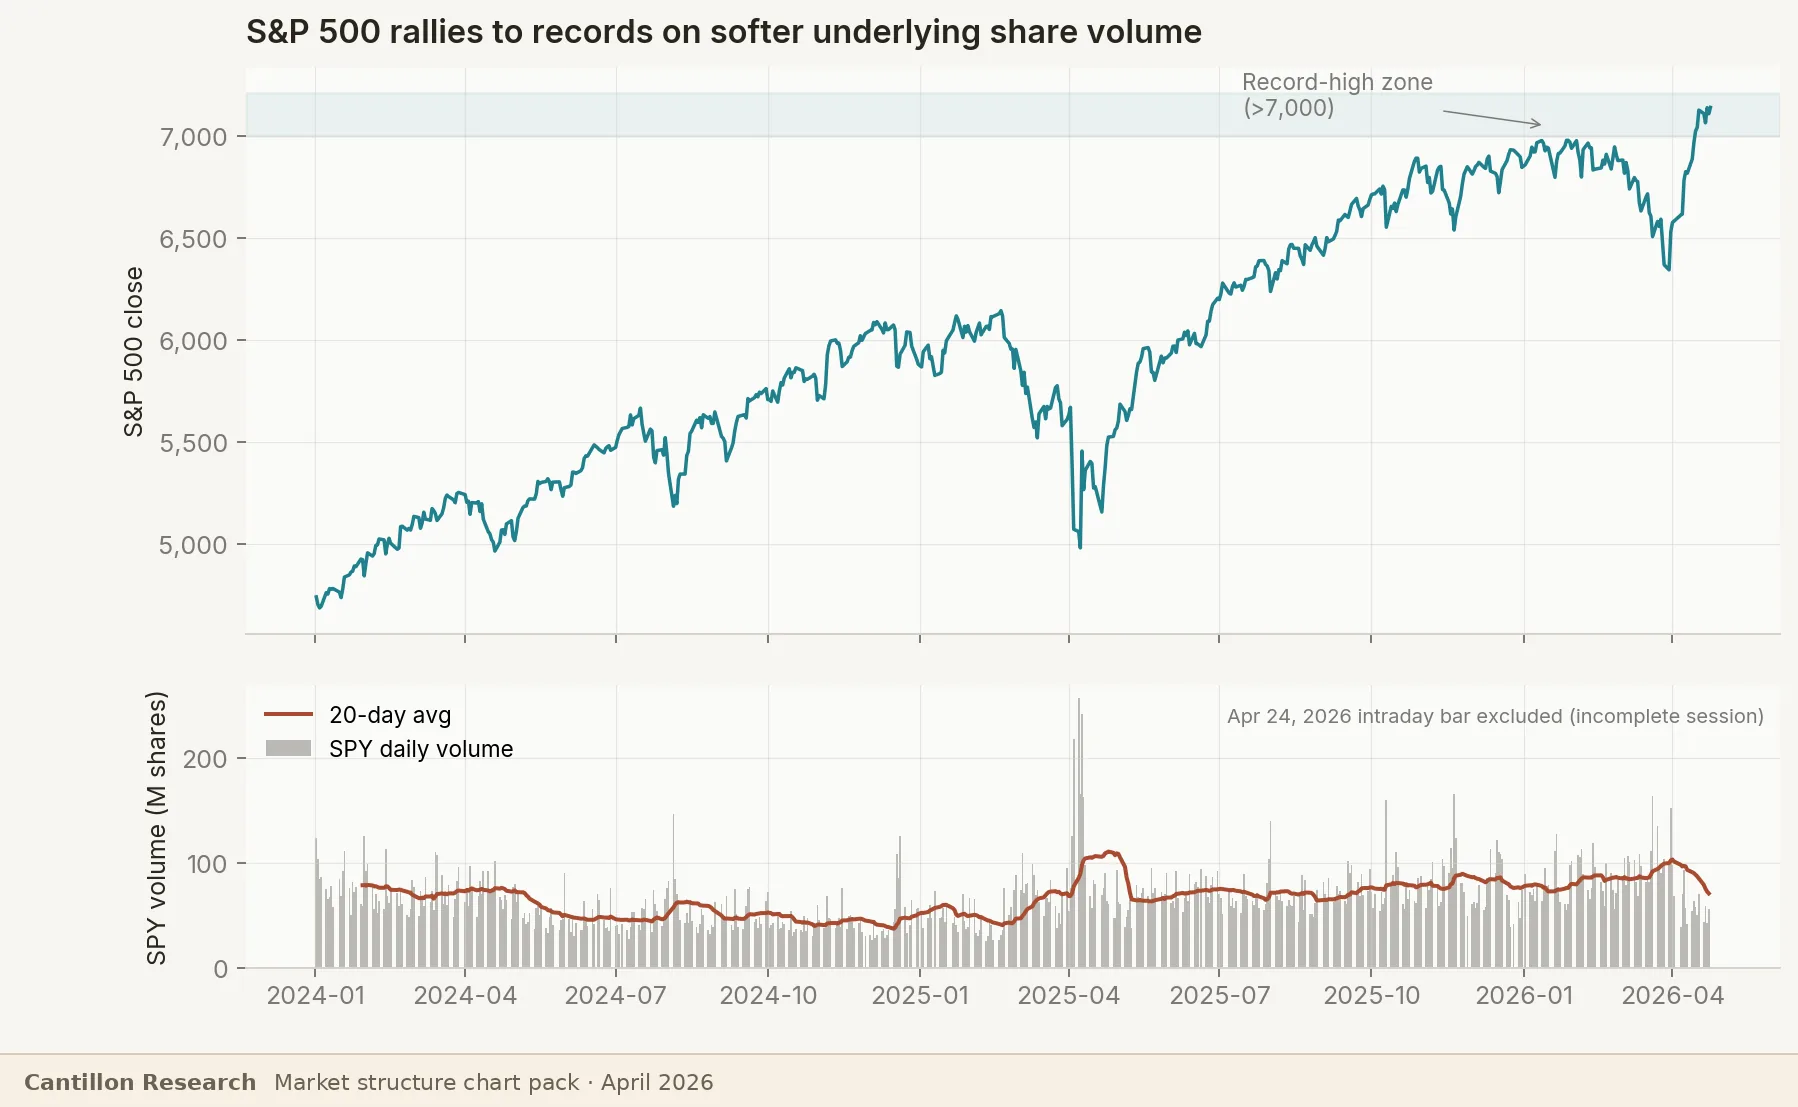
When traders say volume feels low, they are often describing the cash-equity tape they personally watch: fewer clean single-name breakouts, fewer broad risk-on days, and more periods where nothing seems to move unless a headline hits.
That feeling is real. But it is not the same as saying total market activity is low.
Exchange-traded product volume reached an all-time high of 5.77 billion shares per day in March, representing 28.17% of total equity average daily volume. Extended-hours activity also rose, with pre-market volume at 1.22 billion shares and post-market volume at 0.99 billion shares.
That is not a dead market. It is a market where the action has moved away from traditional single-stock participation and into more concentrated vehicles.
The 2011 comparison is useful, but not identical
There is a tempting historical comparison from 2011. Back then, traders were also asking where the volume had gone. On March 28, 2011, U.S. market volume was only 5.973 billion shares, the slowest day of that year. Year-to-date average daily volume had fallen to 7.9 billion shares from 8.5 billion the prior year and 9.8 billion in 2009.
But 2026 is not 2011.
In 2011, the issue was closer to a true post-crisis volume slowdown. Volatility had compressed, hedge funds were less active, and high-frequency trading economics were less attractive.
In 2026, the aggregate data says the opposite. Volume is high. Options activity is high. ETF activity is high. The market is not sleepy at the system level.
The similarity is psychological, not mechanical. In both periods, the tape could look deceptively calm before a catalyst changed the regime. But today’s risk is less “nobody is trading” and more “everyone is trading the same narrow set of exposures.”
The VIX is not panicking, but it is not calm
The VIX backdrop is one of the most important parts of this story. The market is not in a classic panic. But it is also not in the kind of ultra-compressed volatility regime that usually supports a clean, broad melt-up.
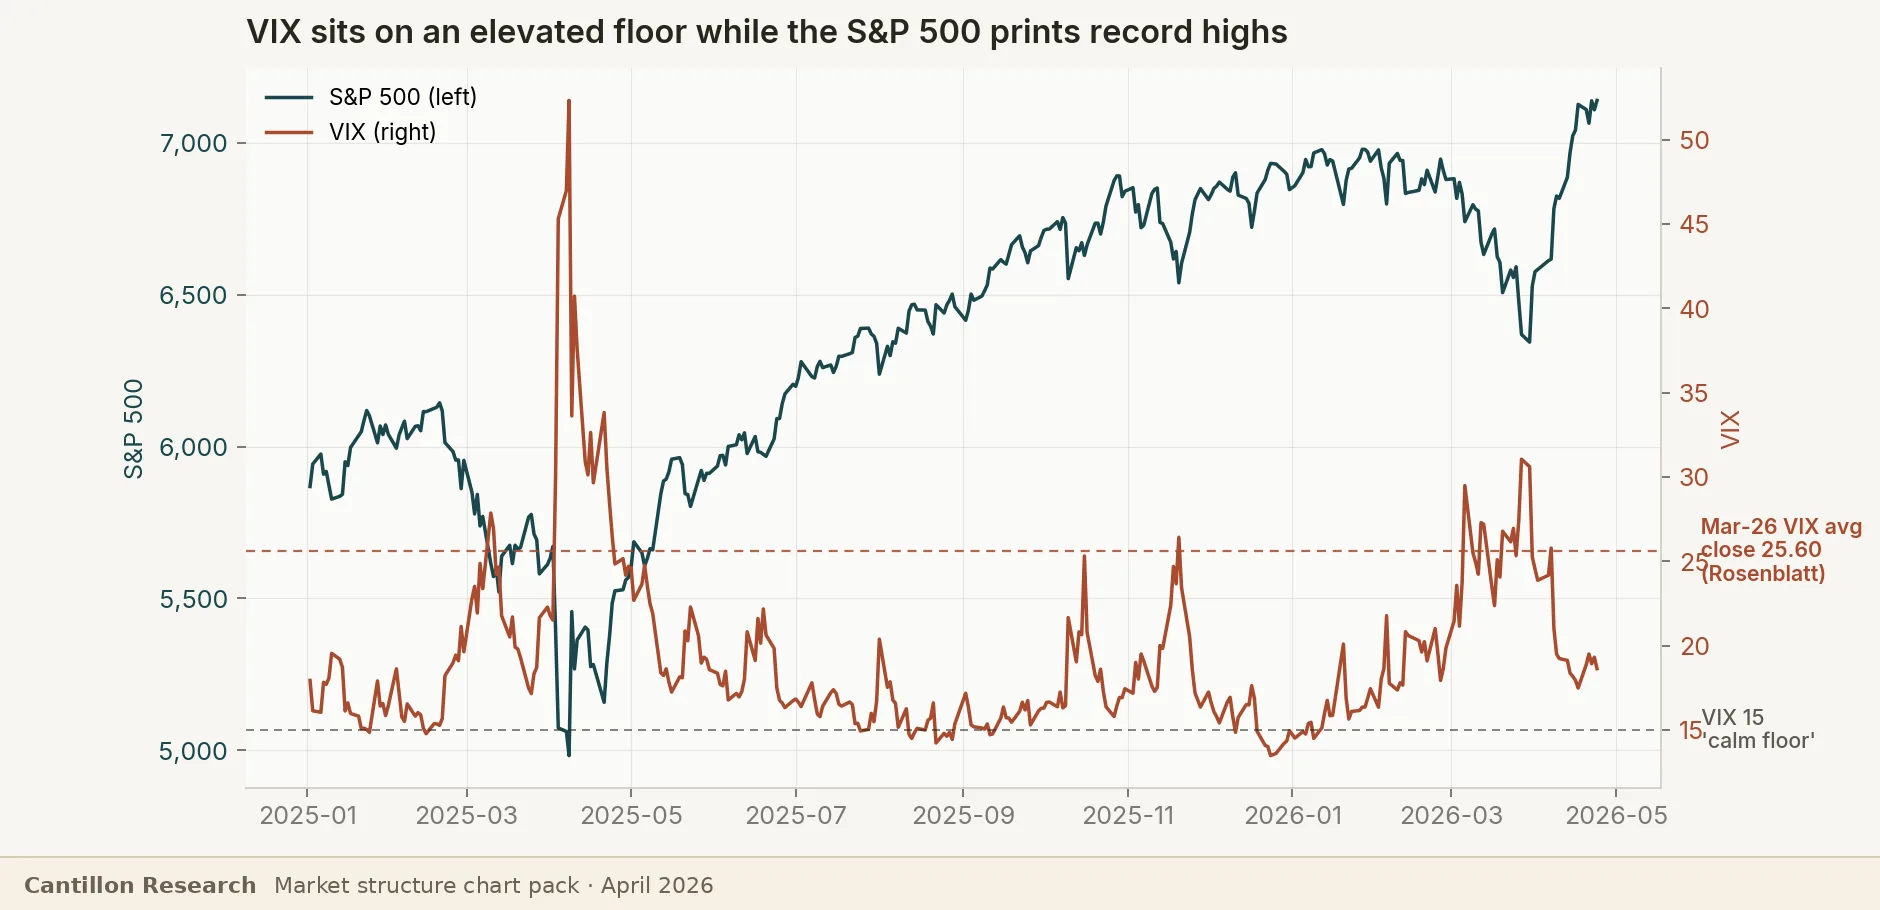
The VIX averaged 25.60 in March 2026, up 34% month over month. That tells us hedging demand remained elevated even while the index held near the highs.
When the index rises and the VIX collapses, the market is saying: “Risk is being repriced lower.”
When the index rises and the VIX refuses to fully compress, the market is saying: “Investors are still paying for protection.”
That does not make the rally bearish by itself. But it does make the rally more event-sensitive. Traders are not simply buying and forgetting. They are buying, hedging, rotating, and waiting for the next macro input.
Breadth is the real warning
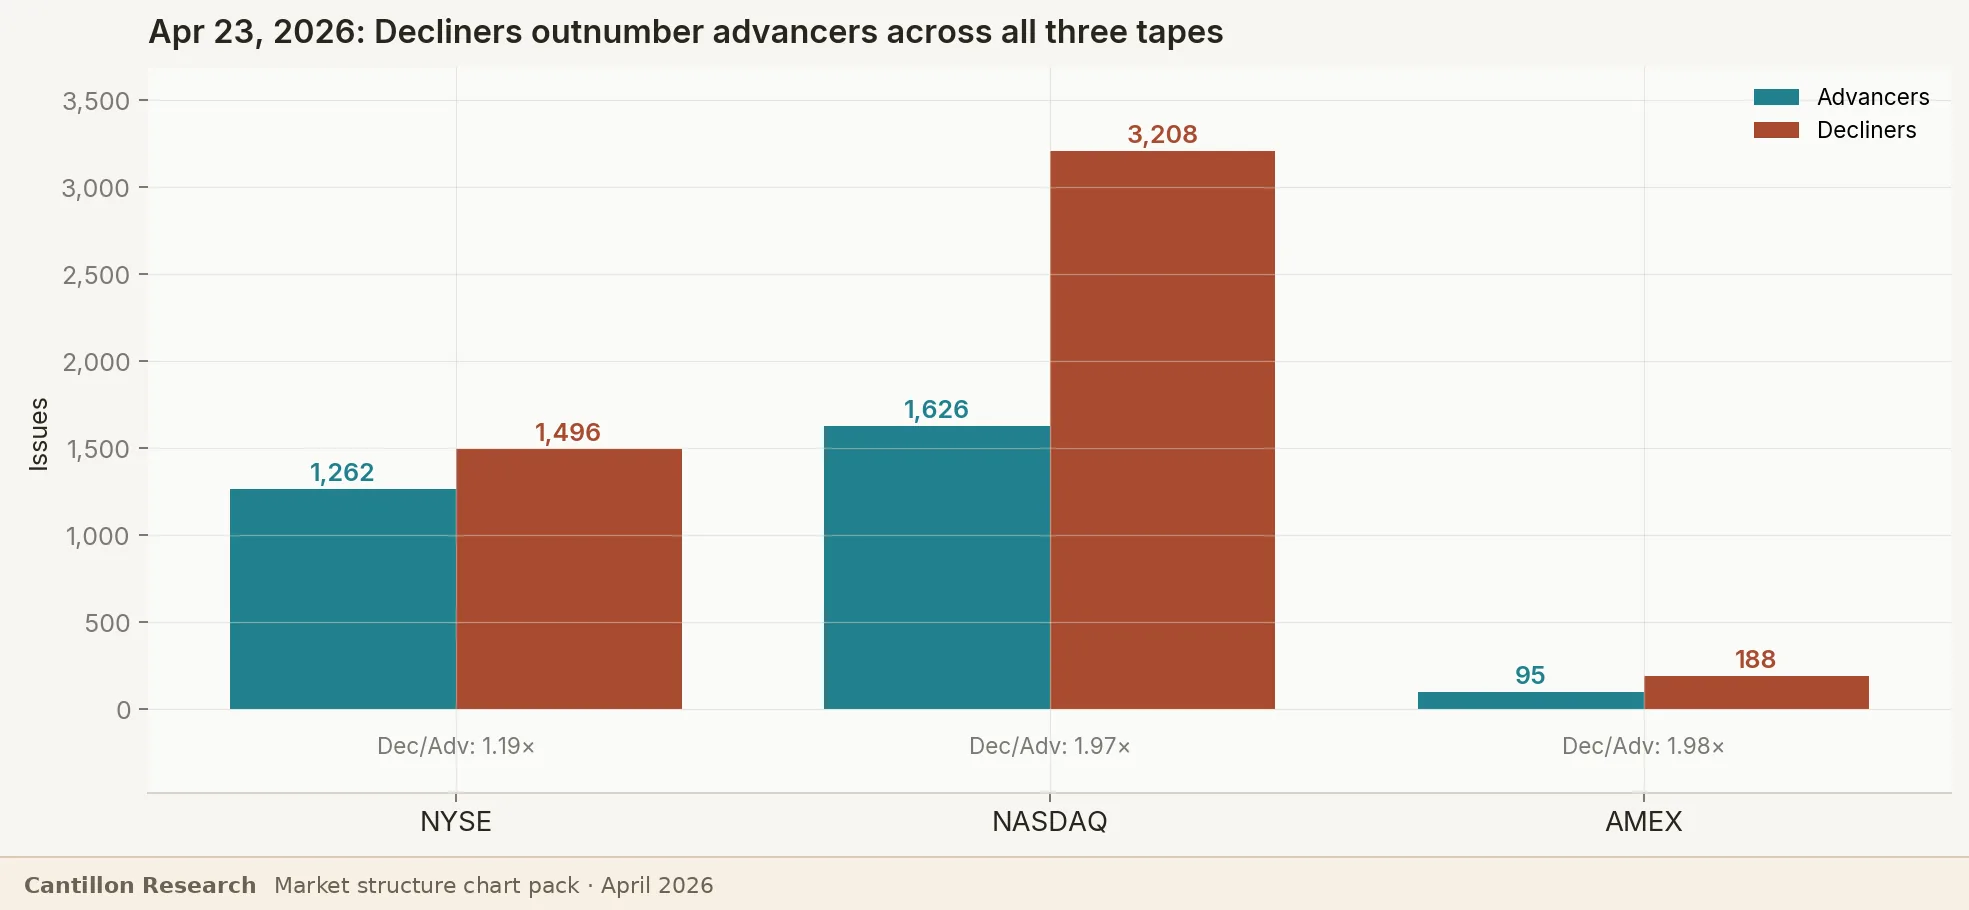
Breadth is where the report becomes more concerning. On April 23, NYSE decliners outnumbered advancers 1,496 to 1,262. Nasdaq decliners outnumbered advancers 3,208 to 1,626. AMEX decliners outnumbered advancers 188 to 95.
That is not what a fully healthy record-high tape usually looks like.
It does not mean the market must immediately fall. Narrow markets can keep rising for longer than most traders expect. But it does mean the index is carrying more weight on fewer shoulders.
This is where the advance-decline line becomes critical. A bull market is confirmed when the advance-decline line makes new highs with the index. A bearish divergence appears when the index makes new highs but the advance-decline line fails to confirm.
If the S&P 500 pushes higher and breadth improves, the rally becomes healthier. If the S&P 500 pushes higher and breadth deteriorates, the rally becomes more fragile.
The index level is the headline. Breadth is the health check.
Leadership is narrow, and that is both bullish and dangerous
The market’s leadership is easy to identify. It is chips. It is AI infrastructure. It is the semiconductor complex.
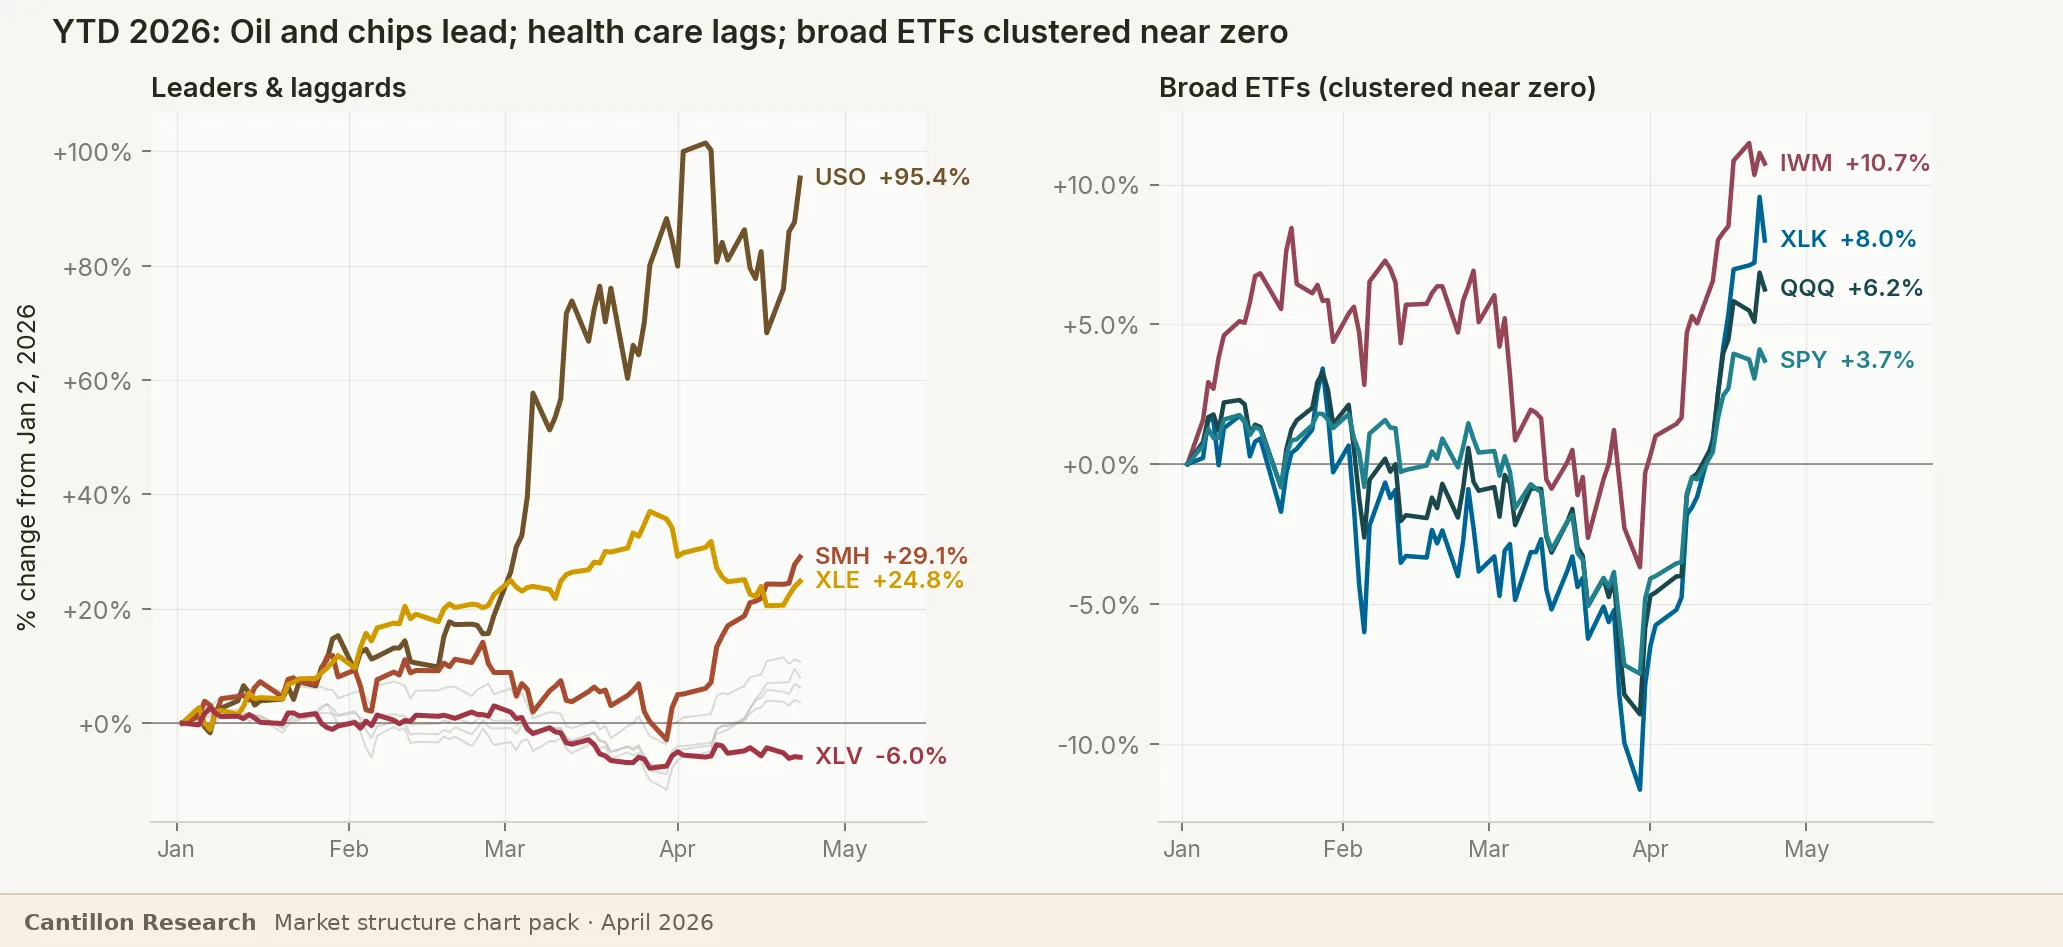
The PHLX Semiconductor Index entered April 24 on a 17-session win streak, its longest on record based on data going back to 1994. TSMC lifted its revenue forecast and pledged more capital spending to meet AI chip demand. Intel’s results also reinforced the AI-infrastructure demand story.
This is not fake leadership. There is a real earnings story underneath it.
That is why the AI rally cannot simply be dismissed as speculation. If earnings, capex, and demand continue to validate the theme, narrow leadership can persist.
But there is a cost. The more the index depends on one theme, the more vulnerable it becomes to one disappointment.
That is the leadership problem.
What is not working matters too
A good tape is not only about what leads. It is also about what refuses to recover.
Software has been weak. IBM and ServiceNow earnings outlooks interrupted a software winning streak, while Workday, Microsoft, and Intuit also weakened in the same stretch.
Health care has also lagged. On April 23, the NYSE new-lows list included names such as Abbott, Danaher, ResMed, and Qiagen.
That combination is not automatically bearish, but it is late-cycle in character. A market led by chips while defensive health care makes new lows and software fails to recover is not a broad risk-on tape. It is a concentrated leadership tape.
For traders, the question is not whether AI is strong. It clearly is. The question is whether AI is strong enough to carry everything else.
The macro trigger: oil, inflation, and yields
The market-structure setup would be manageable if macro conditions were calm. They are not.
March CPI rose 0.9% month over month and 3.3% year over year, while energy rose 10.9% month over month and gasoline rose 21.2% month over month.
At the same time, oil has become the swing variable. WTI was quoted at $95.78 on April 24, while Brent moved above $100 on April 22 after reports of gunfire hitting container ships in the Strait of Hormuz.
This matters because oil changes the whole interpretation of the tape.
If oil falls and inflation cools, narrow leadership can broaden. If oil stays near or above $100 and CPI re-accelerates, the market has to price a more difficult combination: higher input costs, less Fed flexibility, pressure on margins, and higher discount rates.
That is when a market-structure issue becomes a macro issue. And macro issues travel faster through a narrow tape.
The historical lesson
The market has seen versions of this before. The lesson is not that today must become 2011, 2018, 2021, or 2022. The lesson is that “thin tape at highs” can resolve in very different ways depending on breadth, policy, leadership, and macro pressure.
| Period | What it looked like | What mattered |
|---|---|---|
| 2011 low-volume recovery | Volume felt weak after the post-crisis rebound. | Macro and policy shocks eventually mattered more than the low-volume drift. |
| 2017 low-vol melt-up | Volatility stayed deeply compressed while equities kept grinding higher. | The risk was not weakness; it was excessive calm and short-vol crowding. |
| 2021 options-led mania | Options activity and retail participation helped lift the market, but breadth later narrowed. | Narrowing participation became a warning before the 2022 bear market. |
| 2023-24 AI narrowness | A small group of mega-cap AI winners carried a large share of index performance. | Narrow leadership persisted because earnings kept validating the theme. |
| April 2026 | Aggregate volume and options activity are high, but breadth is weak and leadership is concentrated. | The next regime depends on whether breadth broadens before oil, inflation, or rates break the tape. |
Volume alone is not predictive. Volume must be interpreted together with breadth, volatility, leadership, and macro pressure.
The trader’s checklist
The practical question is: what should elite traders watch now? Not every datapoint matters equally. The market is giving us a few high-signal variables.
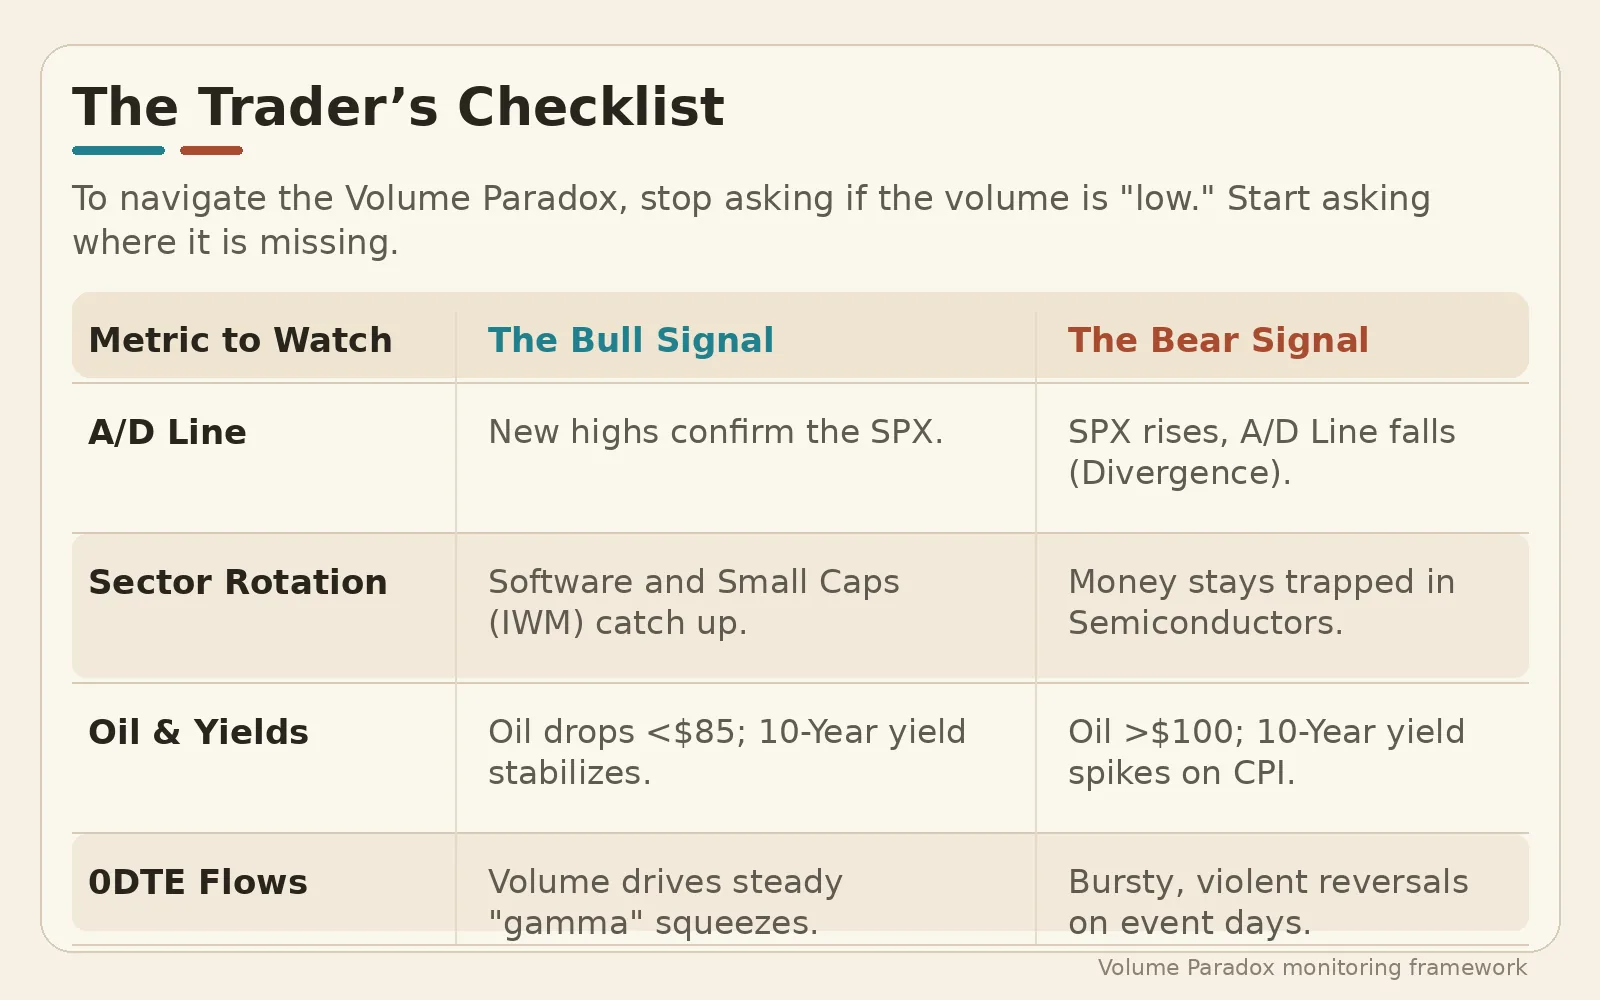
- Advance-decline line: If it confirms new highs, the bull case gets cleaner. If it fails, every new index high becomes less trustworthy.
- Sector rotation: Software and small caps do not need to lead immediately, but they need to stop acting like a separate bear market.
- Oil: Oil below $85 would remove pressure from inflation expectations. Oil above $100 keeps the market in macro-risk mode.
- 0DTE flows: Short-dated options can support smooth gamma-driven trends, but they can also produce violent reversals around event days.
Bull, base, bear
Oil cools, CPI does not confirm a lasting inflation re-acceleration, AI earnings continue to validate the capex cycle, and chips hold gains while small caps and cyclicals join.
The S&P 500 stays elevated but choppy. VIX does not collapse. Oil remains volatile. AI earnings are good enough to prevent a major unwind but not broad enough to lift every group.
Oil stays above $100, CPI re-accelerates, yields rise, AI leadership cracks, software remains weak, small caps fail, and breadth never confirms index strength.
The bull case is breadth broadening. The base case is a high-index, high-volatility grind. The bear case begins when macro pressure hits a narrow tape.
Final view
The April 2026 market is not giving a simple bearish warning. It is giving a more nuanced message: the market has plenty of volume, but not enough broad participation.
That is why the tape can feel both powerful and fragile at the same time. Powerful, because AI leadership is real and options/ETF liquidity remain deep. Fragile, because breadth is weak, volatility has not fully compressed, and oil/inflation risk can quickly change the discount-rate story.
The mistake is to say: “Volume is low, therefore the rally is fake.”
For the next several weeks, the market does not need traders to debate whether volume is high or low. It needs traders to watch where participation is missing.
That is where the next signal will come from.