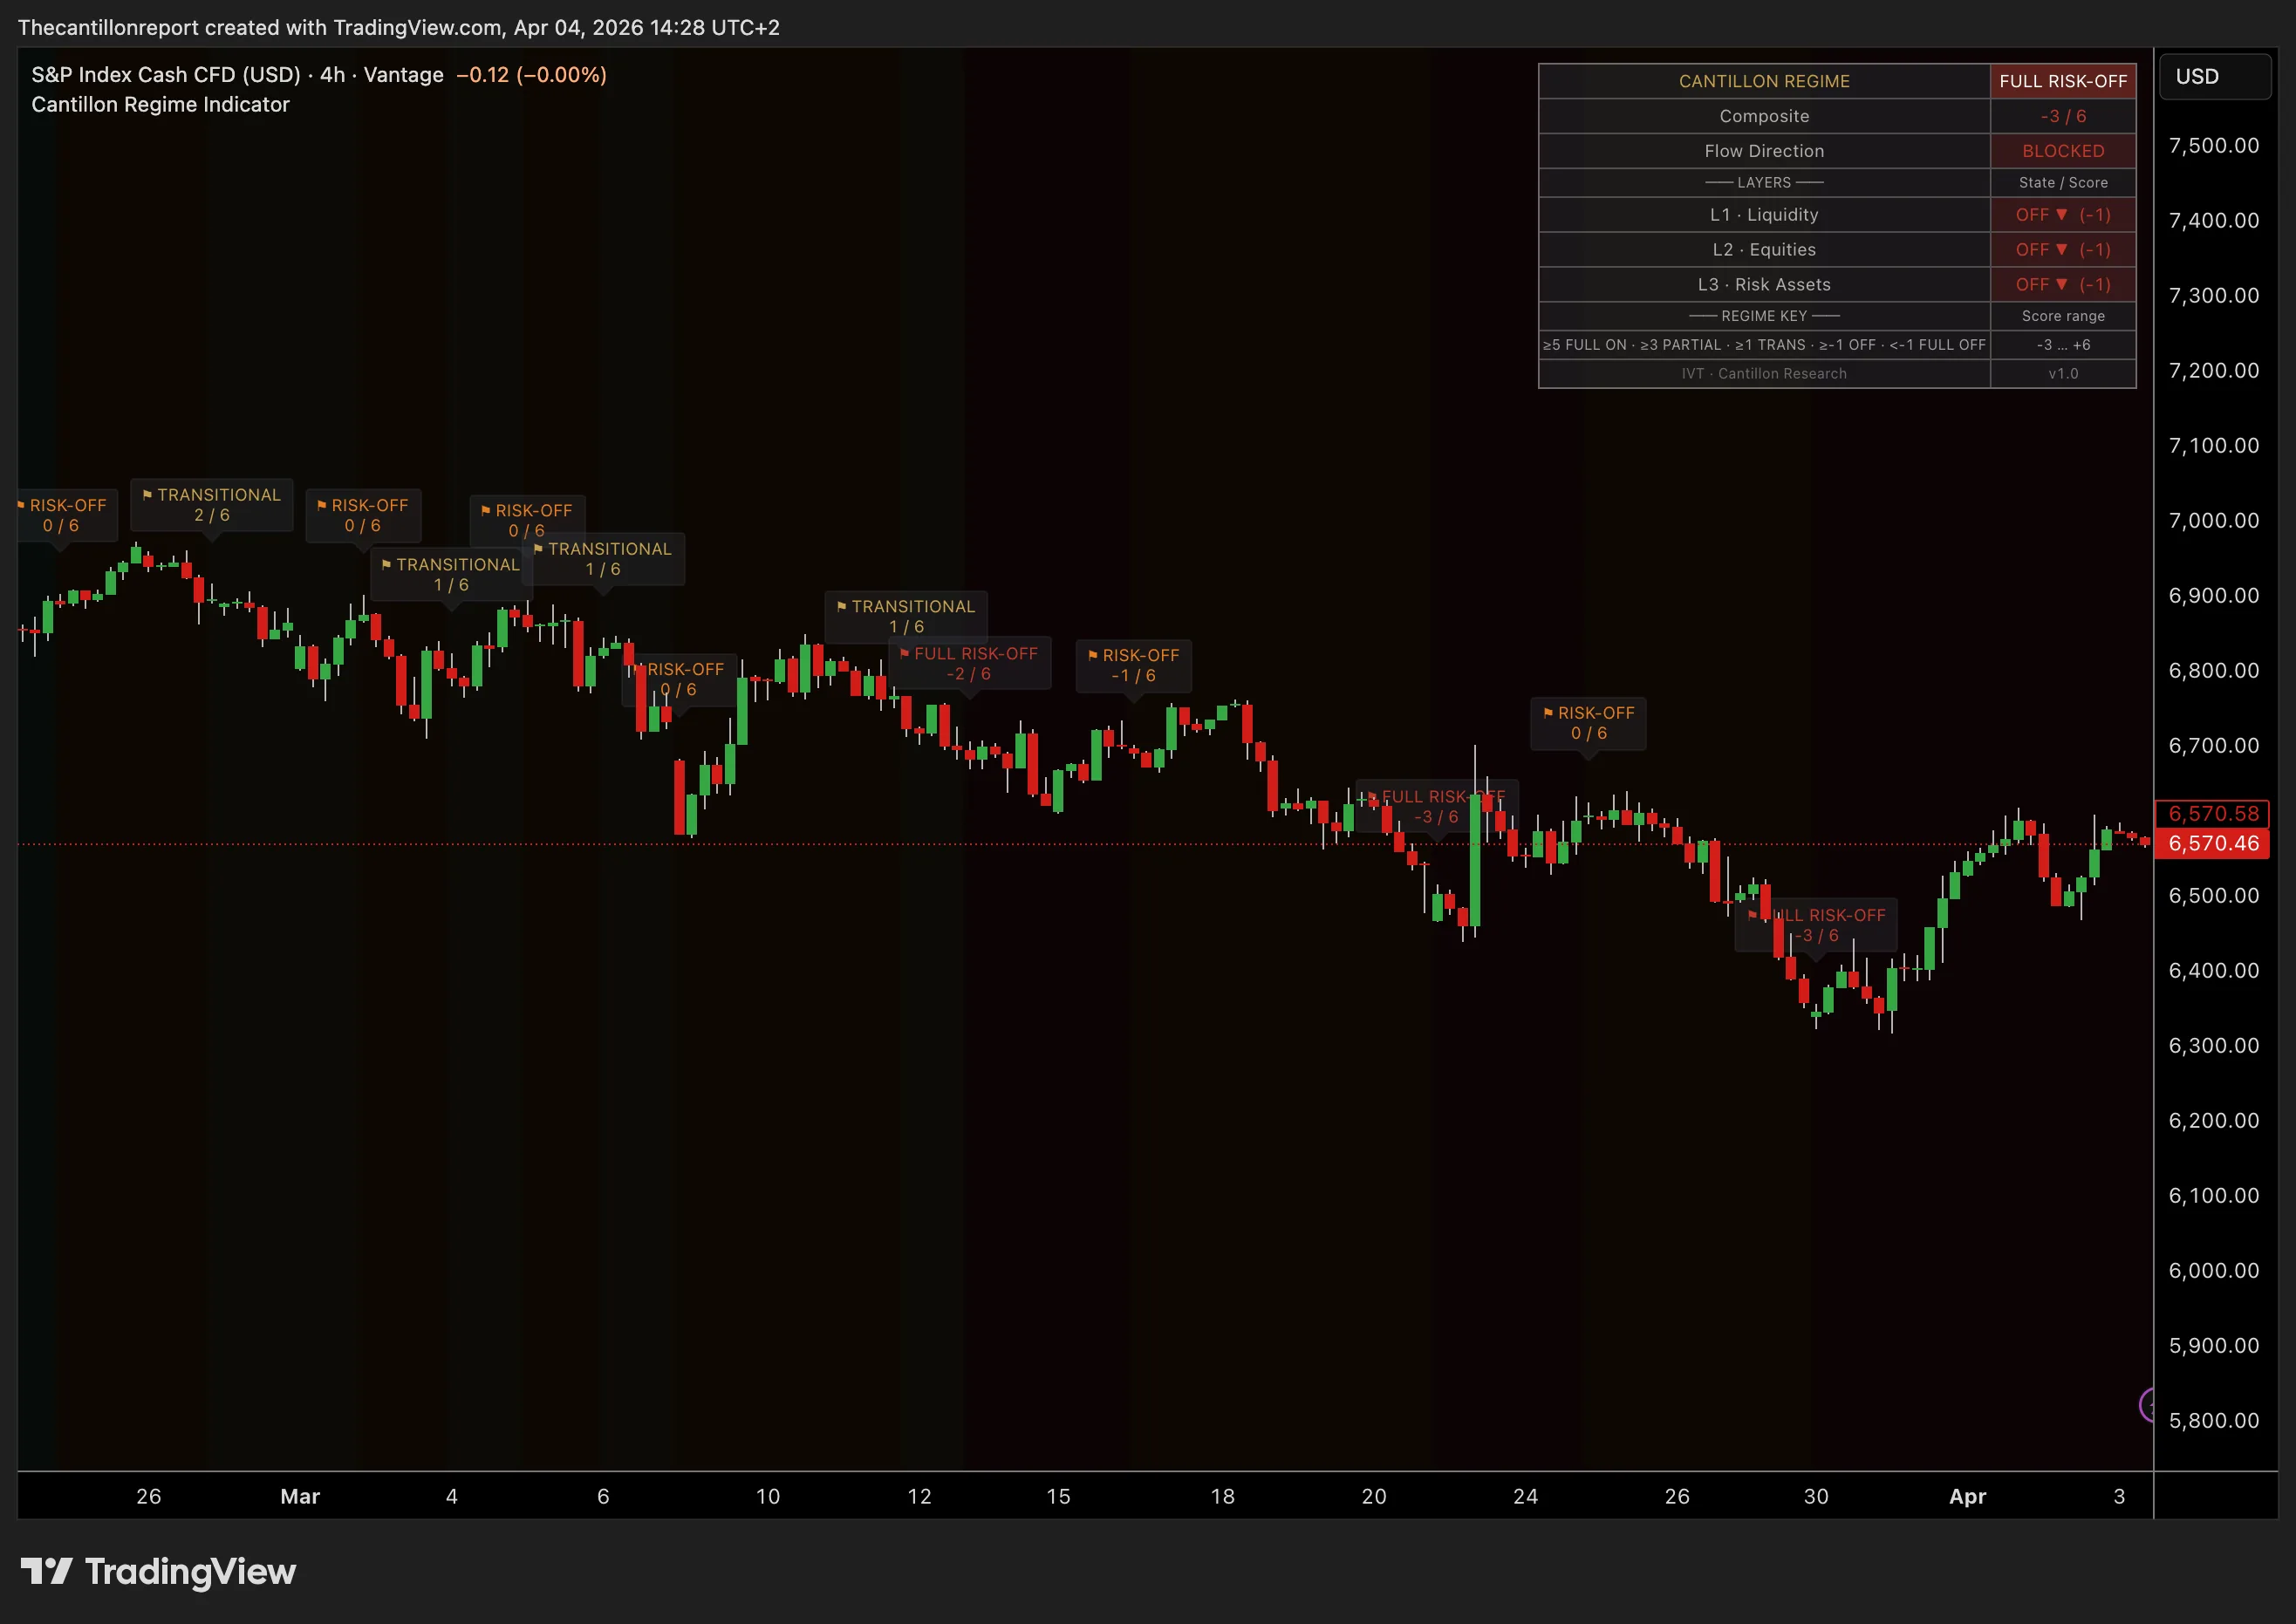
Cantillon Regime Indicator
Maps the three-layer Cantillon liquidity sequence on any chart. Bonds → Equities → Risk Assets. Each layer is scored and combined into a composite regime reading — background shading, transition labels, and a live dashboard show you where capital is flowing in real time.
New purchases are paused while this indicator moves to TradingView's own Marketplace. Everything already purchased stays valid for the period you paid for.
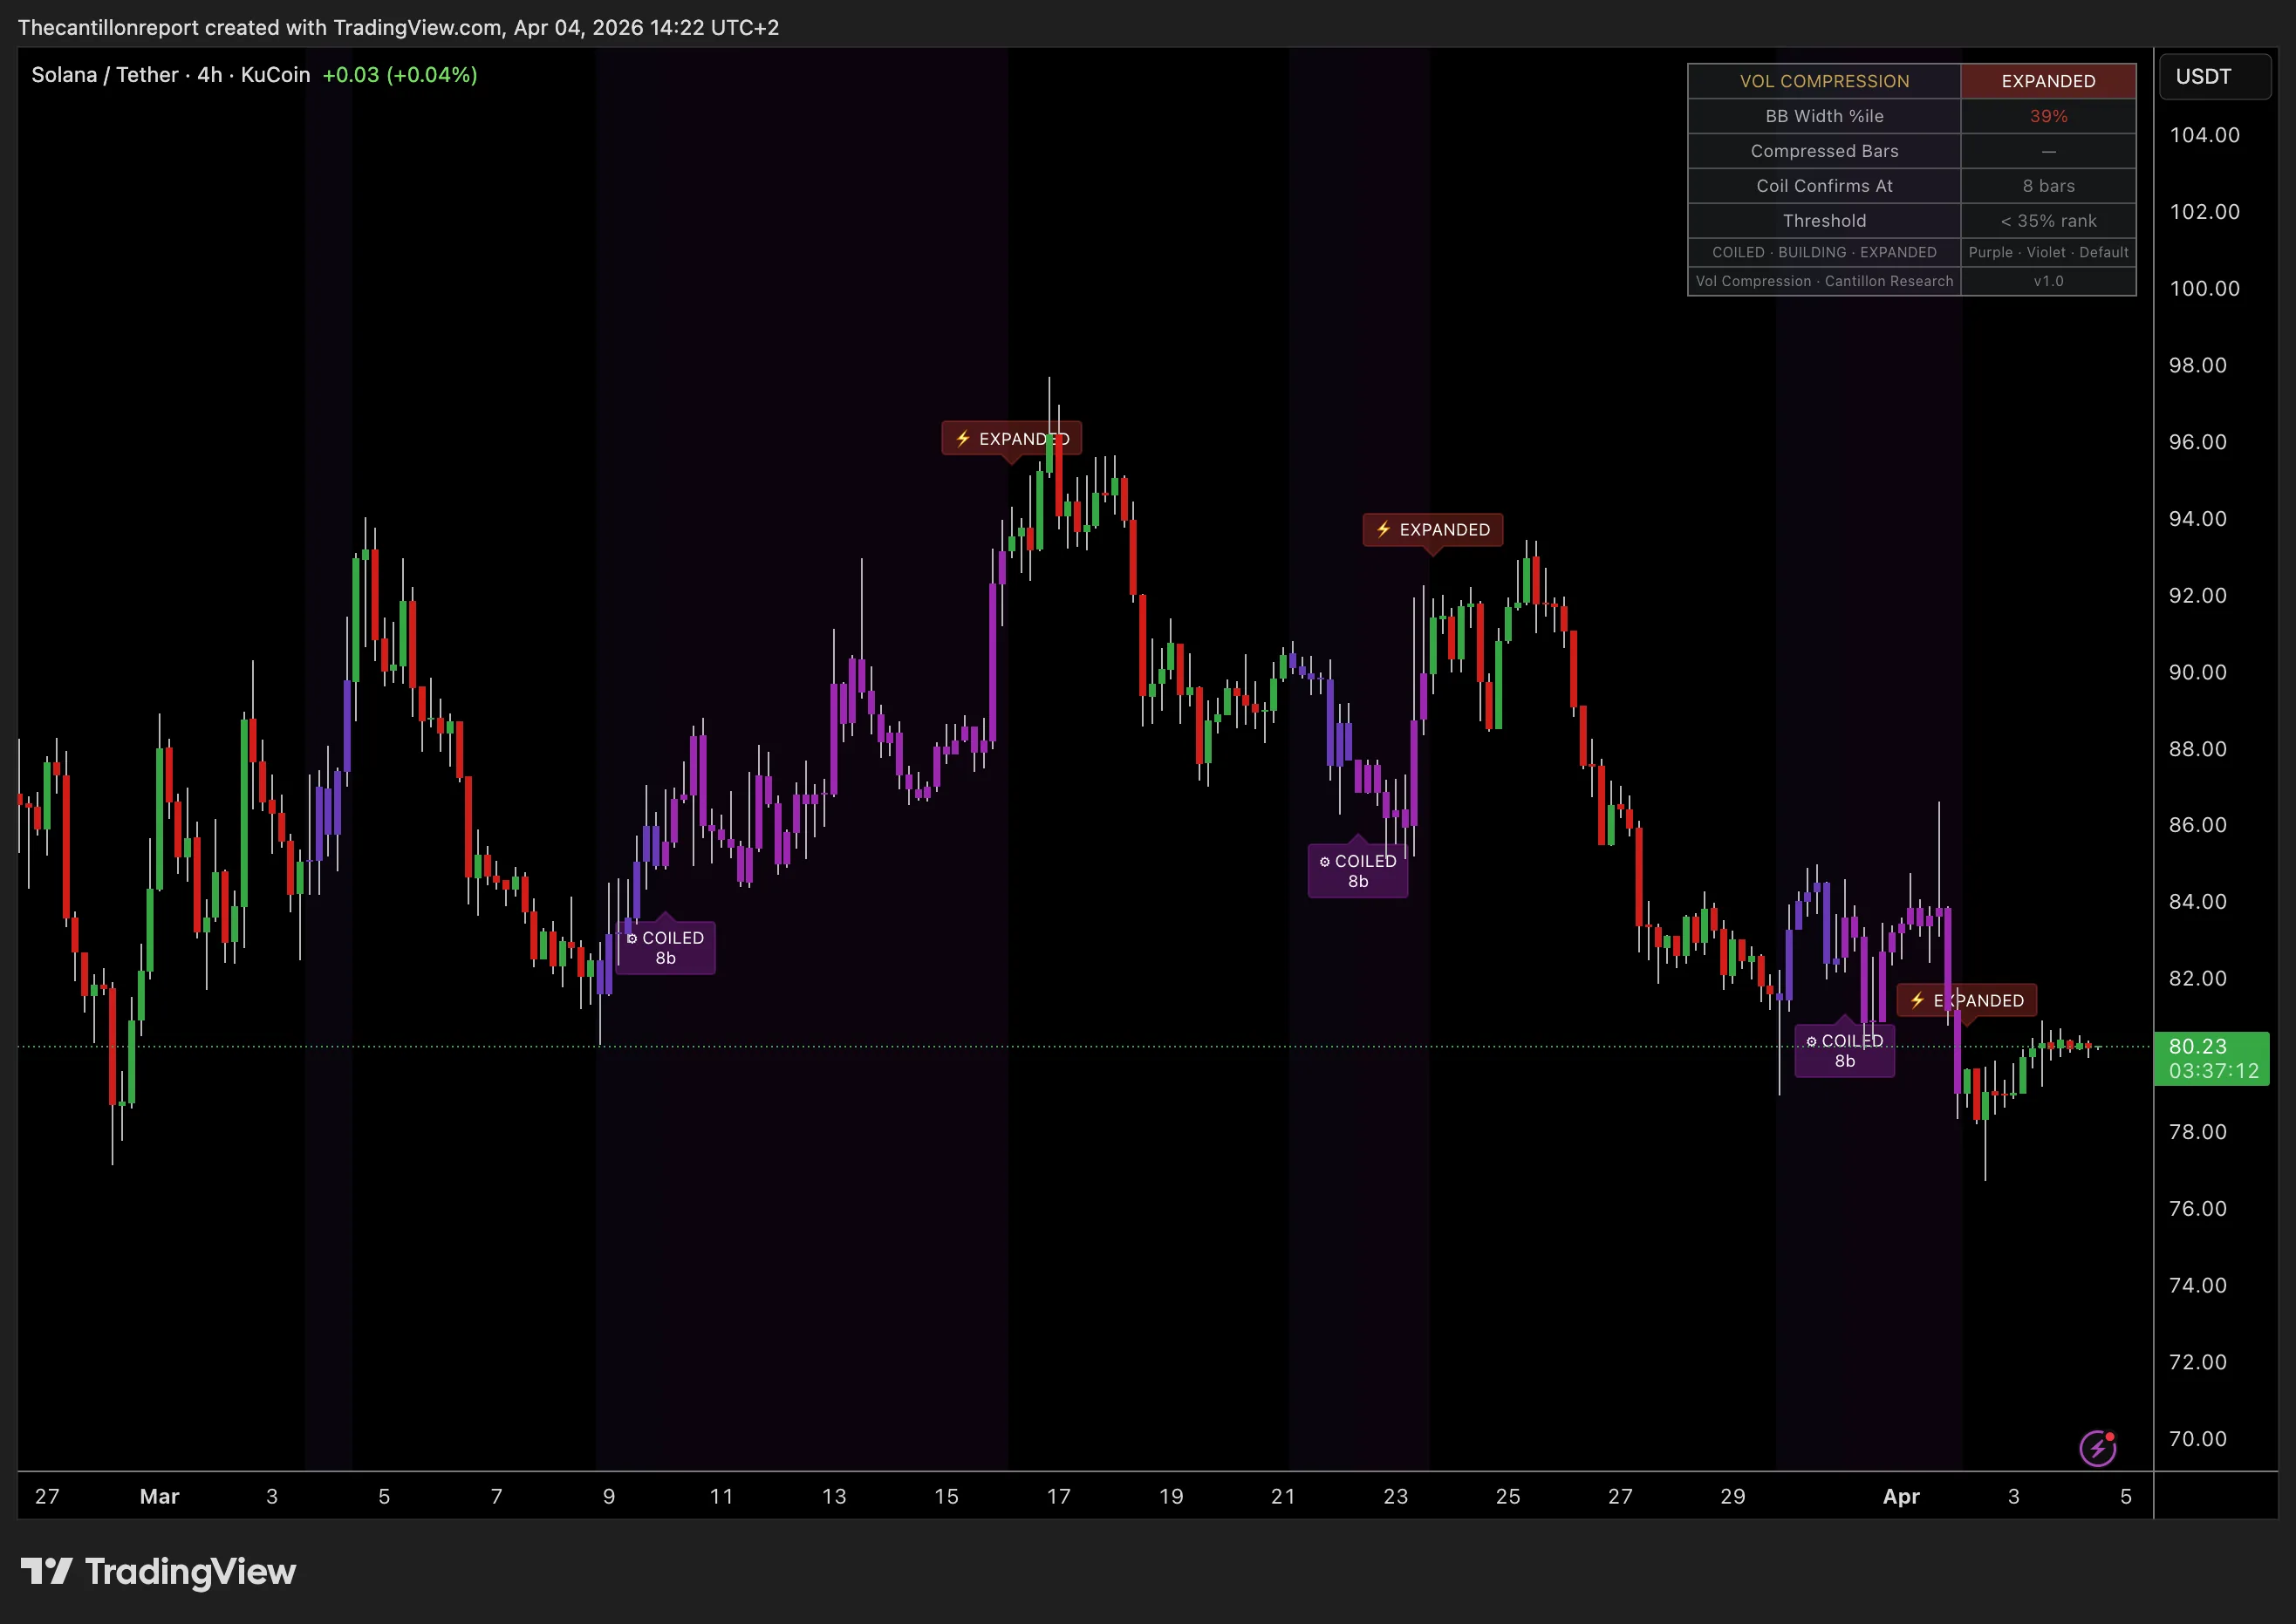
Vol Compression Scanner
Identifies when volatility is coiling before a breakout move. Bar painting and background shading mark three compression states — COILED, BUILDING, and EXPANDED — so you never miss a high-probability setup forming. Works on any instrument and timeframe.
New purchases are paused while this indicator moves to TradingView's own Marketplace. Everything already purchased stays valid for the period you paid for.
Both Indicators
Get the Cantillon Regime Indicator and the Vol Compression Scanner together. Regime state tells you the macro environment — vol compression tells you when to act. Used together, they form a complete institutional read of any market.
New purchases are paused while this indicator moves to TradingView's own Marketplace. Everything already purchased stays valid for the period you paid for.