Copa Fired. Banner Is Wound Tight.
Long yields had their biggest one-day drop since February, and five of sixteen charts came through with an amber light. Copa fired a tier 3 buy inside its window. Banner is coiled 96% on its line. Both are half size. The number is $132.70.
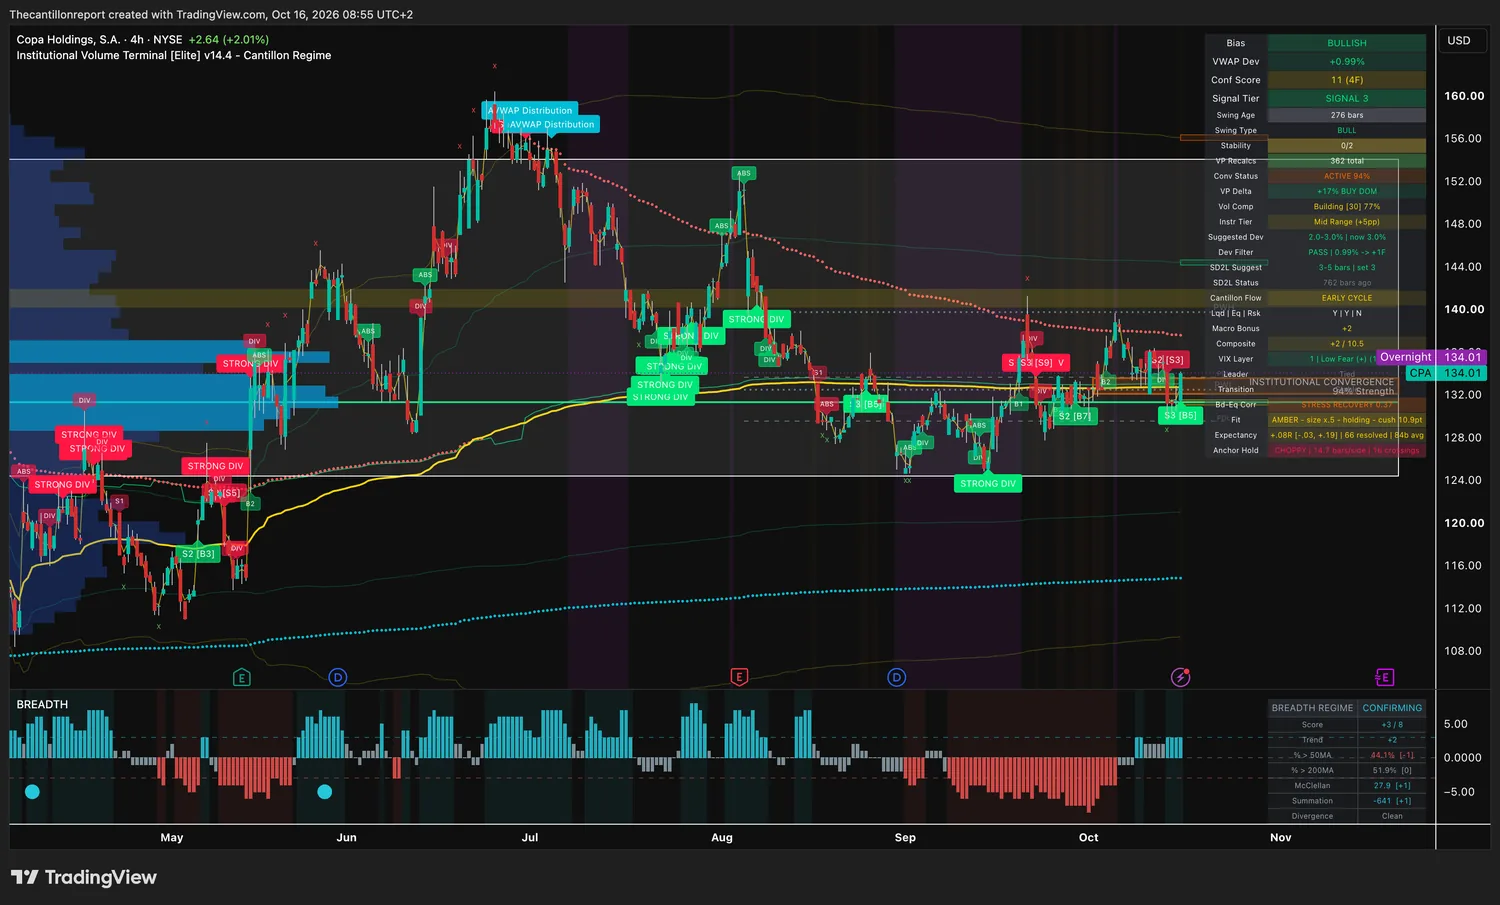
| Buy | CPA long, half size, at $136.68 or lower, while four-hour closes hold above $132.70. A tier 3 buy with four timeframes agreeing. |
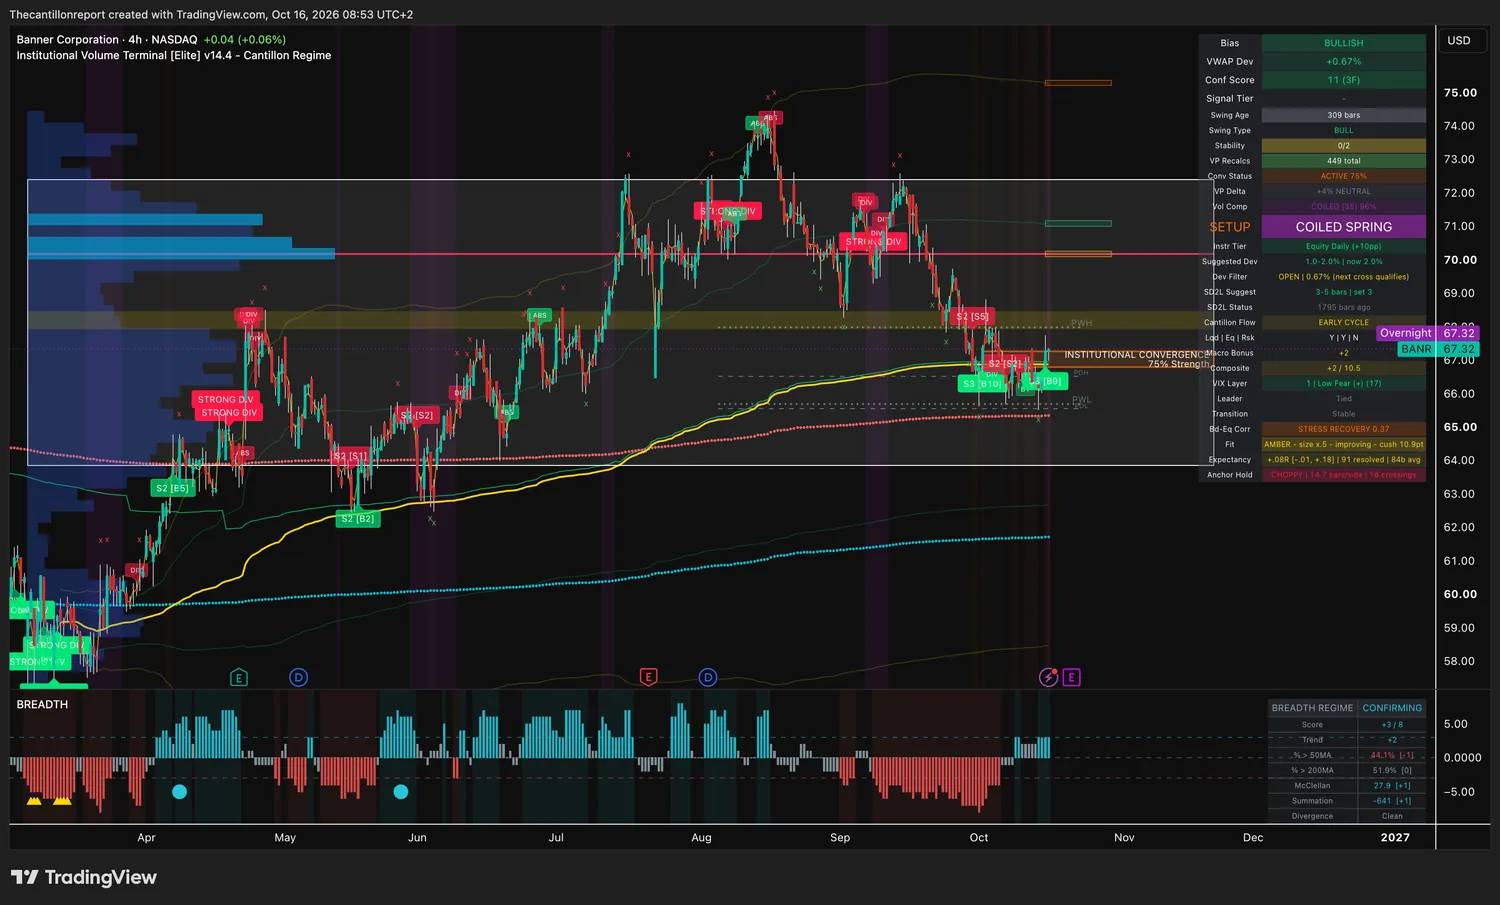
| Buy | BANR long, half size, at $68.21 or lower, while closes hold above $66.87. Coiled 96%, light improving. |
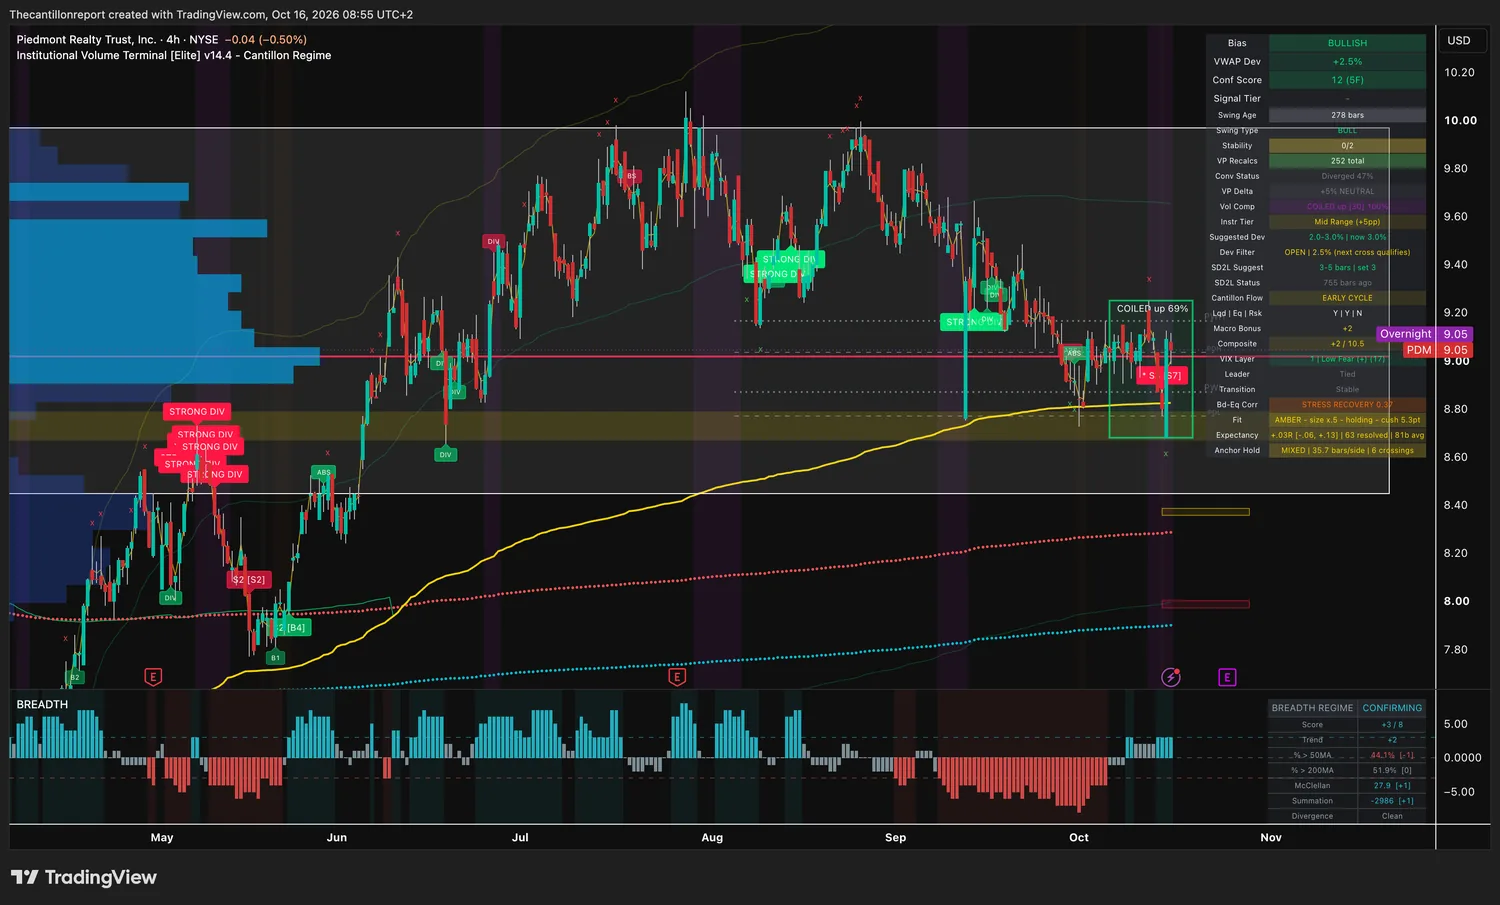
| Wait | PDM long. Wound to 100%, but four cents under the top of its window. Buy only at $9.09 or lower. |
| Wait | SPCX short. Inside its window at Thursday's close, then printed $153.01 overnight, back over its $151.21 line. |
| Skip | HIFS, PRI and all four indices. Ten of sixteen charts carry a red light, including two of the tightest coils on the scan. |
September producer prices jumped 1.3% on the month, the largest rise since March 2022. The 10-year yield fell anyway, more than 10 basis points to 5.09%, its biggest one-day drop since February, as money left chip stocks for Treasurys and defensive sectors. The Dow gained 1.08% to 52,177.69. The Nasdaq traded down more than 1% and finished up 0.08%.
- Record Quarter, Lower Stock TSMC printed its sixth record quarter in a row, profit up 68.7%, and the shares still fell as gross margin slipped to 66.4% from 67.7%.
- AI Credit Is Flashing CoreWeave's credit default swaps hit a record, pricing roughly 60% odds of default within five years.
Early Cycle held for a second session and the tailwind for longs stayed at +2. Strength slipped to +2 of 10.5 from +5, and risk appetite is still off. On the index charts bonds and stocks move apart at −0.6. On single stocks they move together at 0.37, just over the 0.35 stress line. So every trade below is half size.
The index panel swung back to Neutral, +2 of 8 from Diverging −3 on Thursday, and the stock charts read Confirming +3. 44.1% of stocks sit above their 50-day average, up from 35%, and 51.9% above their 200-day, up from 48.3%. Our own engine, run at 01:09 CEST on its watchlist, did not follow: 33 advancers, a net of −8, advance/decline 0.80, and a McClellan of −9.0, down from +7.4. Its summation index improved to −568 from −621.
| Index | The line | What it means this morning |
|---|---|---|
| S&P 500 CFD 7,758.10 | Inside | 0.96% over its 7,684 cost line, from 0.20%. Confirmation 3 on two frames. Red, improving, −.12R over 26. |
| Nasdaq 100 CFD 29,958.6 | Back over | 0.73% over its 29,741 line, from 0.12% under. Line crossed 18 times. Red, fading, +.01R over 115. |
| Dow CFD 52,261 | On it | 0.03% under its 52,277 line, from 1.27% under, pressed into the falling trendline with its averages converged at 89%. Red, fading, −.09R over 47. |
| Russell 2000 CFD 2,771.7 | Lost it | 3.92% under its 2,885 line, from 5.41%. The oversold snapback is active on two frames. Red, holding, −.02R over 37. |
Every capture was taken between 08:53 and 09:00 CEST, so every extended-hours price is an overnight print. Eleven of the twelve stocks printed on the same side of their line as Thursday's close. SpaceX did not: it closed 1.72% under its $151.21 line and printed $153.01 overnight, 1.19% over it. Allison printed $109.45, 2.91% under its line, on a red light. Every entry below is judged on the first four-hour close after the 15:30 CEST open, which lands at 19:30 CEST.
| # | Ticker | Dir | Why it is on this list | Size |
|---|---|---|---|---|
| 1 | CPA | Long | Ten weeks of base on its cost line, and a tier 3 buy fired on the last bounce with buyers in control of the volumeTier 3 buy · Conf 11 / 4 frames · building 77% · buyers 17% · +.08R over 66 signals, range −.03 to +.19 · amber, holding, 10.9-point cushion | Half |
| 2 | BANR | Long | Fell from $72 onto its line in September and has sat on it for three weeks, wound almost as tight as the terminal measuresConf 11 / 3 frames · coiled 96% · converged 75% · +.08R over 91 signals, range −.01 to +.18 · amber, improving, 10.9-point cushion | Half |
| 3 | PDM | Long | The highest confirmation on the scan, fully wound, but sitting at the top of its windowConf 12 / 5 frames · coiled 100% · +.03R over 63 signals, range −.06 to +.13 · amber, holding, 5.3-point cushion | Half |
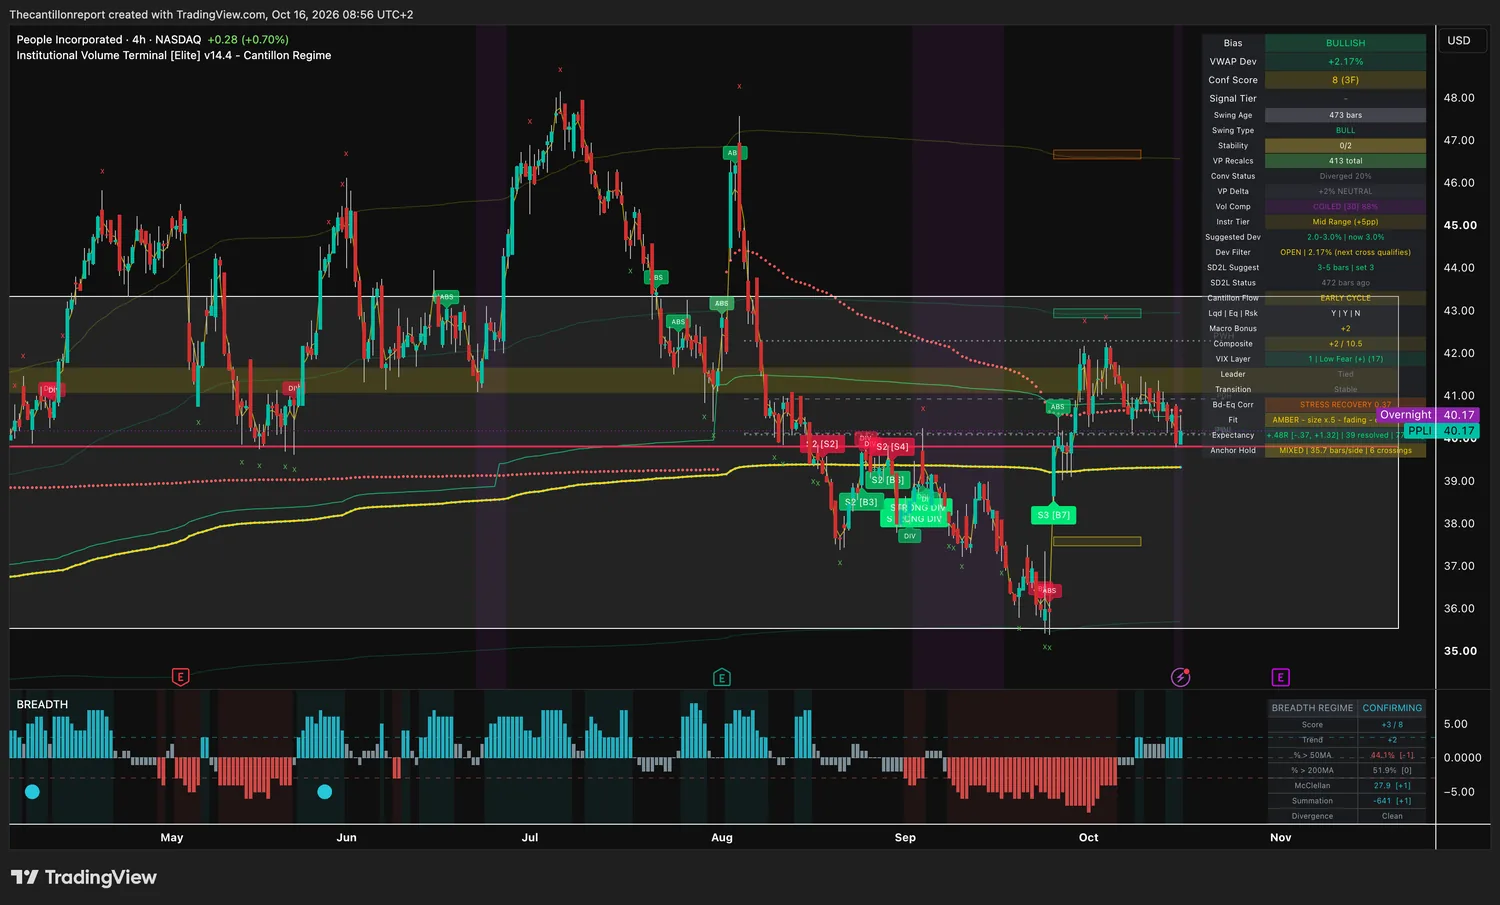
| 4 | PPLI | Long | Gapped from $37 to $41 at the start of October and has pulled back toward its line since. The best record on the scan, with the widest rangeConf 8 / 3 frames · coiled 88% · +.48R over 39 signals, range −.37 to +1.32 · amber, fading | Half |
| 5 | DEC | Short | Rallied from $13.30 to $14.90 in two weeks, rolled over, and slipped just under its line on a tier 1 sellTier 1 sell · Conf 4 / 2 frames · expanded 33% · +.04R over 45 signals, range −.04 to +.11 · amber, holding | Half |
| # | Name | Side | Entry (distance · price) | Trigger | Get out at | Size |
|---|---|---|---|---|---|---|
| 1 | CPA | Long | +0.99% · $134.01 band $132.70–$136.68 | 4h close above $132.70 after the open, filled at $136.68 or lower | $127.90 | Half |
| 2 | BANR | Long | +0.67% · $67.32 band $66.87–$68.21 | 4h close above $66.87 after the open, filled at $68.21 or lower | $65.20 | Half |
| 3 | PDM | Long | +2.50% · $9.05 band $8.83–$9.09 | 4h close above $8.83, filled at $9.09 or lower | $8.62 | Half |
| 4 | PPLI | Long | +2.17% · $40.17 band $39.32–$40.50 | 4h close above $39.32, filled at $40.50 or lower | $38.80 | Half |
| 5 | DEC | Short | −0.24% · $14.44 band $14.47–$14.04 | First 4h close after the open under $14.47, filled at $14.04 or higher | $14.95 | Half |
Copa closed Thursday at $134.01 and printed the same overnight, $1.31 above its line. Four-hour closes over $132.70 keep the tier 3 buy live. A close under it puts Copa back inside a ten-week range with no signal, and you wait.
This one is free. The other four this week were not.
Every level, every execution block and all 16 terminal captures, with no gate anywhere on the page. Monday through Thursday the entry levels sit behind the member wall. Every Friday the whole thing ships open.
What you are doing: buying a Panama airline that has based on the price large money paid since August, now that a buy signal has fired on its latest bounce.
What you are doing: buying a regional bank sitting on its cost line with its range wound almost as tight as it goes, on the bet that the stored pressure releases upward.
What you are doing: buying an office landlord out of a fully wound range, but only at a price inside the window, not at the overnight print.
| Name | Distance from cost | Comes back at | Why it is not a trade |
|---|---|---|---|
| SPCX | −1.72%, overnight +1.19% | Window open, $146.67 edge | The short closed inside its window, then the overnight print crossed back over the line. Swing reads bear, confirmation 5 on two frames, 1 of 20 signals. Wait for a close back under. |
| HIFS | +1.36% | Window open, $299.36 edge | Coiled 93% with confirmation 11. Red, improving, −.30R over 22 and a −29.9-point cushion. |
| PRI | +0.91% | Window open, $283.98 edge | Coiled 84% on its $278.42 line, confirmation 10. Red, holding, +.01R over 36. |
| ISRG | +0.40%, overnight +0.21% | Window open | Back over its $426.22 line from 2.48% under a week ago, but the swing still reads bear. Red, fading, −.01R over 25. |
| FTS | +0.97% | Window open, C$78.33 edge | Ran from C$75 to its line in a week. Red, holding, .00R over 124, a 0.7-point cushion. |
| CPK | −0.17% | Window open | Bearish with confirmation 11 on five frames. Red, −.13R over 147, a −17.3-point cushion. |
| ALSN | −0.19%, overnight −2.91% | Window open | Confirmation 3 on one frame, expanded 34%. Red, .00R over 50. |
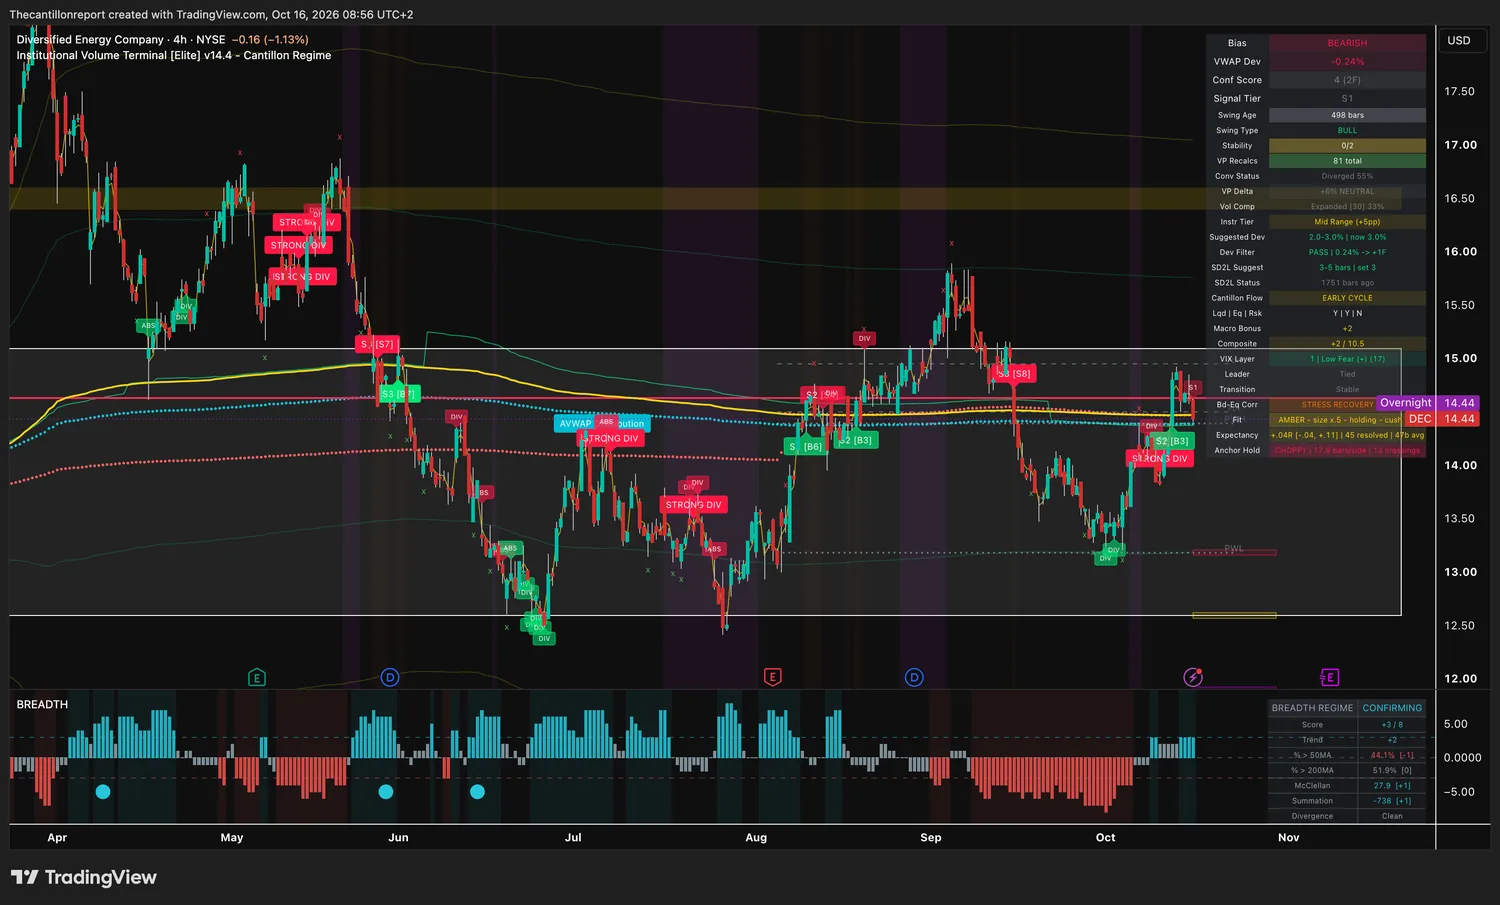
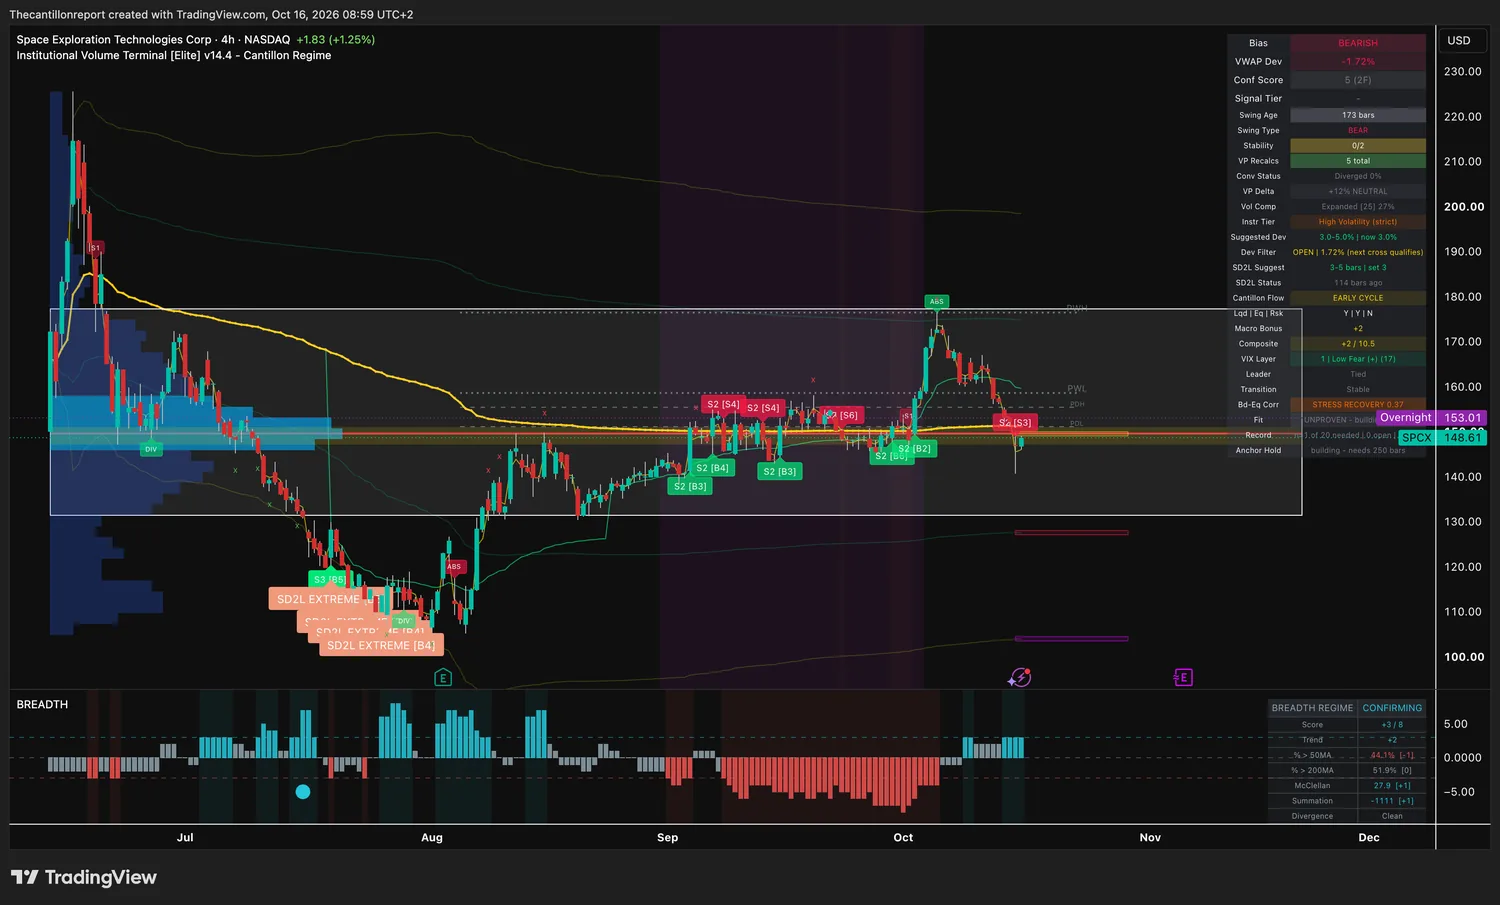
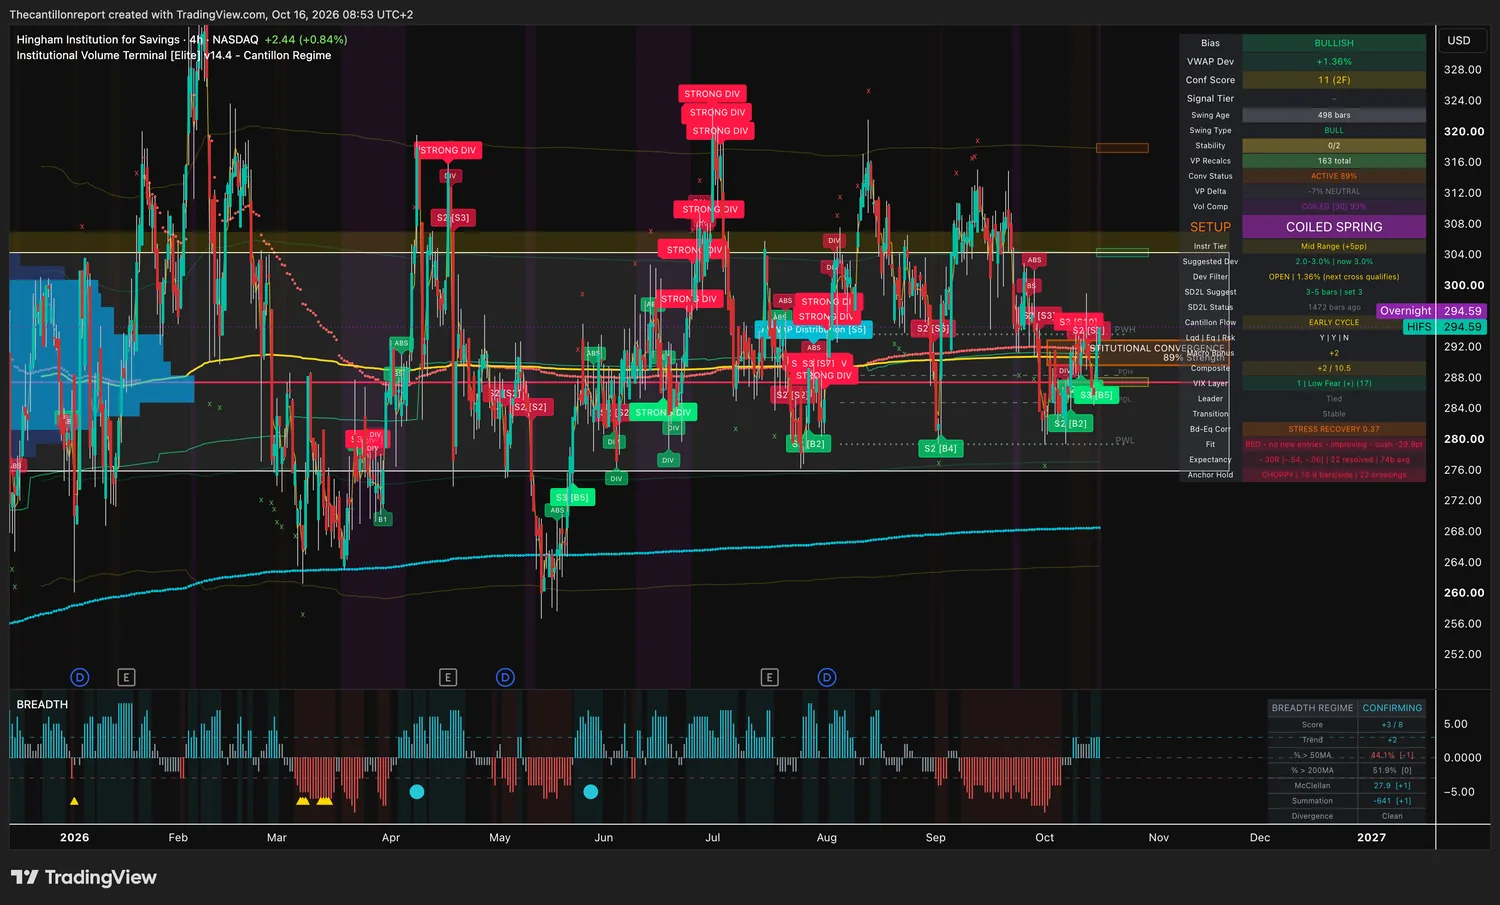
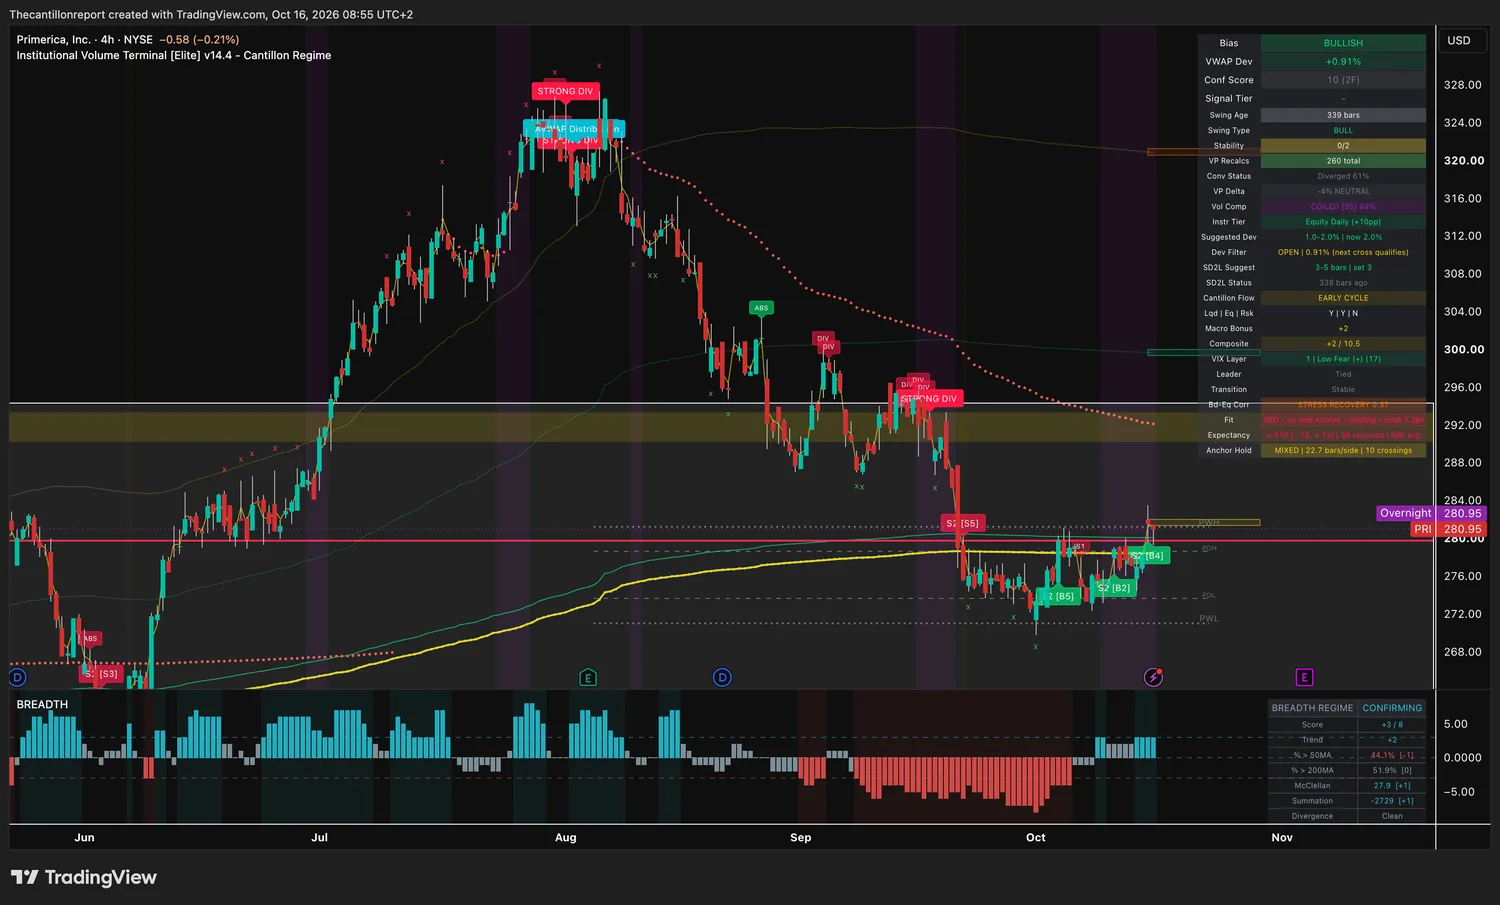
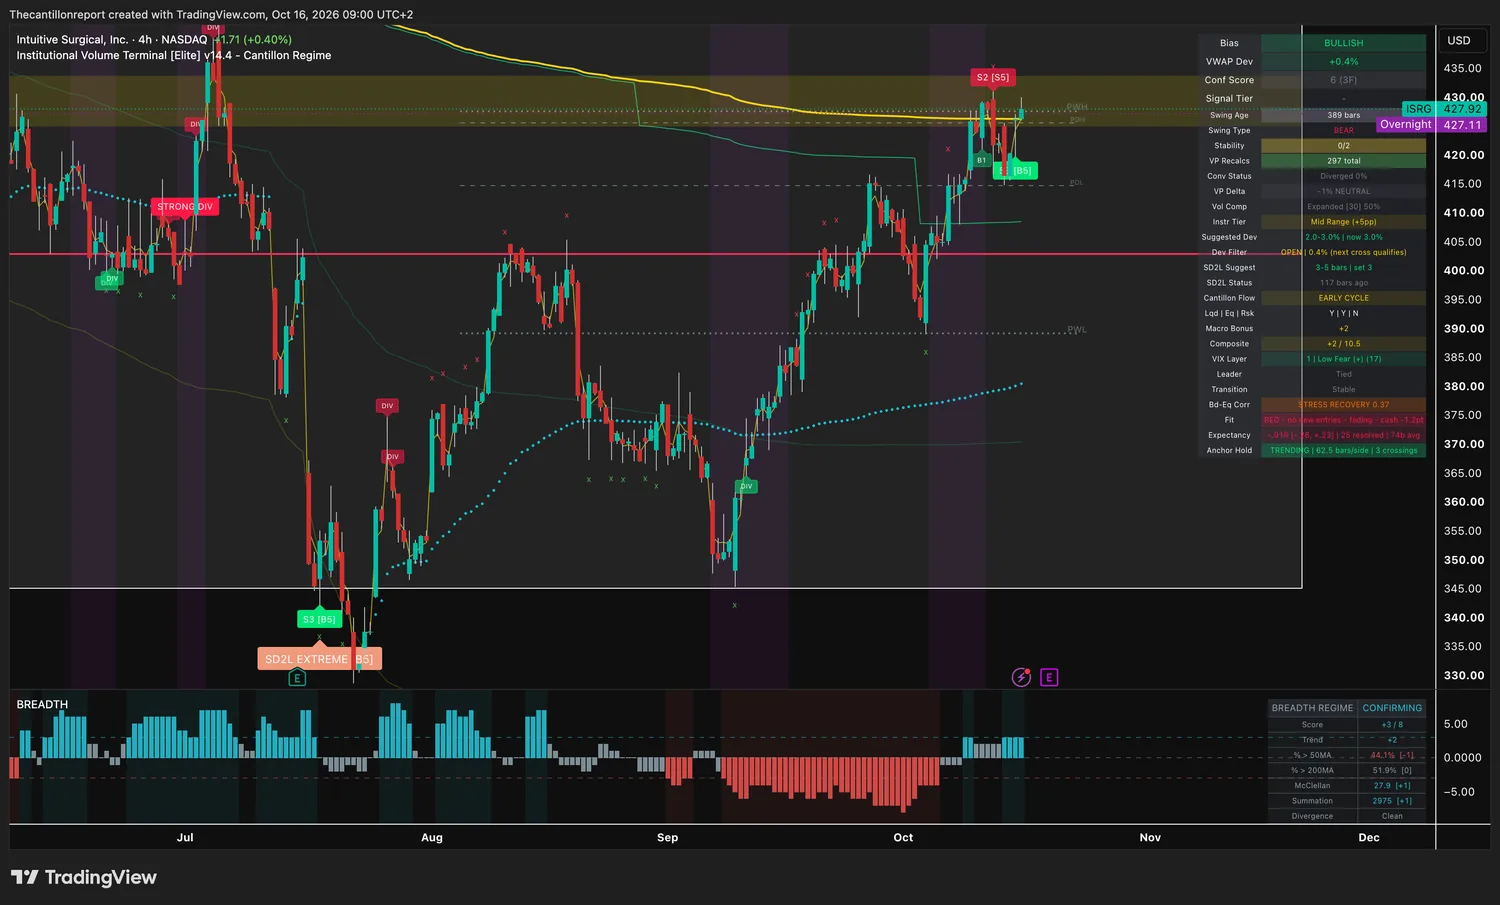
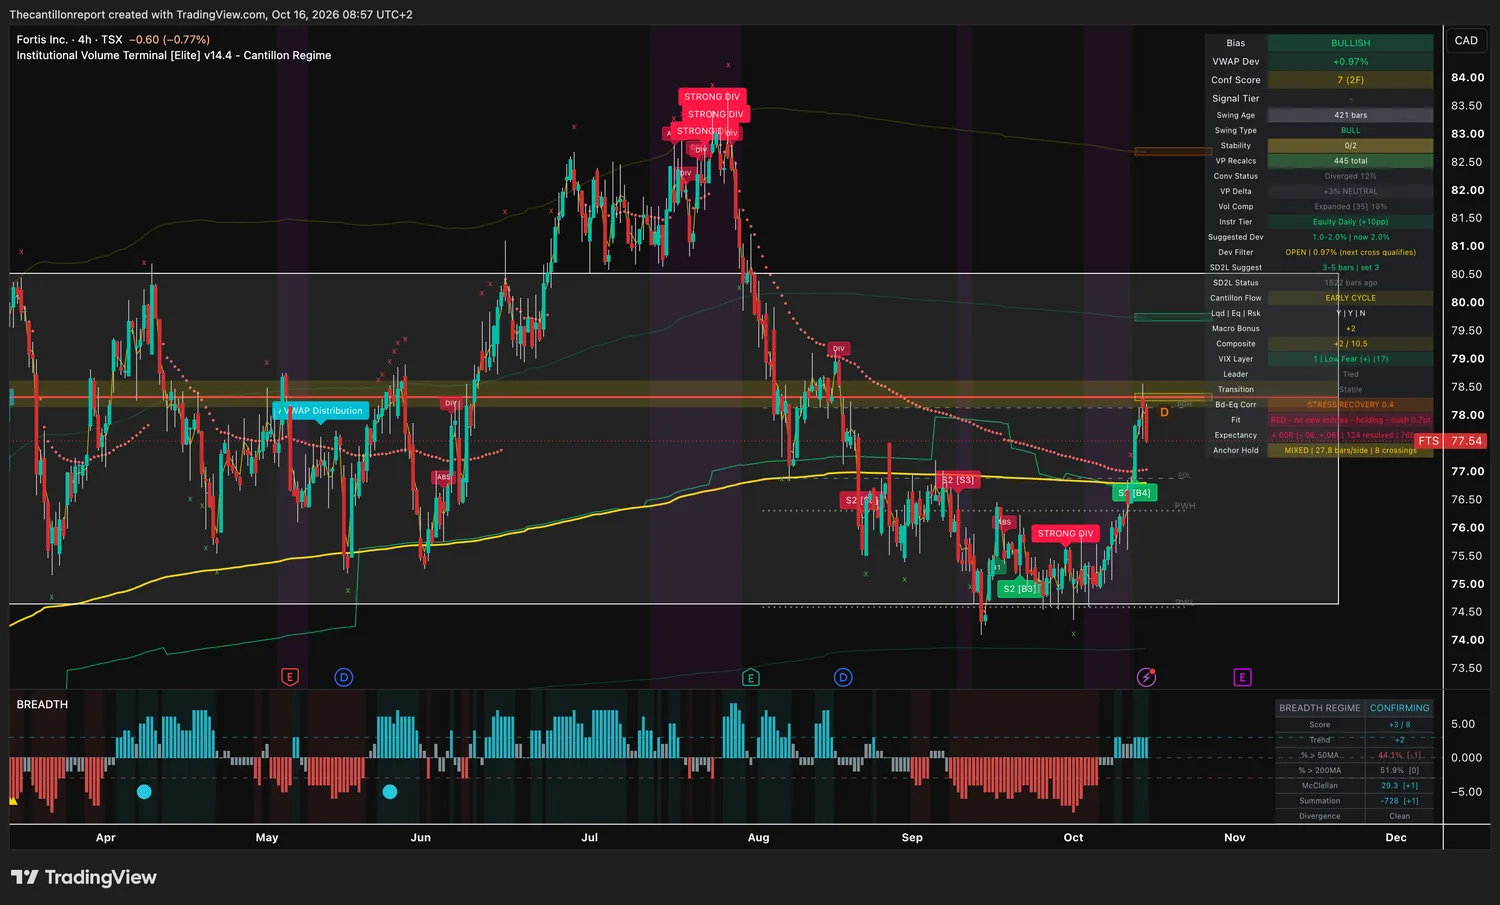
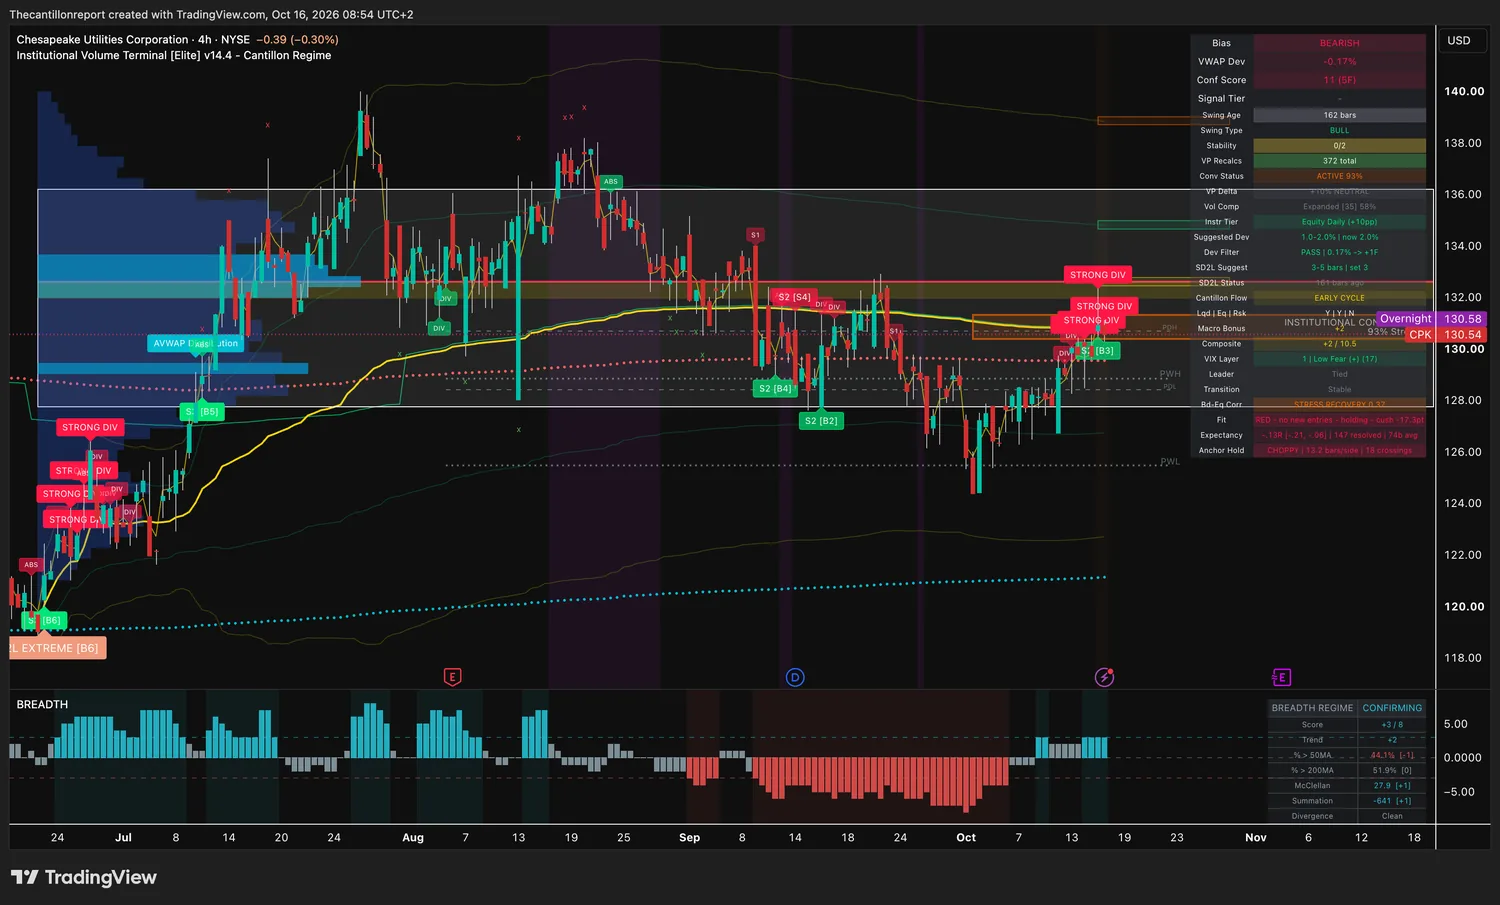
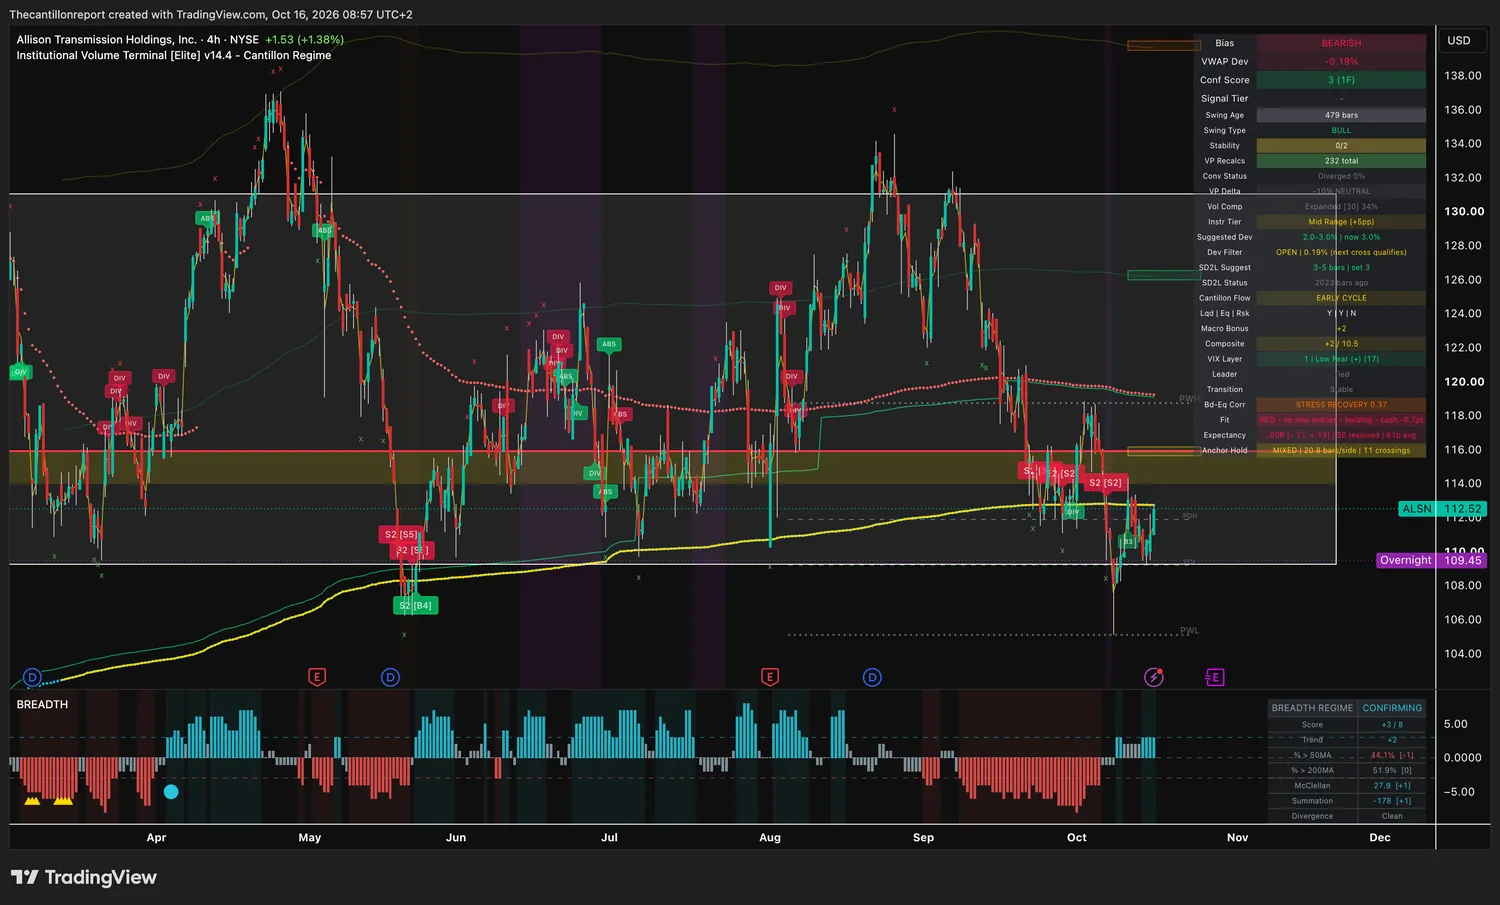
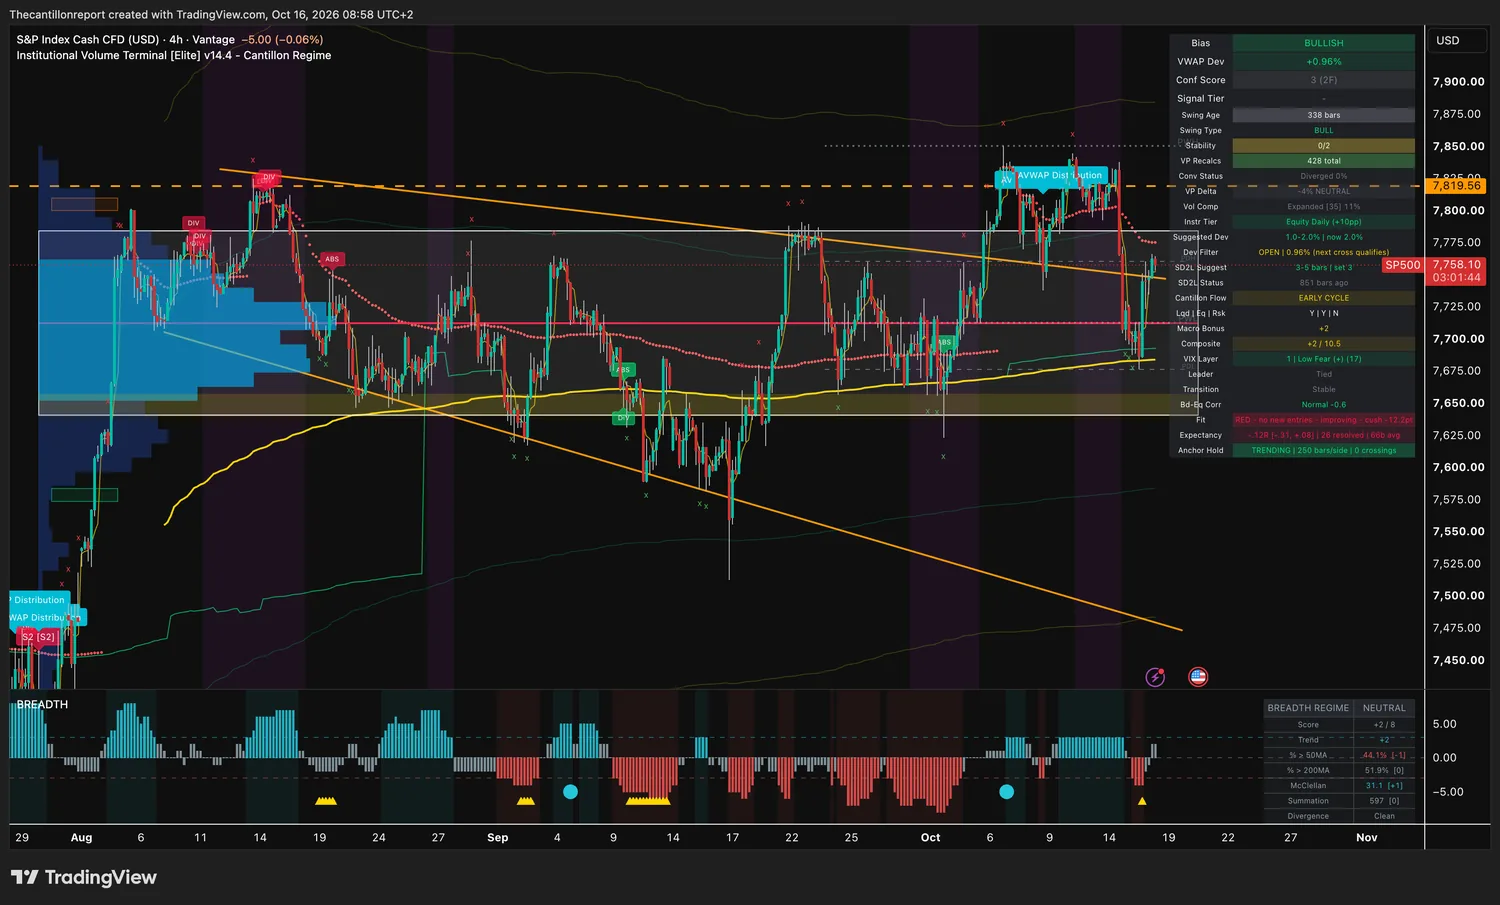
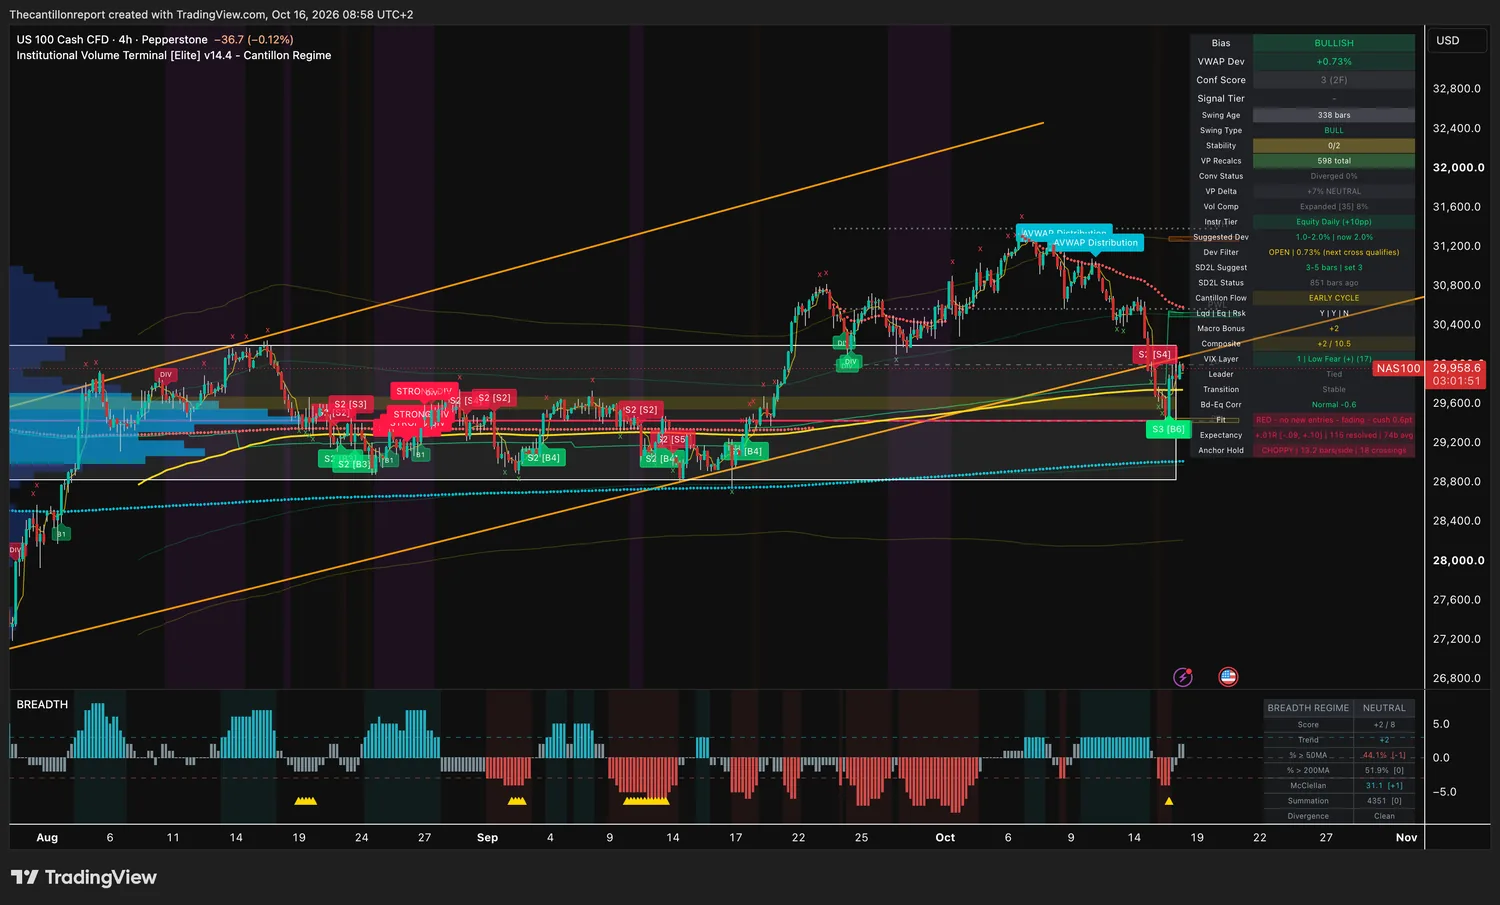
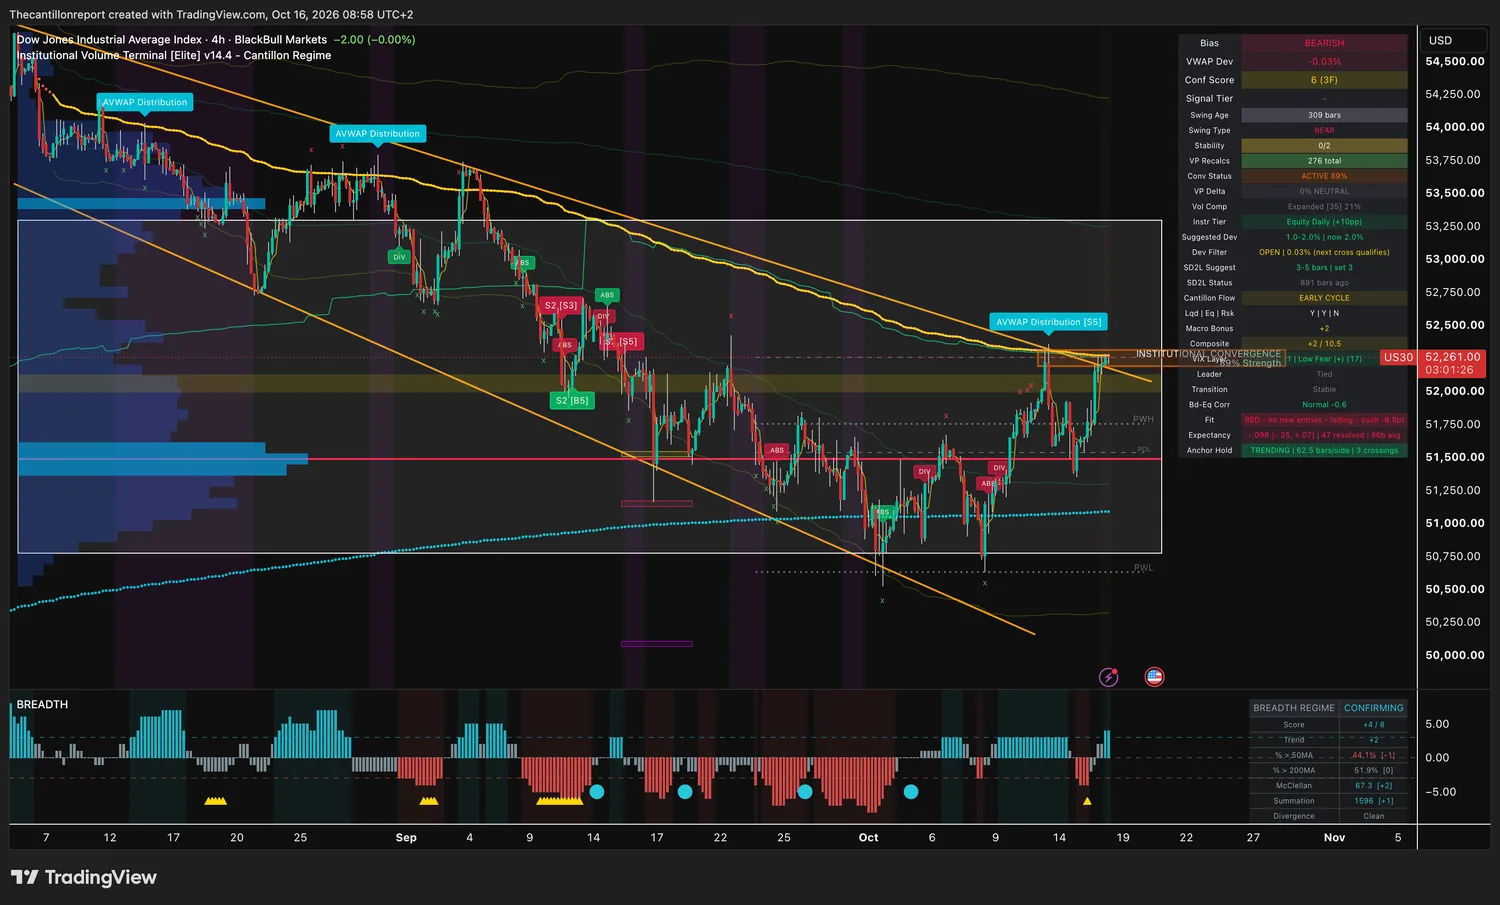
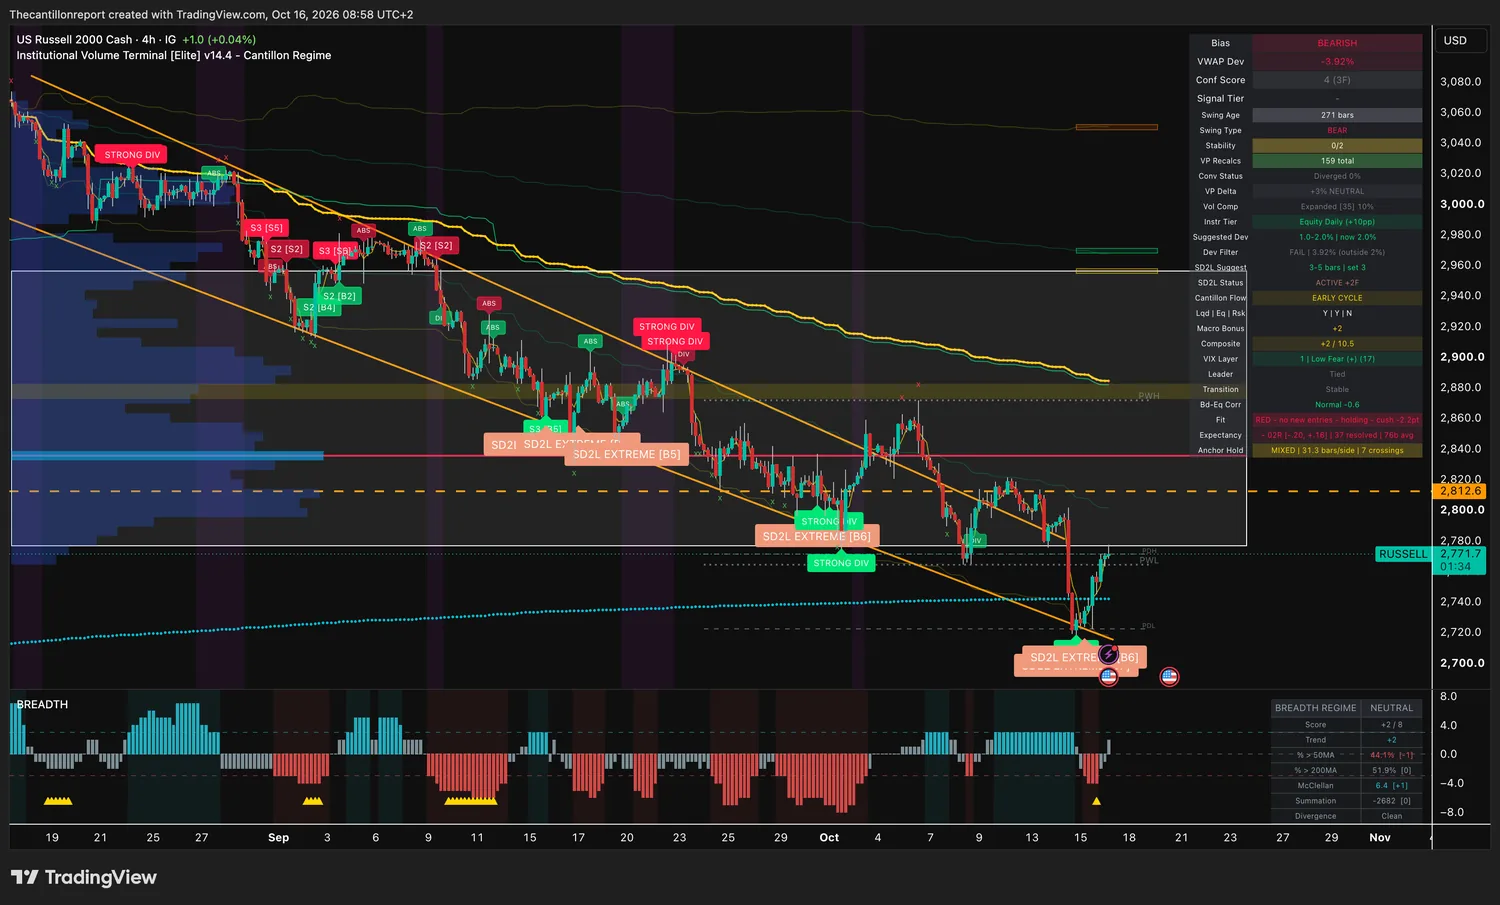
Cost line (the anchor) · the volume-weighted price large money actually paid over the current swing. Everything in this brief is measured as distance from it. Buy near it and you are paying what they paid. Buy far above it and you are paying their profit. Entry window · how far from the cost line a new entry can still be sensibly priced. Inside it, the entry is fairly priced. Past it, the move has already run and you wait for a pullback. Compression · how tightly the range has wound, from 0 to 100%. High means the next move should be a big one. It says nothing about direction, and it never overrides a shut window. Confirmation · how many independent readings agree, and across how many timeframes. Higher on both counts is better. Record · the average result per signal in units of risk, where being stopped out is exactly −1.00. Always published with the number of finished signals behind it, and measured over the same history the settings were chosen on. Below 20 finished signals no rate is published. A short record is not a verdict on the chart, only on what can be measured yet. Trend light · green means full size, amber means half, red means no new entry however good the chart looks. A chart with no light yet, because its record is still being built, is sized at half.
Readings captured Friday 16 October 2026 between 08:53 and 09:00 CEST from the IVT v14.4 terminal, on four-hour bars that had not yet closed. Prices marked overnight are extended-hours prints. US exchanges open at 15:30 CEST. Cost lines and window edges are derived from the terminal's published percentage distances. Index levels are CFD feeds and differ from the cash index. Fortis trades in Canadian dollars.
Records are in-sample and forecast nothing. No rate is published on fewer than twenty finished signals, and the sample size is printed beside every one.
Charts are unmodified terminal captures provided for reference, not as entry instructions. Educational content only. Not financial advice. Past results do not predict future ones.