No Record Is Not A No. Veralto Leads Without One.
Four charts on this scan have almost no trading record behind them, and the best of them is still a trade. Veralto sits $1.13 above its cost line with confirmation 9 and seven finished signals. The dollar-yen long waits on payrolls and one number: 158.50.
| Buy | VLTO and HIMS long, half size, inside their entry windows now. Seven and eleven finished signals. Thin records, real charts. |
| Wait | USDJPY long, half, on a 4-hour close above 158.50. The jobs number decides it. |
| Wait | SPCX short, half, on a 4-hour close below $147.30. The most confirmation on the scan and no record at all. |
| Skip | CEVA, for a second day. Amber light, but the volume on a short still leans 18% to buyers. |
| Avoid | CTVA. Its −78% reading is Thursday's spin-off, not a signal. |
September payrolls print at 14:30 CEST. Consensus sits at 93,000 jobs and 4.1% unemployment, after August's 162,000 ran through a 58,000 forecast. The 10-year Treasury touched 5.34% on Thursday, its highest since 2002, and jobless claims fell for a fourth week to 197,000. A hot number lands on a bond market already at its limit, which is why the bond layer of the terminal stays off.
- Corteva Splits In Two Corteva spun off its seed business as Vylor on Thursday and the stock fell about 82% as that value left it. The −78% distance on the CTVA chart below is the spin-off, not a collapse.
- SpaceX Gets Heavier Its weight in the Nasdaq 100 rose to 2.82% from 1.28% in September's rebalance. It only listed this summer, which is why the record panel on its chart still has nothing to show.
Same as Thursday on every capture. Stocks and risk on, bonds off, strength +1 of 10.5, one step from flat. Bonds and stocks move together at 0.56 on US names and 0.73 on the yen, so a Treasury hedge still covers little.
The terminal's broad-market panel still reads Diverging, −7 of 8. It moved the right way, though. 22.9% of stocks sit above their 50-day average, up from 20.9% on Thursday, and 41.2% above their 200-day, up from 40.6%. The McClellan oscillator climbed to −28 from −41.4. Better. Not good. Nothing on the Board goes above half size.
| # | Ticker | Dir | Why it is on this list | Size |
|---|---|---|---|---|
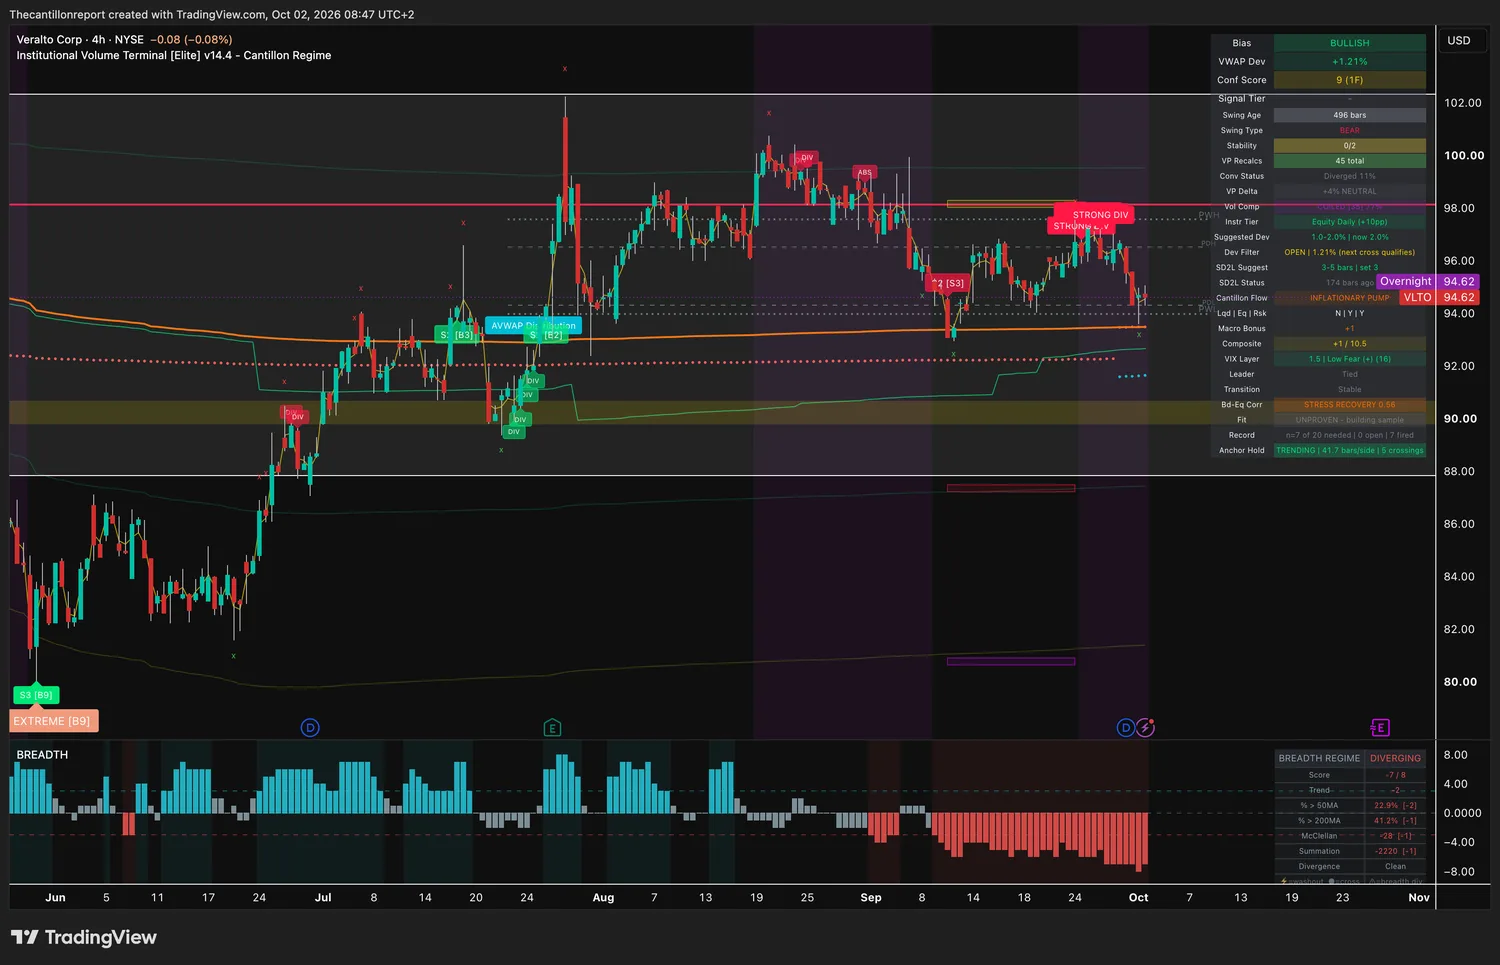
| 1 | VLTO | Long | Sitting just above the price large money paid, wound tight, and its cost line has only been crossed five timesConf 9 / 1 frame · coiled 77% · record: 7 of 20 signals, no rate · no light yet | x0.5 |
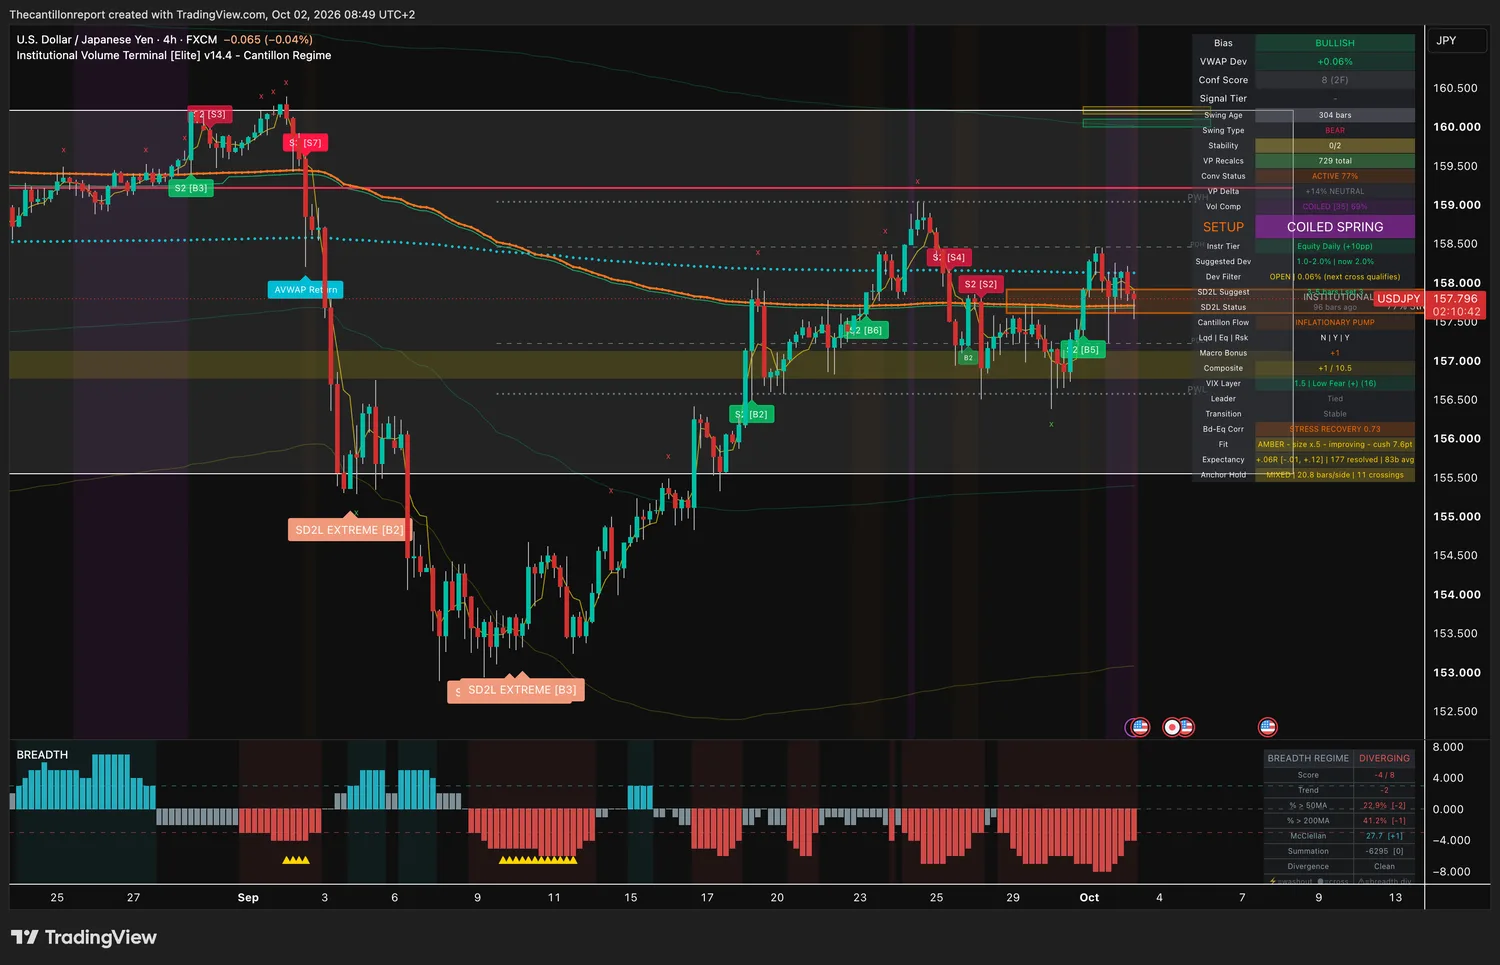
| 2 | USDJPY | Long | Coiled on its cost line with the only record on the Board that is long enough to readConf 8 / 2 frames · coiled spring 69% · +.06R over 177 signals · amber, improving, 7.6-point cushion | x0.5 |
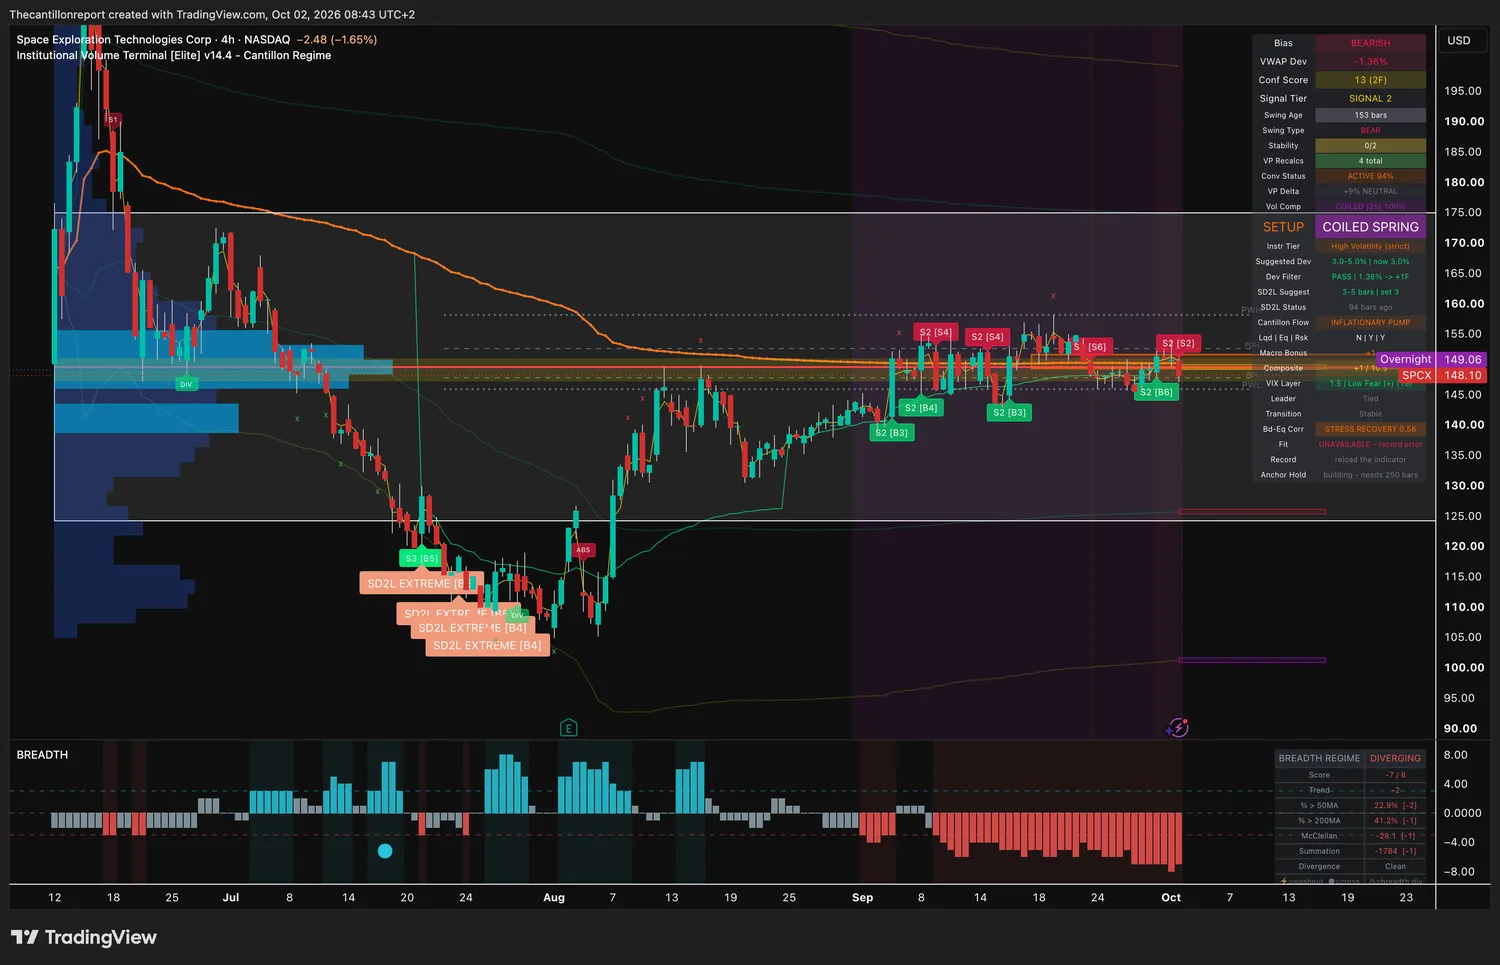
| 3 | SPCX | Short | A tier 2 sell from a range wound to the maximum, on the strongest agreement anywhere on the scanConf 13 / 2 frames · coiled spring 100% · convergence 94% · record panel error · no light | x0.5 |
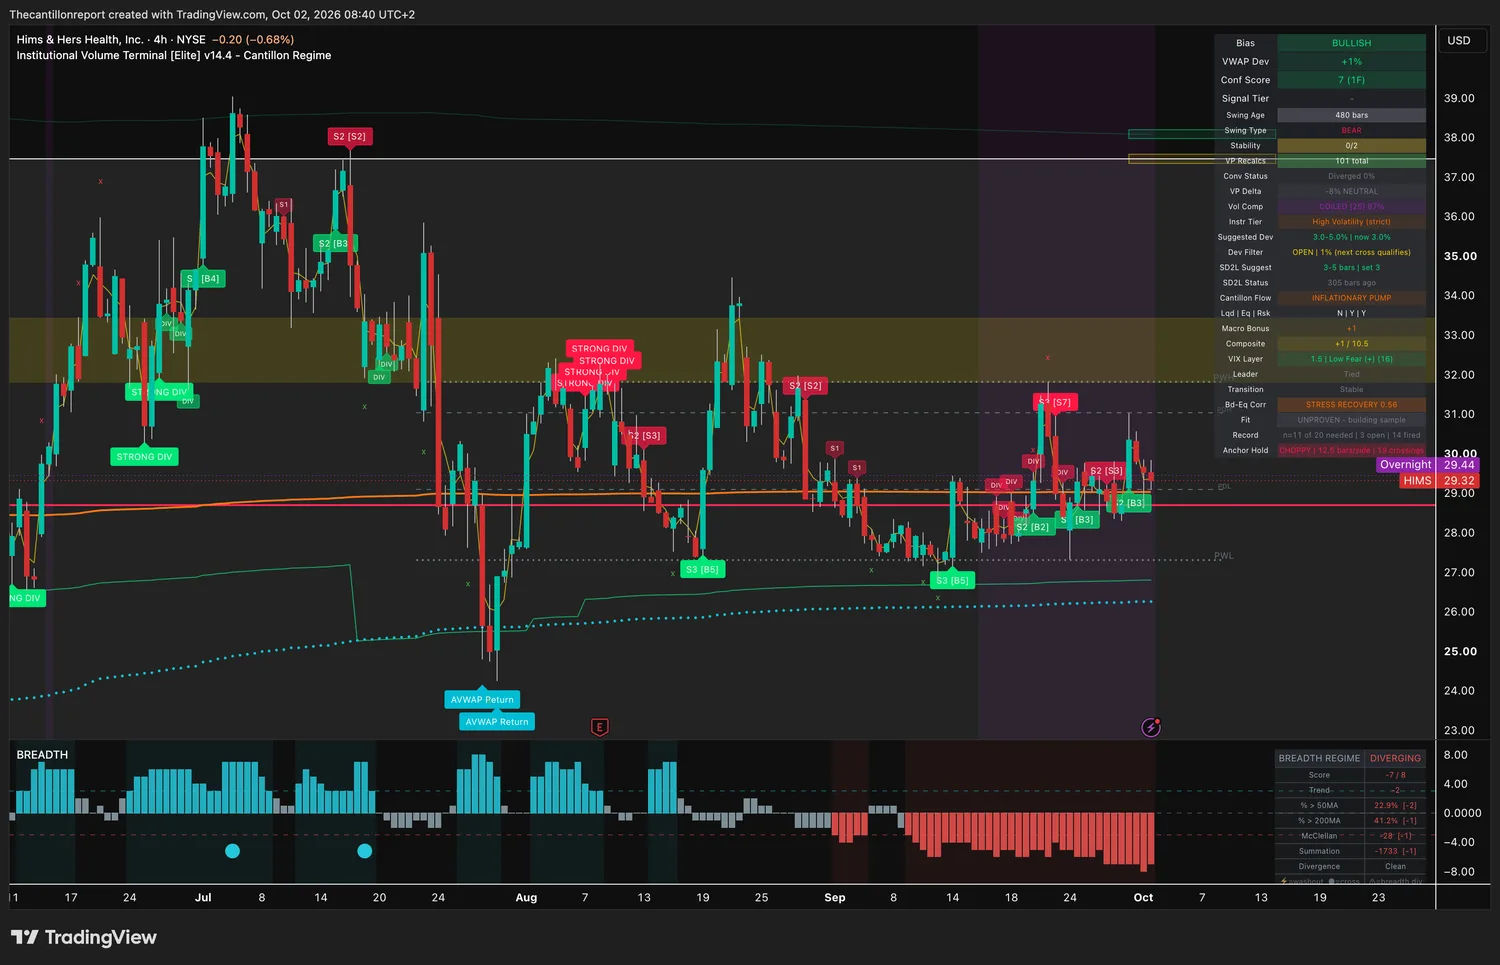
| 4 | HIMS | Long | Wound to 87% on its cost line, inside the windowConf 7 / 1 frame · coiled 87% · record: 11 of 20 signals, 3 open · no light yet | x0.5 |
| # | Name | Side | Entry (distance · price) | Trigger | Get out at | Size |
|---|---|---|---|---|---|---|
| 1 | VLTO | Long | +1.21% · $94.62 band $91.62–$95.36 | None. Inside the window now | $92.90 | Half |
| 2 | USDJPY | Long | +0.06% · 157.80 buy no higher than 158.80 | 4h close above 158.50 | 157.15 | Half |
| 3 | SPCX | Short | −1.36% · $148.10 band $145.64–$150.14 | 4h close below $147.30 | $152.40 | Half |
| 4 | HIMS | Long | +1.00% · $29.32 band $28.16–$29.90 | None. Inside the window now | $28.10 | Half |
This one is free. The other four this week were not.
Every level, every execution block and all 23 terminal captures, with nothing held back and no gate anywhere on the page. Monday through Thursday the entry levels sit behind the member wall. Every Friday the whole thing ships open.
What you are doing: buying a water-quality company at the price large money paid for it, on a chart that has respected that price since August, on a record too short to rate.
What you are doing: buying the dollar against the yen if payrolls push it out of a coiled range that sits right on its cost line.
What you are doing: selling this summer's listing as its tightly wound range tips under the cost line, with no record behind the call at all.
The pair trades at 157.80, ten pips over its 157.70 cost line. Payrolls land at 14:30 CEST, an hour before US stocks open, so this is the first level on the Board the jobs number can reach. A 4-hour close above 158.50 opens the half-size long. A close under 157.15 ends it for the day.
| Name | Distance from cost | Comes back at | Why it is not a trade |
|---|---|---|---|
| ENS | Not captured | $184.78 window top | Thursday's long. The scanner had it at $189.59 at Thursday's close, above the window. Hold, no adds, exit stays $179.30. |
| CEVA | −0.98% | Window open, $34.77 edge | Amber, holding, 12.5-point cushion, confirmation up to 7 from 4. Volume still leans 18% to buyers. No short into that. |
| CF | −0.69% | Window open | Amber and improving, but the bias flipped bearish and confirmation is 2 on one frame. Tuesday's $117.60 long trigger never filled. |
| DIS | −2.62% | $102.02 | Amber, holding, compressed 85%. Past its 2% short window by 0.62 points. |
| RXRX | +2.13% | Window open | Confirmation 2 on one frame. Too little agreement, not too little history. |
| VFF | +0.61% | Window open | A long with 17% of the volume on the sell side. Confirmation 2. |
| CECO | +1.3% | Window open | Confirmation 9, coiled 89%. Red and fading. .00R over 47 signals. |
| NTR | +0.04% | Window open | Confirmation 7 across three frames, filter passed. Red, holding. −.02R over 26 signals. |
| BRK.B | +0.99% | Window open | Confirmation 6 across two frames. Red and fading. +.03R over 83 signals. |
| DNLI | −0.6% | Window open | Tier 2 short, filter passed. Red and fading. −.03R over 33 signals. |
| MDGL | −1.28% | Window open | Anchor crossed only 3 times. Red, holding. +.02R over 32 signals, range −.13 to +.17. |
| AMPS | −0.2% | Window open | Record panel error, confirmation 4 on one frame, cost line crossed 14 times. Nothing to size. |
| CTVA | −78.21% | None | Thursday's spin-off reset the price. Every reading on the chart is distorted until the anchors rebuild. |
| VYGR | −30.65% | None | Snapback signal active 30% under cost. Red and fading. Selling here sells the low. |
| Six more | −2.34% to +2.79% | AMZN and WTRG shut | AMZN, MA, MCHP, FLR, CRSP and WTRG. Every light red. Records run from −.07R (AMZN, 62 signals) to +.03R (MA, 49). |
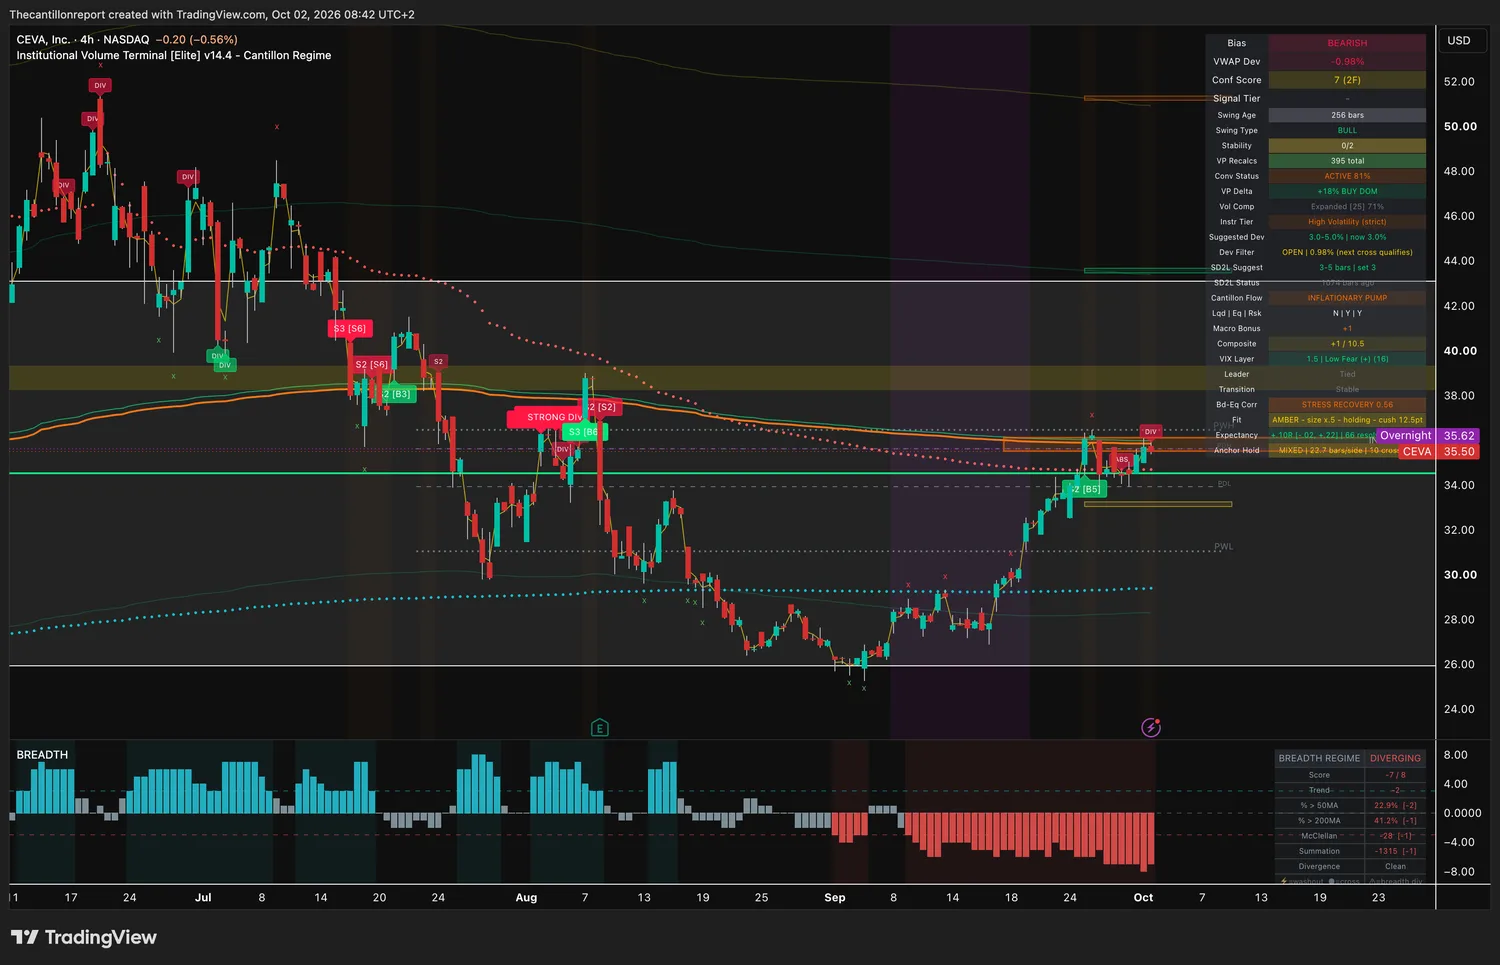
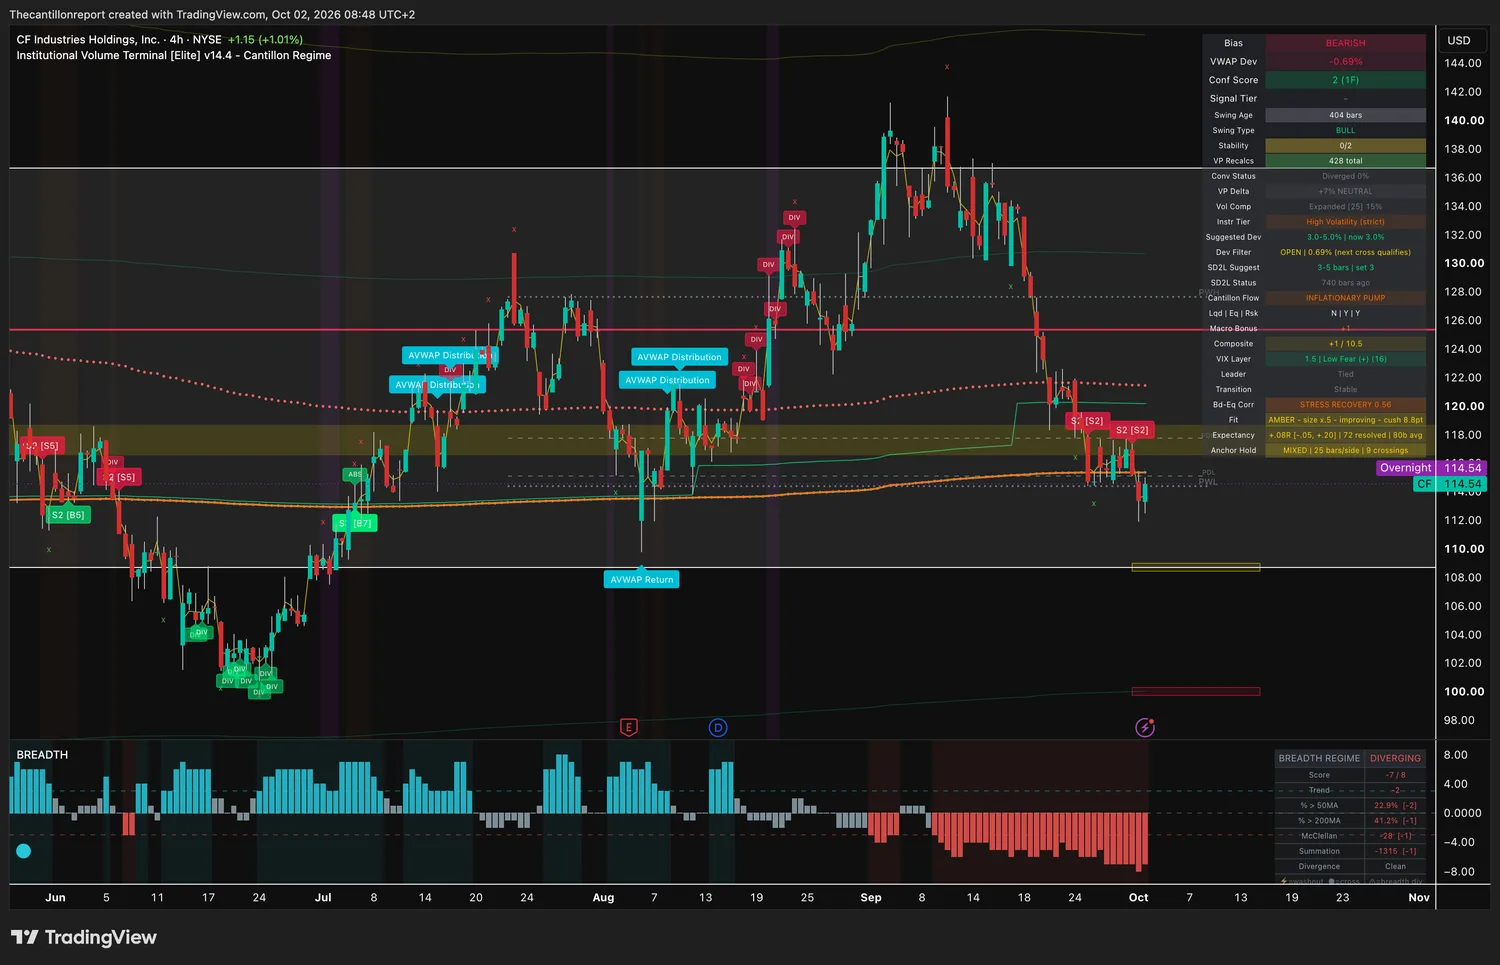
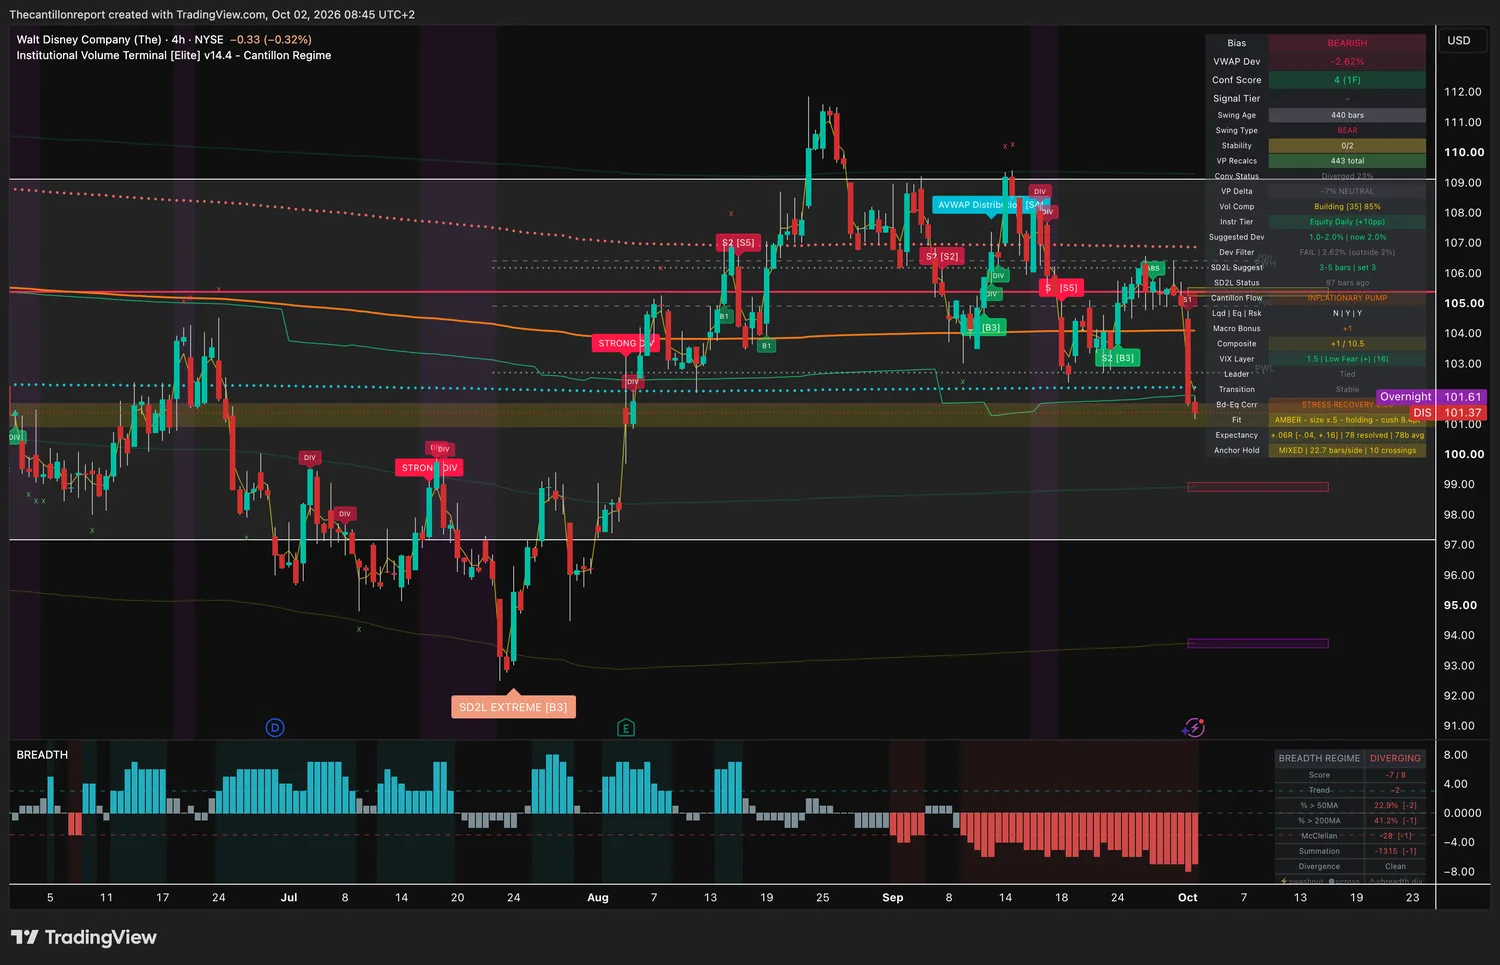
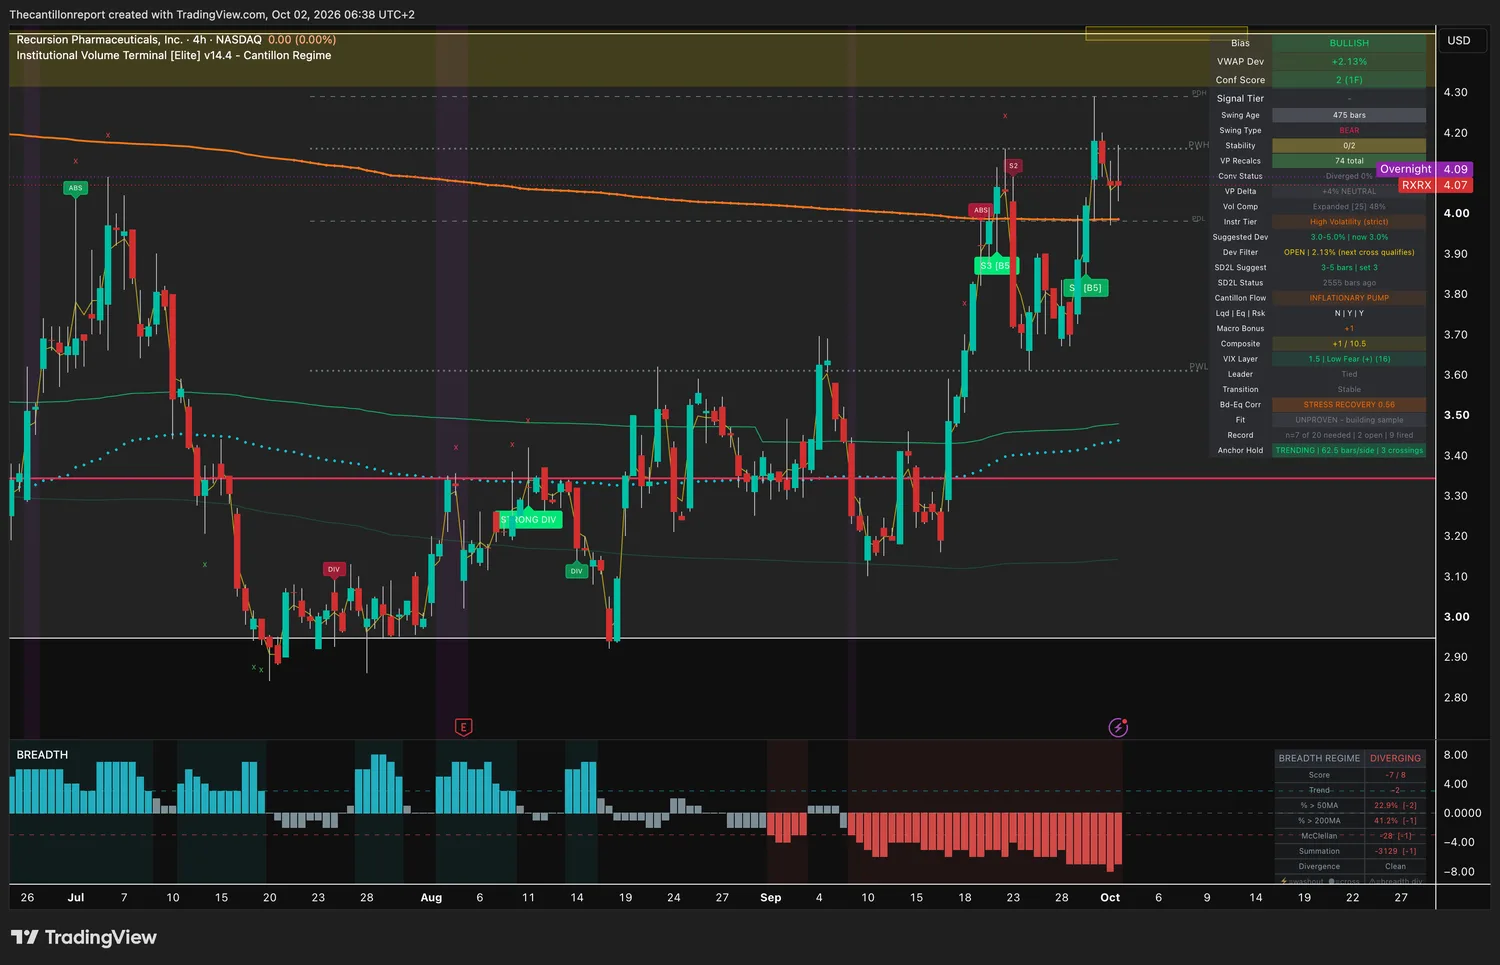
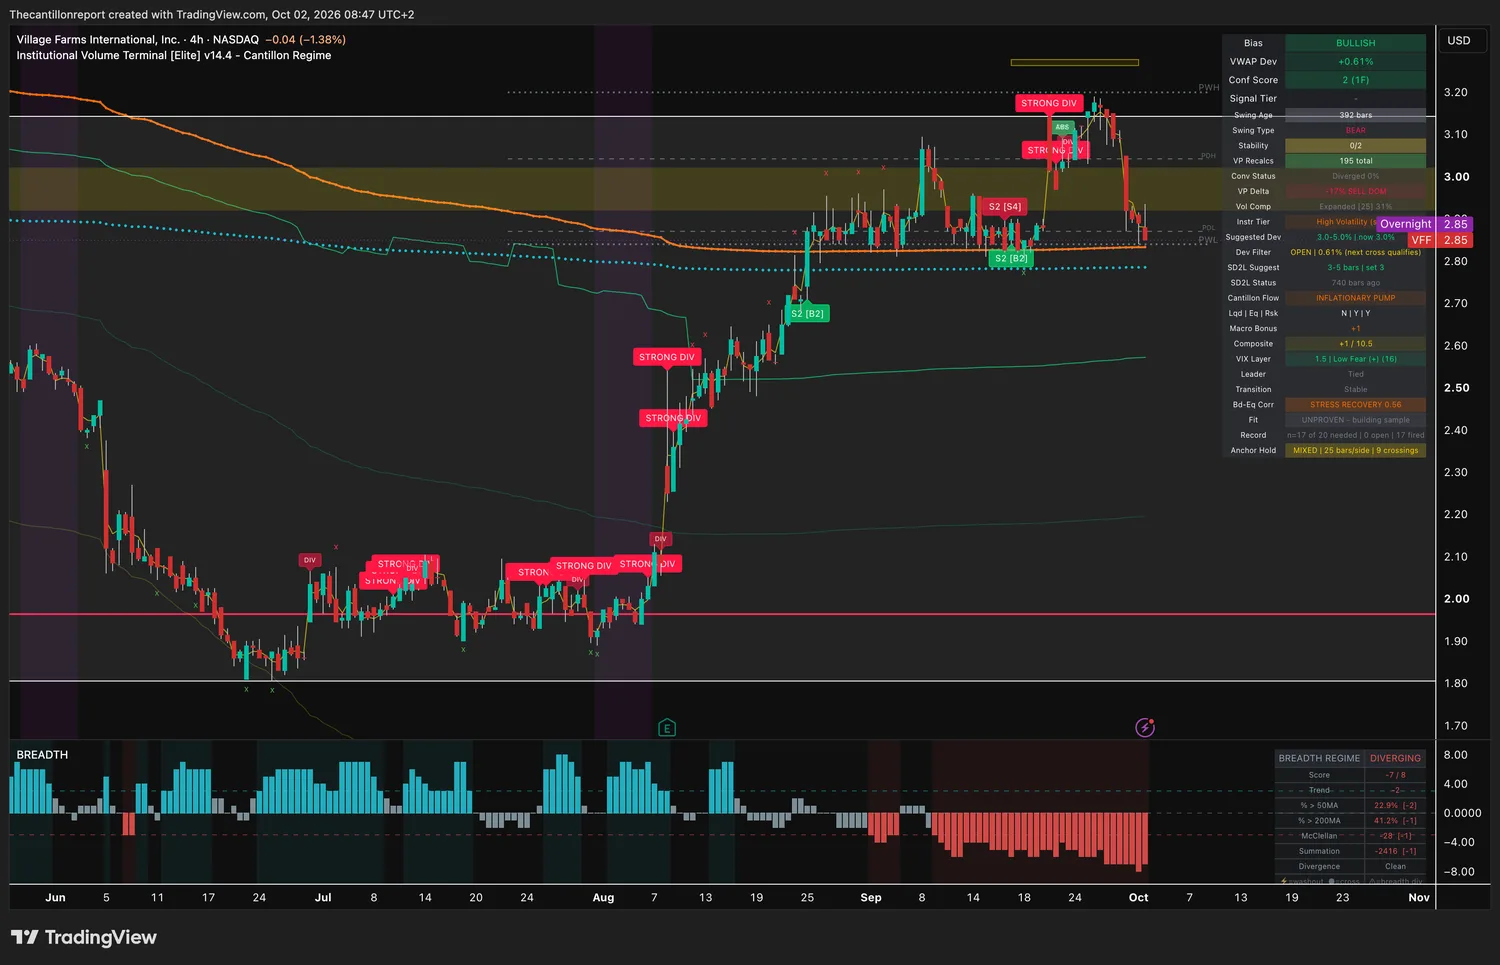
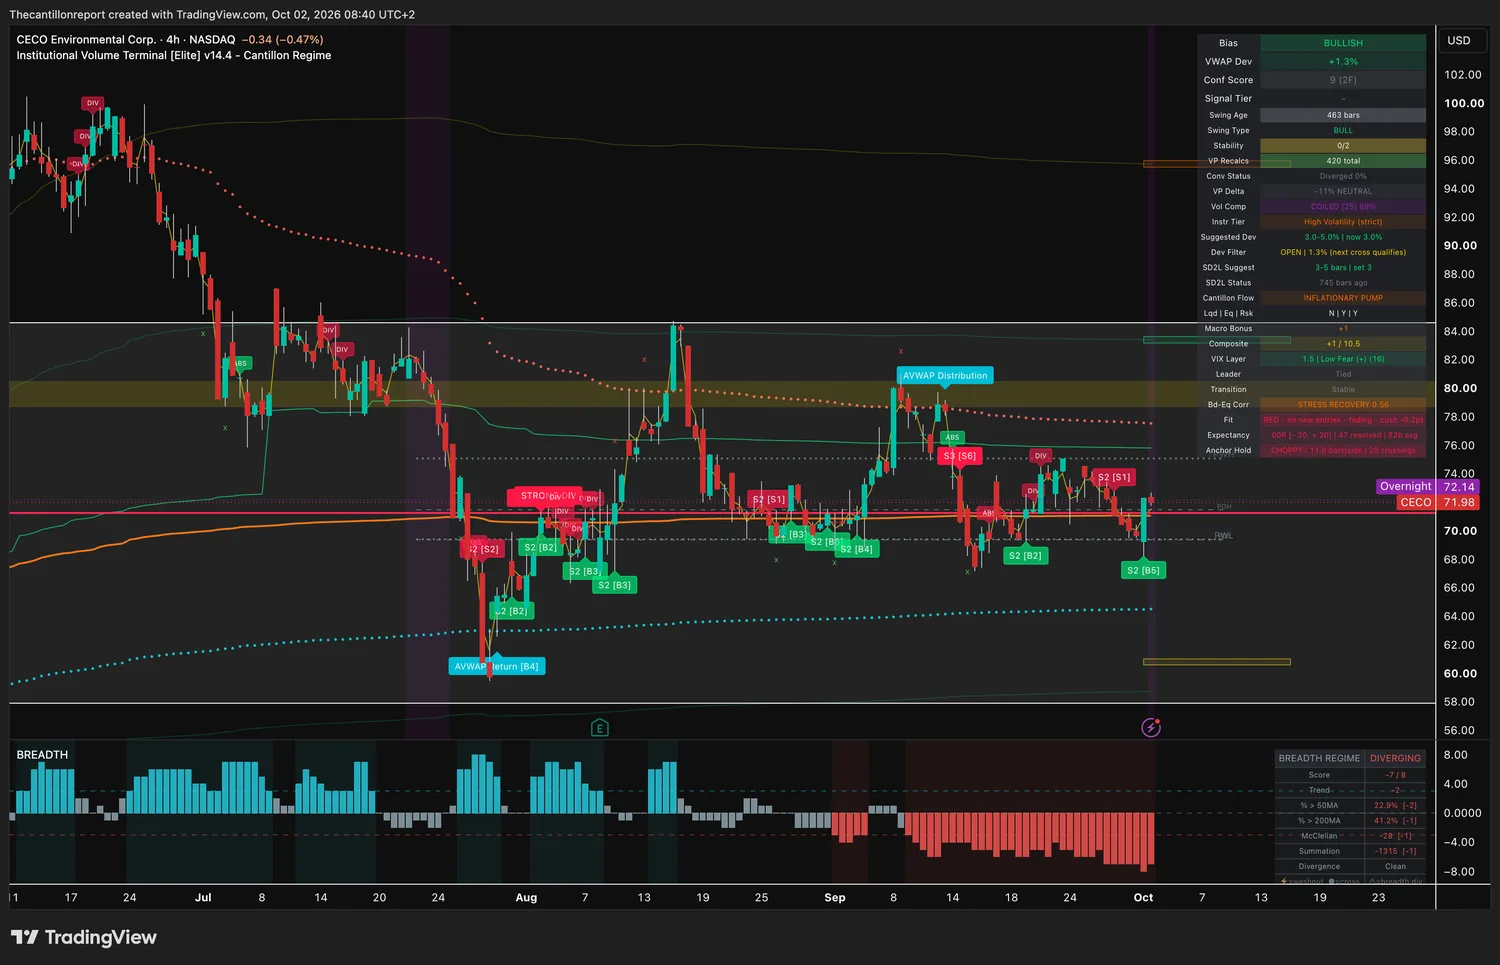
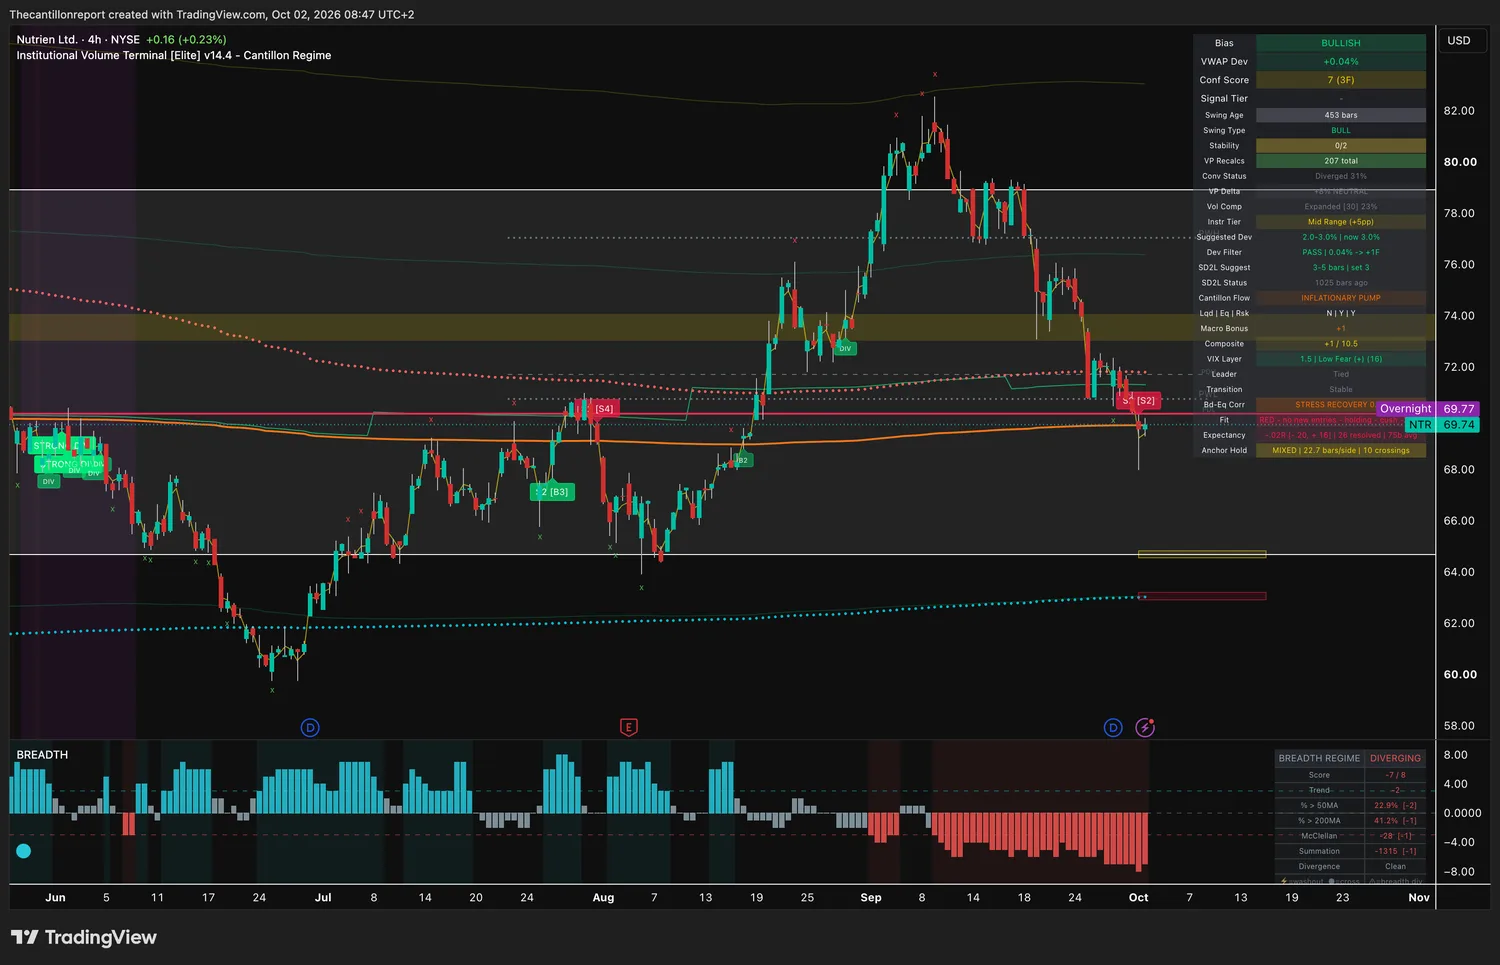
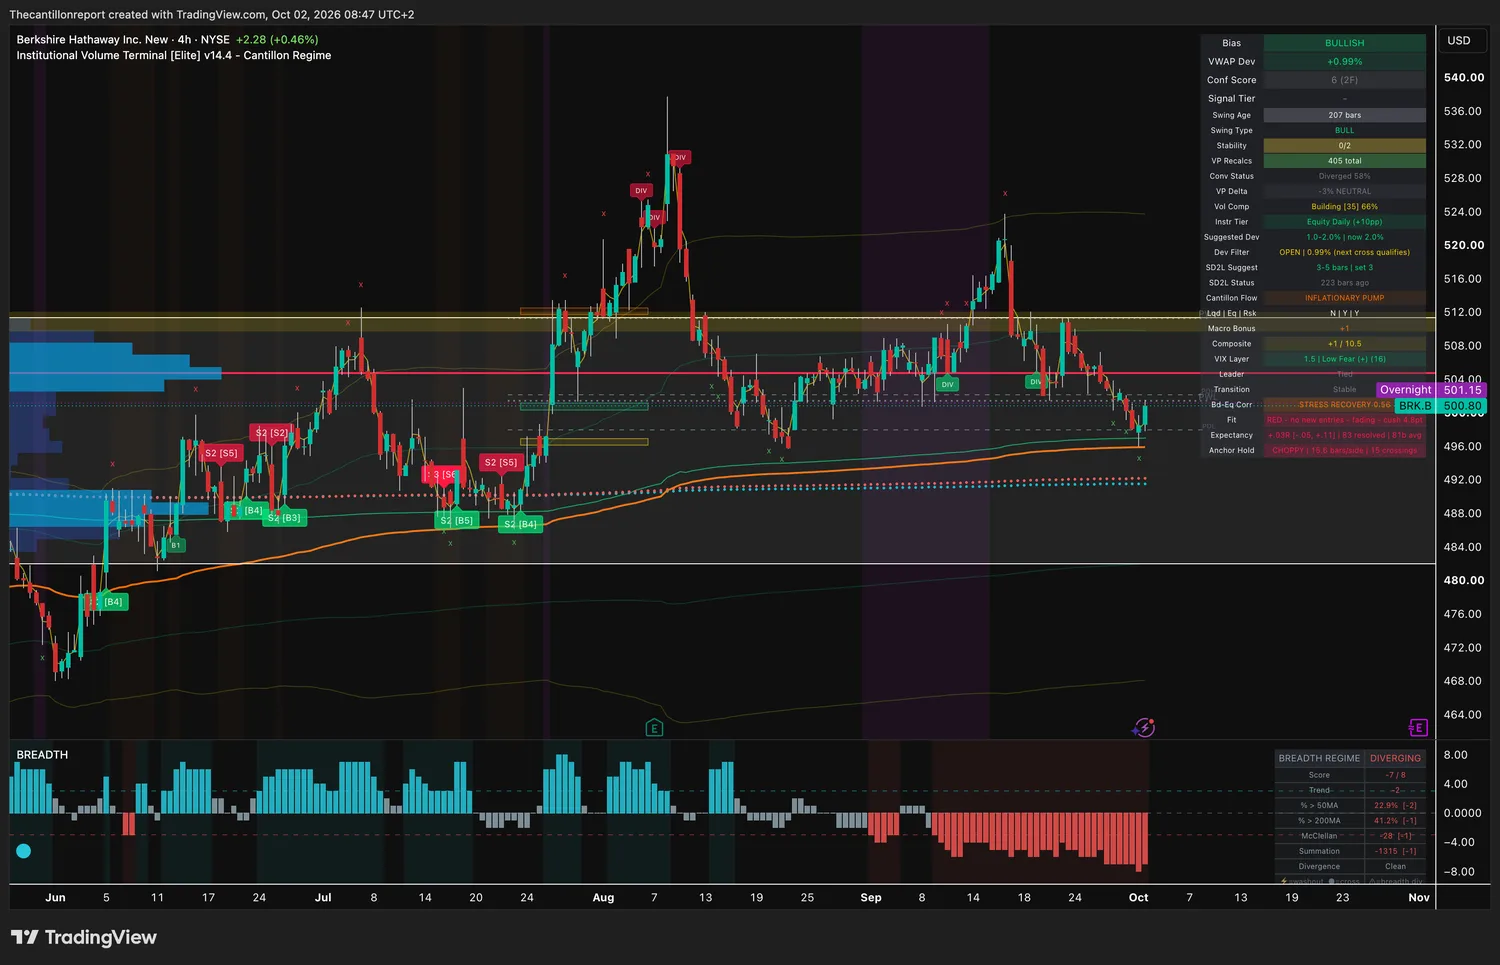
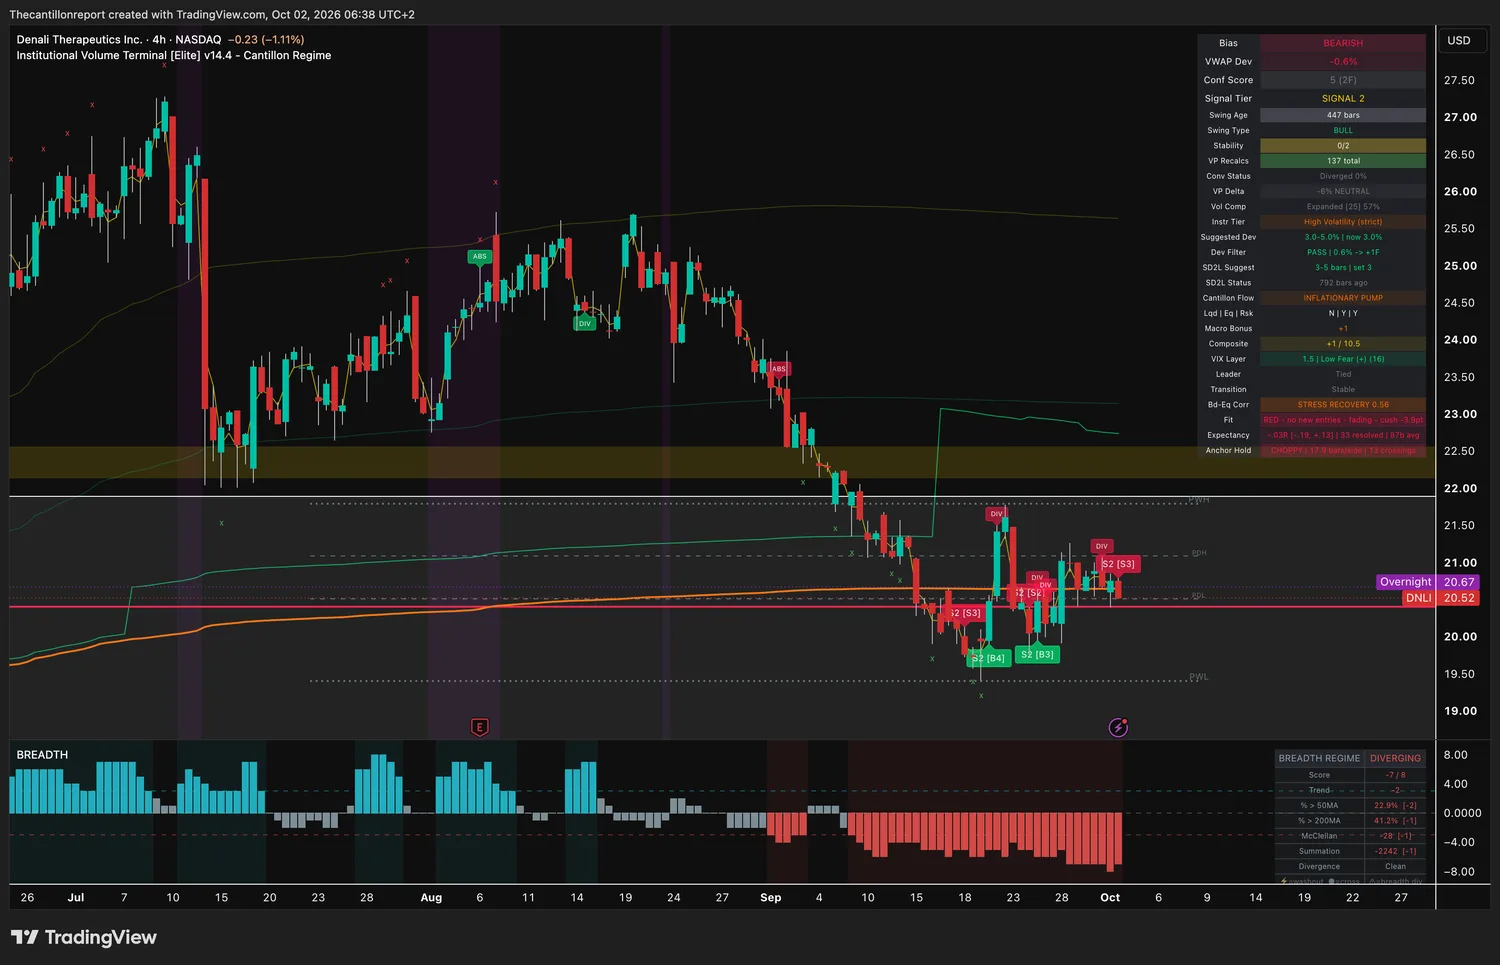
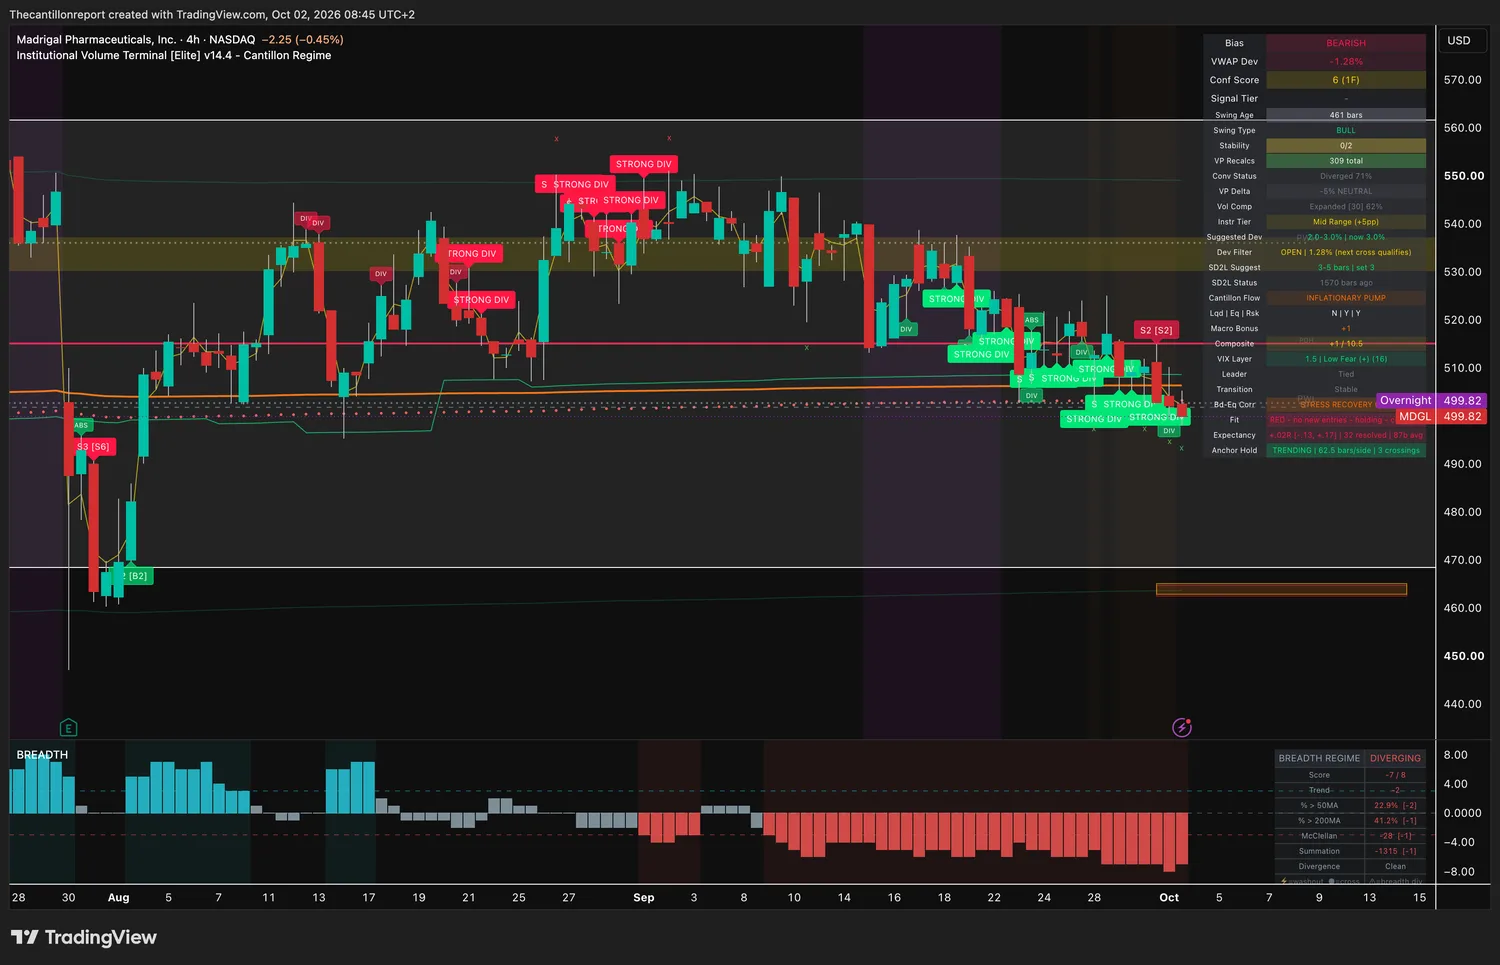
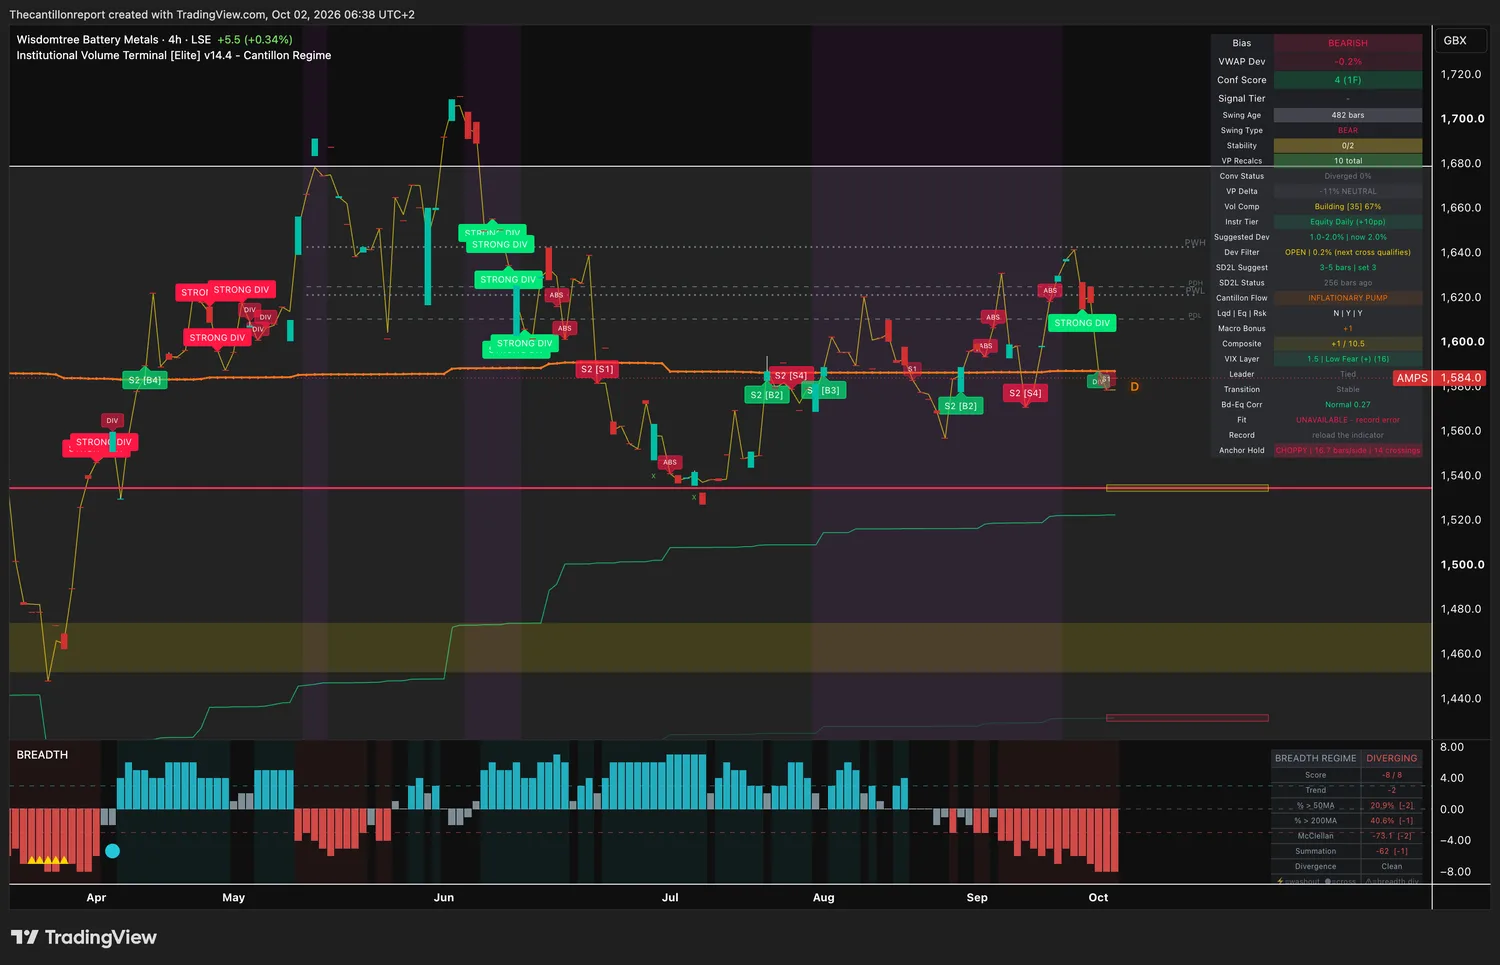
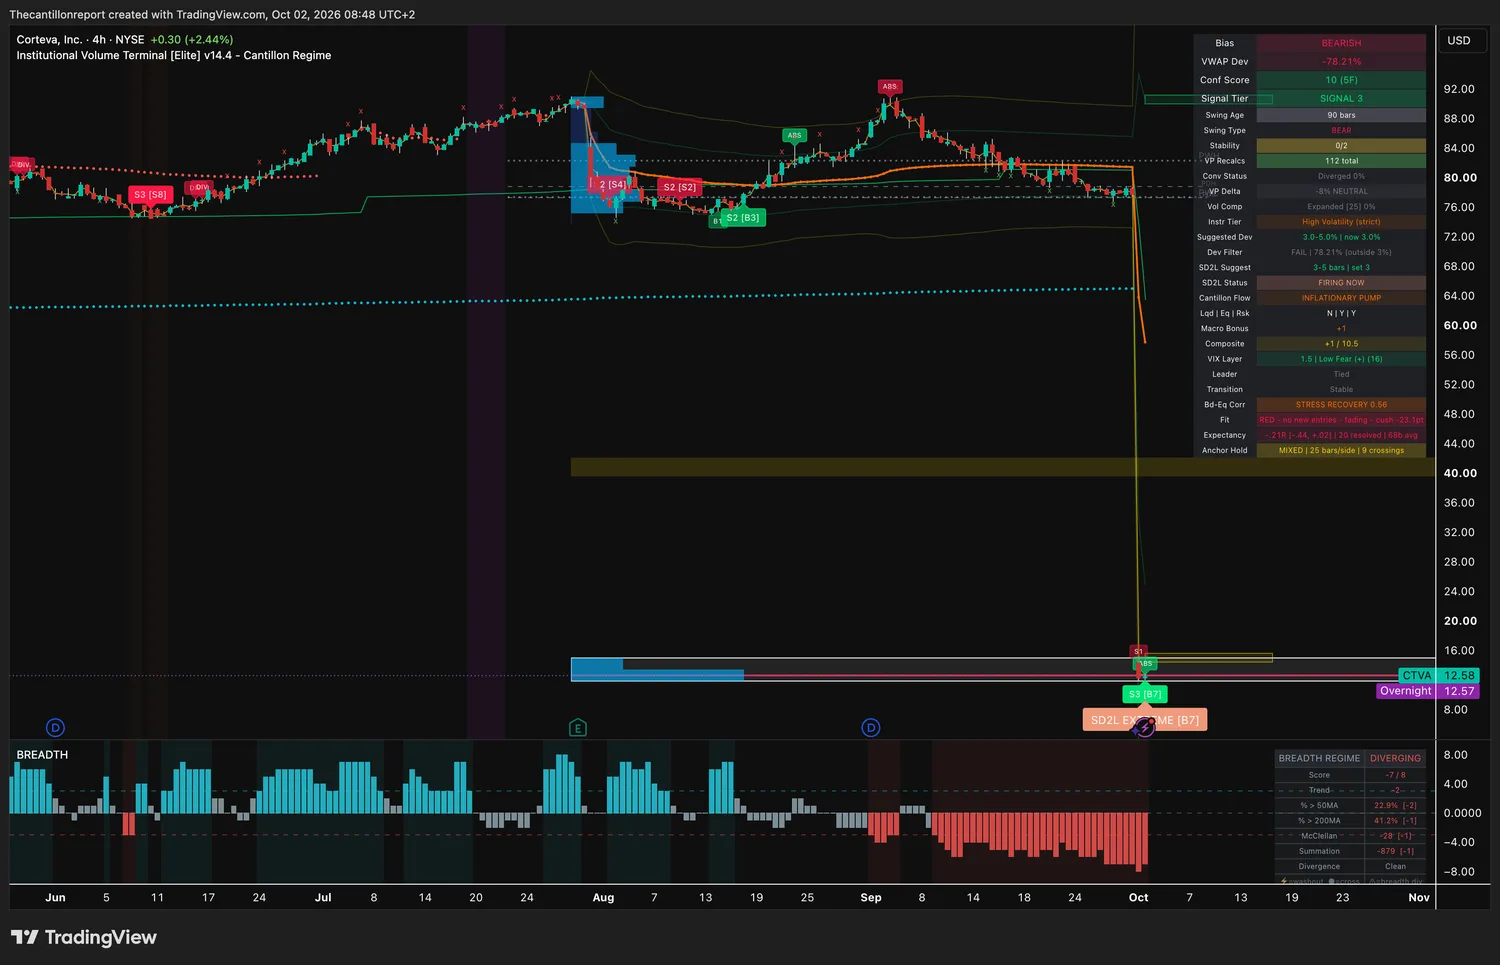
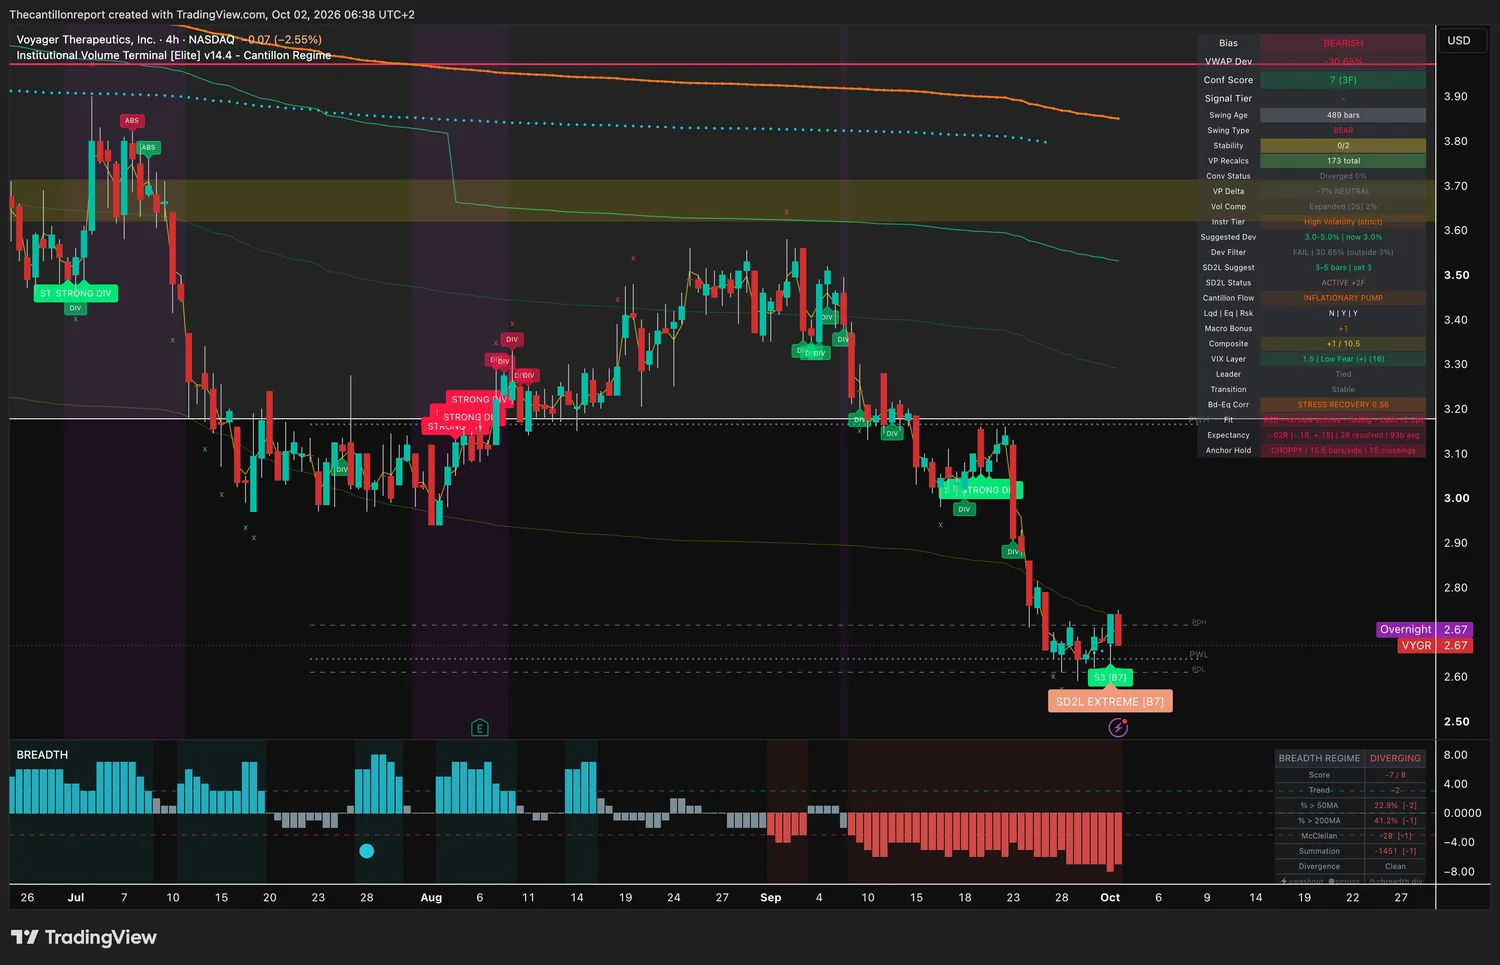
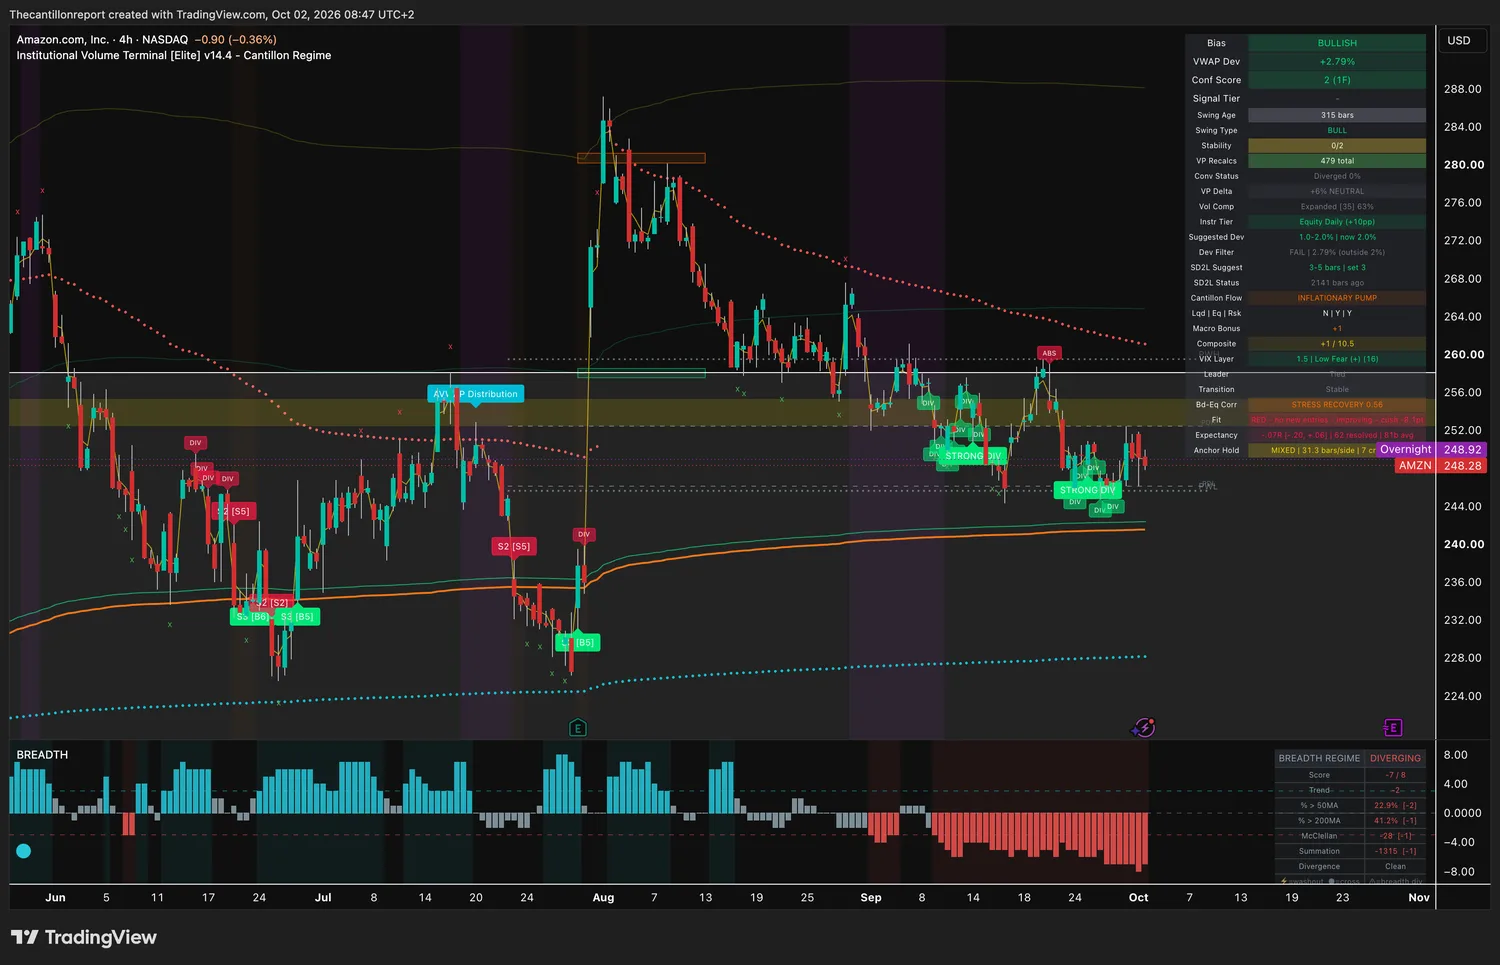
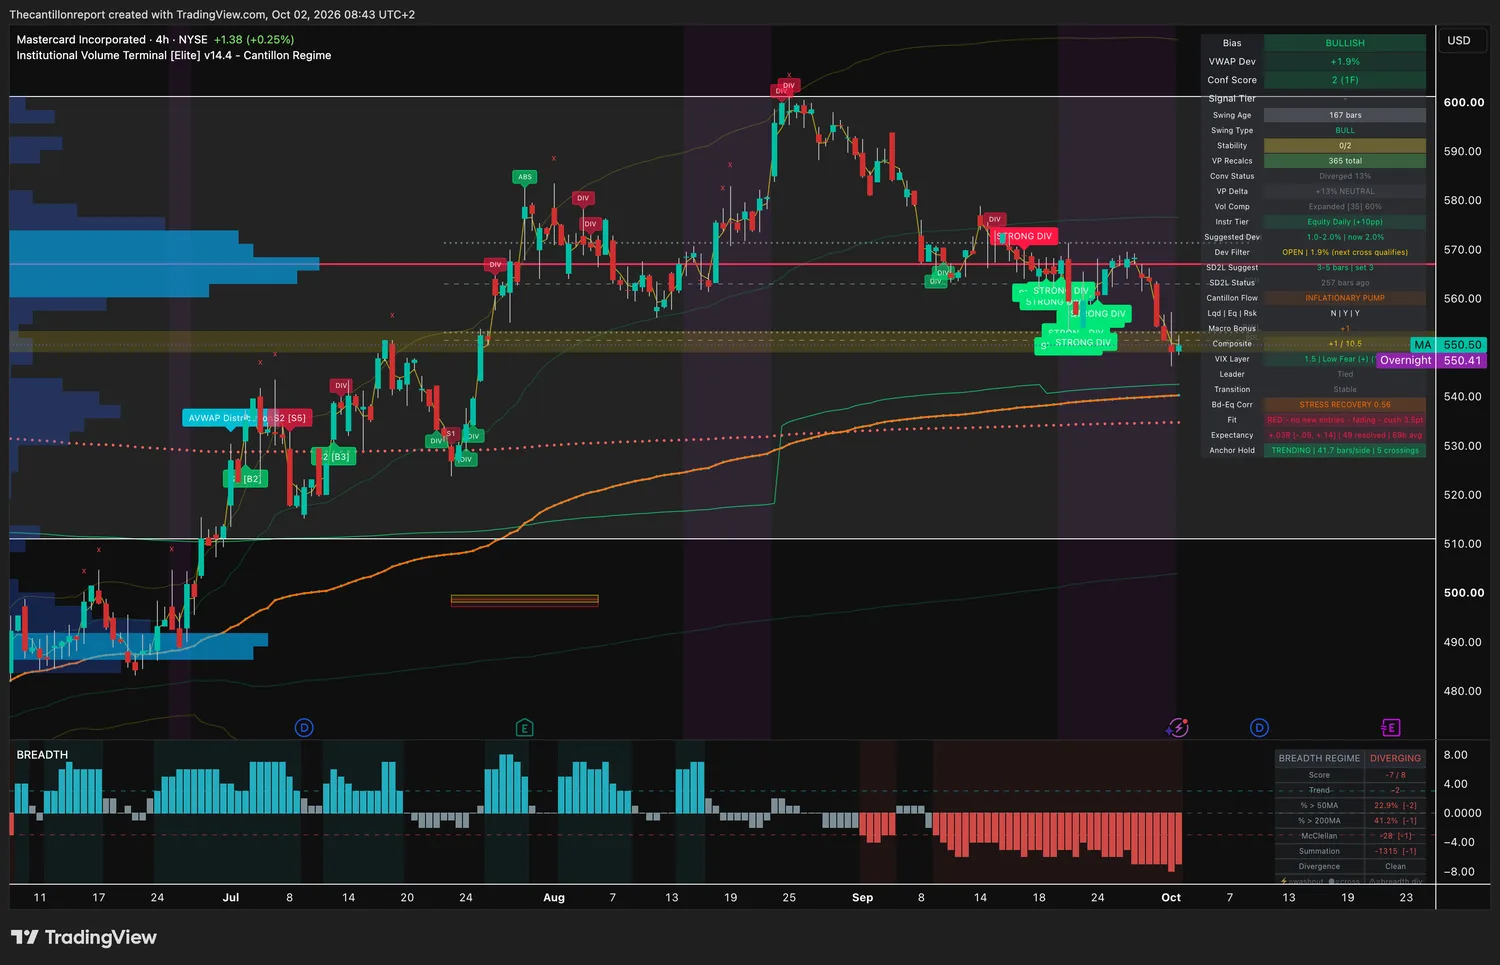
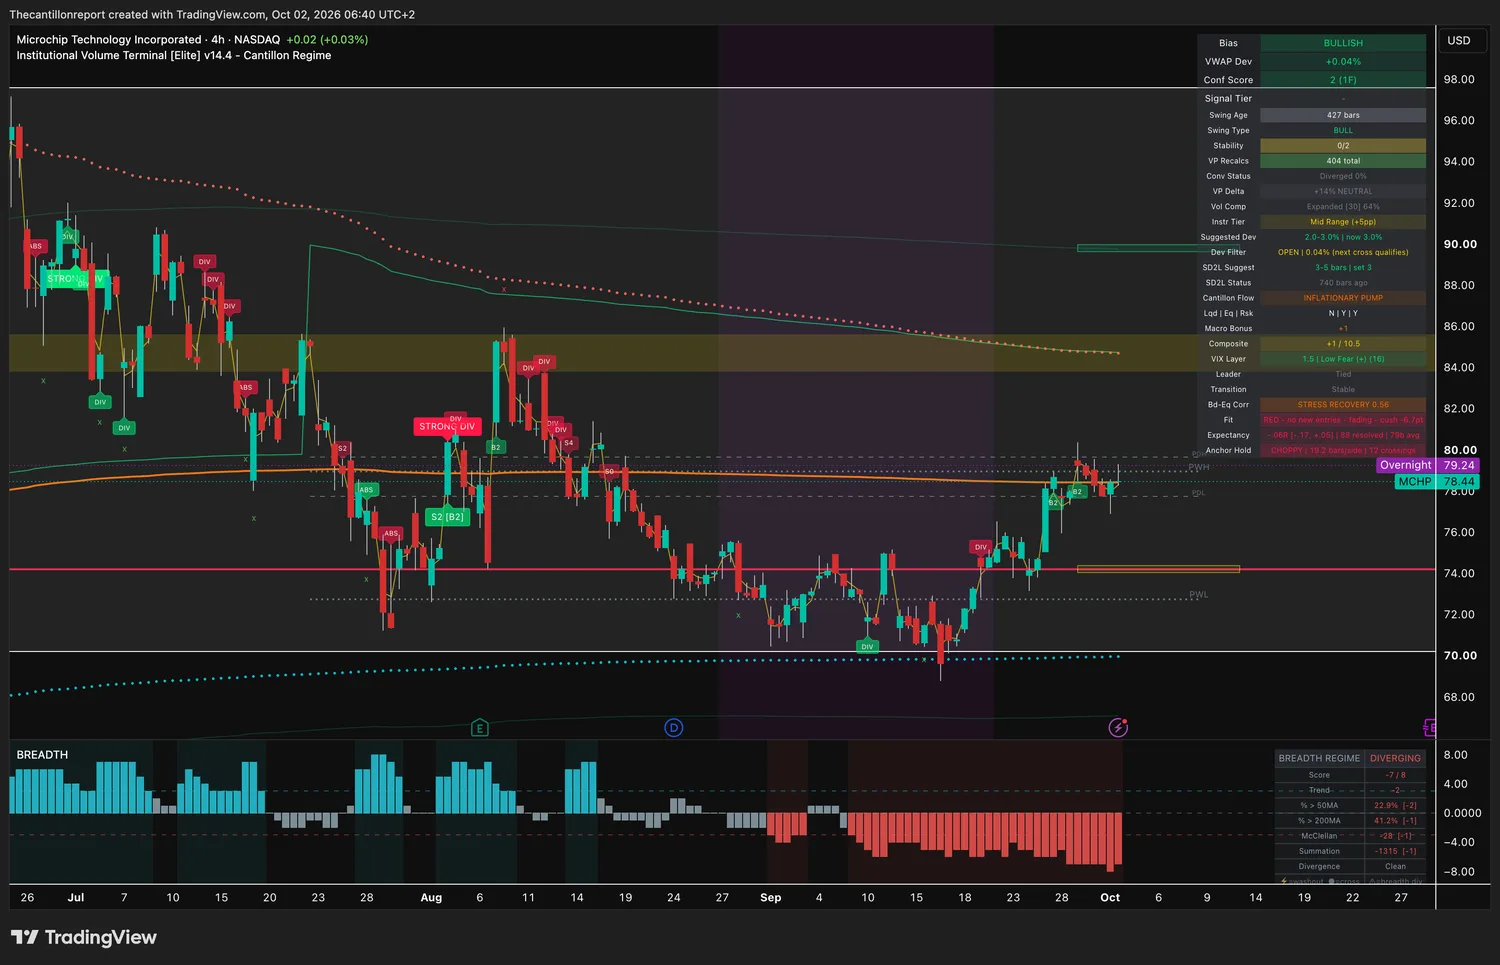
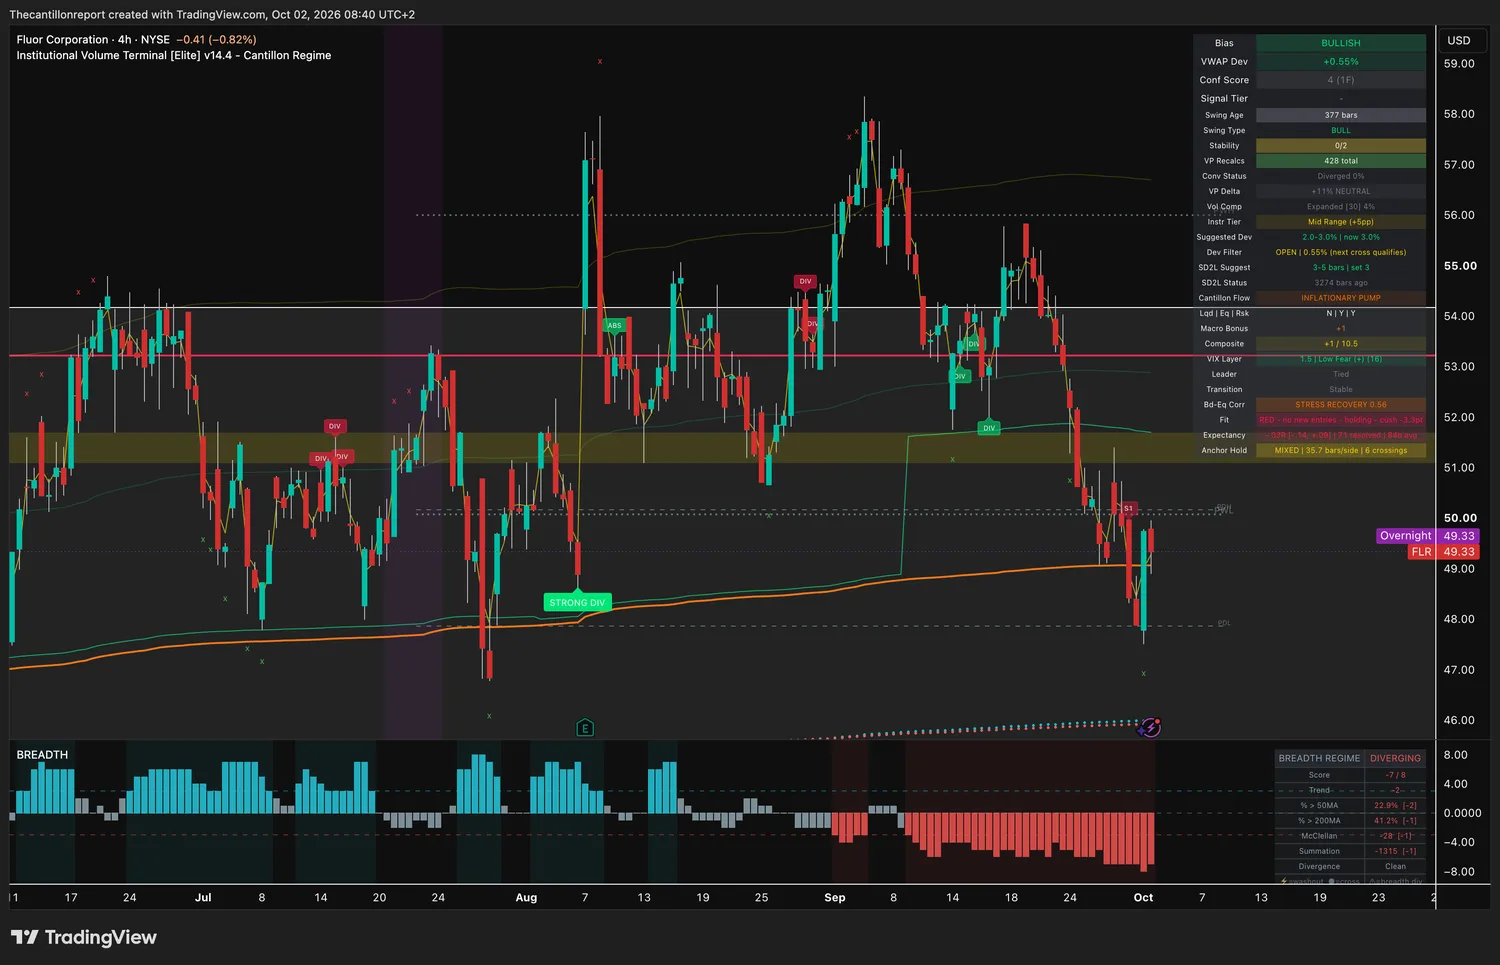
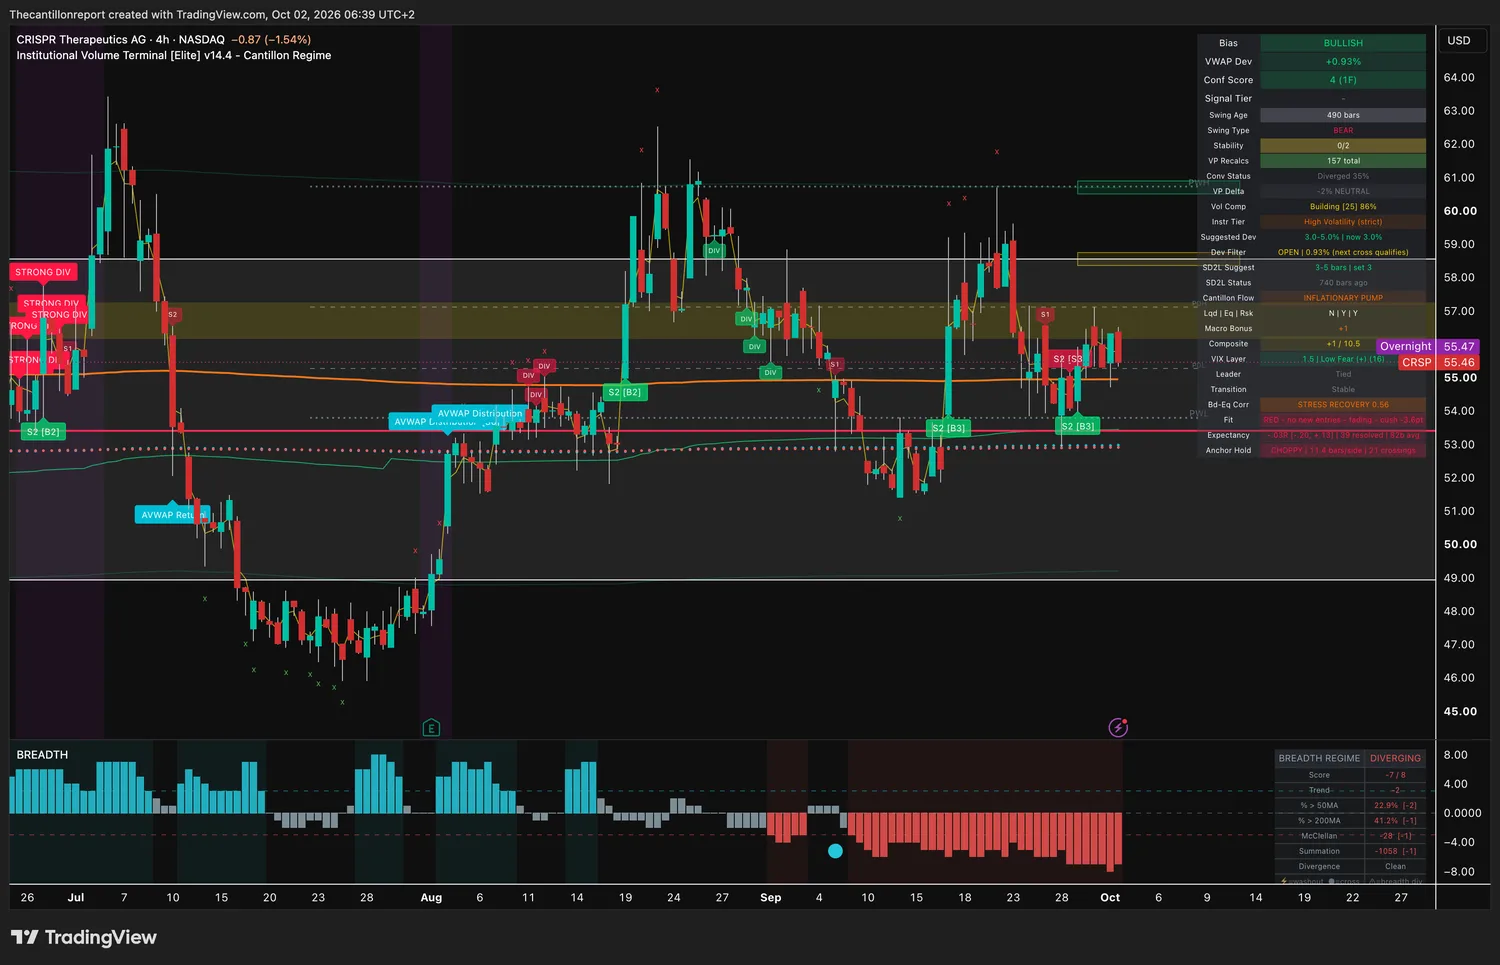
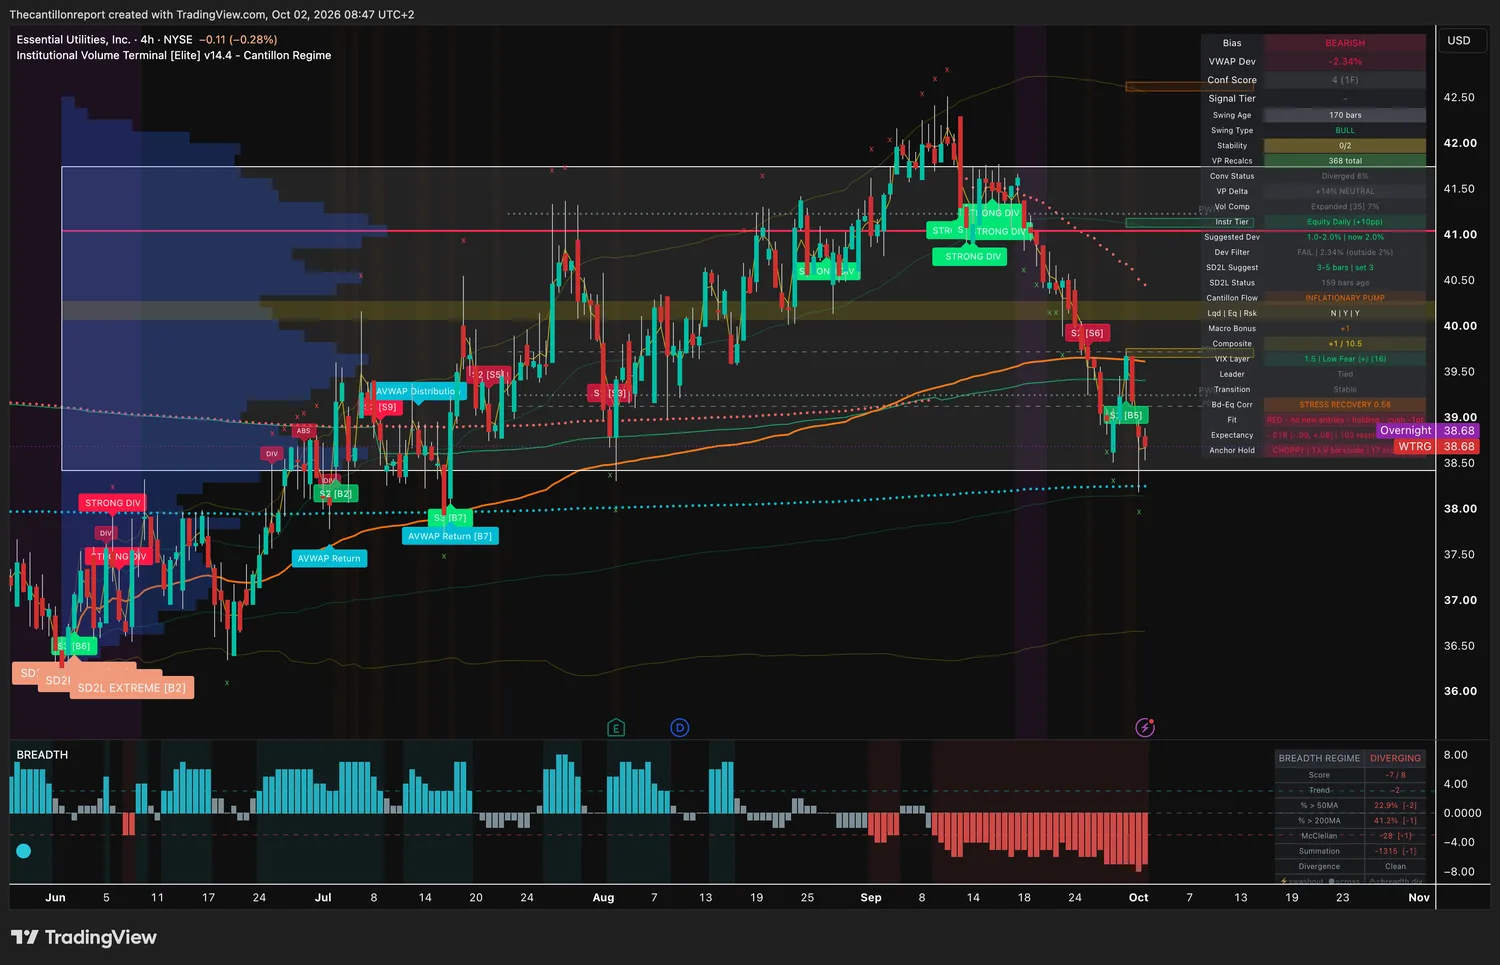
Cost line (the anchor) · the volume-weighted price large money actually paid over the current swing. Everything in this brief is measured as distance from it. Buy near it and you are paying what they paid. Buy far above it and you are paying their profit. Entry window · how far from the cost line a new entry can still be sensibly priced. Inside it, the entry is fairly priced. Past it, the move has already run and you wait for a pullback. Compression · how tightly the range has wound, from 0 to 100%. High means the next move should be a big one. It says nothing about direction, and it never overrides a shut window. Confirmation · how many independent readings agree, and across how many timeframes. Higher on both counts is better. Record · the average result per signal in units of risk, where being stopped out is exactly −1.00. Always published with the number of finished signals behind it, and measured over the same history the settings were chosen on. Below 20 finished signals no rate is published. A short record is not a verdict on the chart, only on what can be measured yet. Trend light · green means full size, amber means half, red means no new entry however good the chart looks. A chart with no light yet, because its record is still being built, is sized at half.
Readings captured Friday 2 October 2026 between 06:38 and 08:49 CEST from the IVT v14.4 terminal, on four-hour bars that had not yet closed. US exchanges open at 15:30 CEST and September payrolls print at 14:30 CEST. Cost lines and window edges are derived from the terminal's published percentage distances. AMPS is quoted in pence on the London Stock Exchange. Corteva's readings are distorted by Thursday's spin-off.
Records are in-sample and forecast nothing. No rate is published on fewer than twenty finished signals, and the sample size is printed beside every one.
Charts are unmodified terminal captures provided for reference, not as entry instructions. Educational content only. Not financial advice. Past results do not predict future ones.