Five On The Line. The Open Gets The Vote.
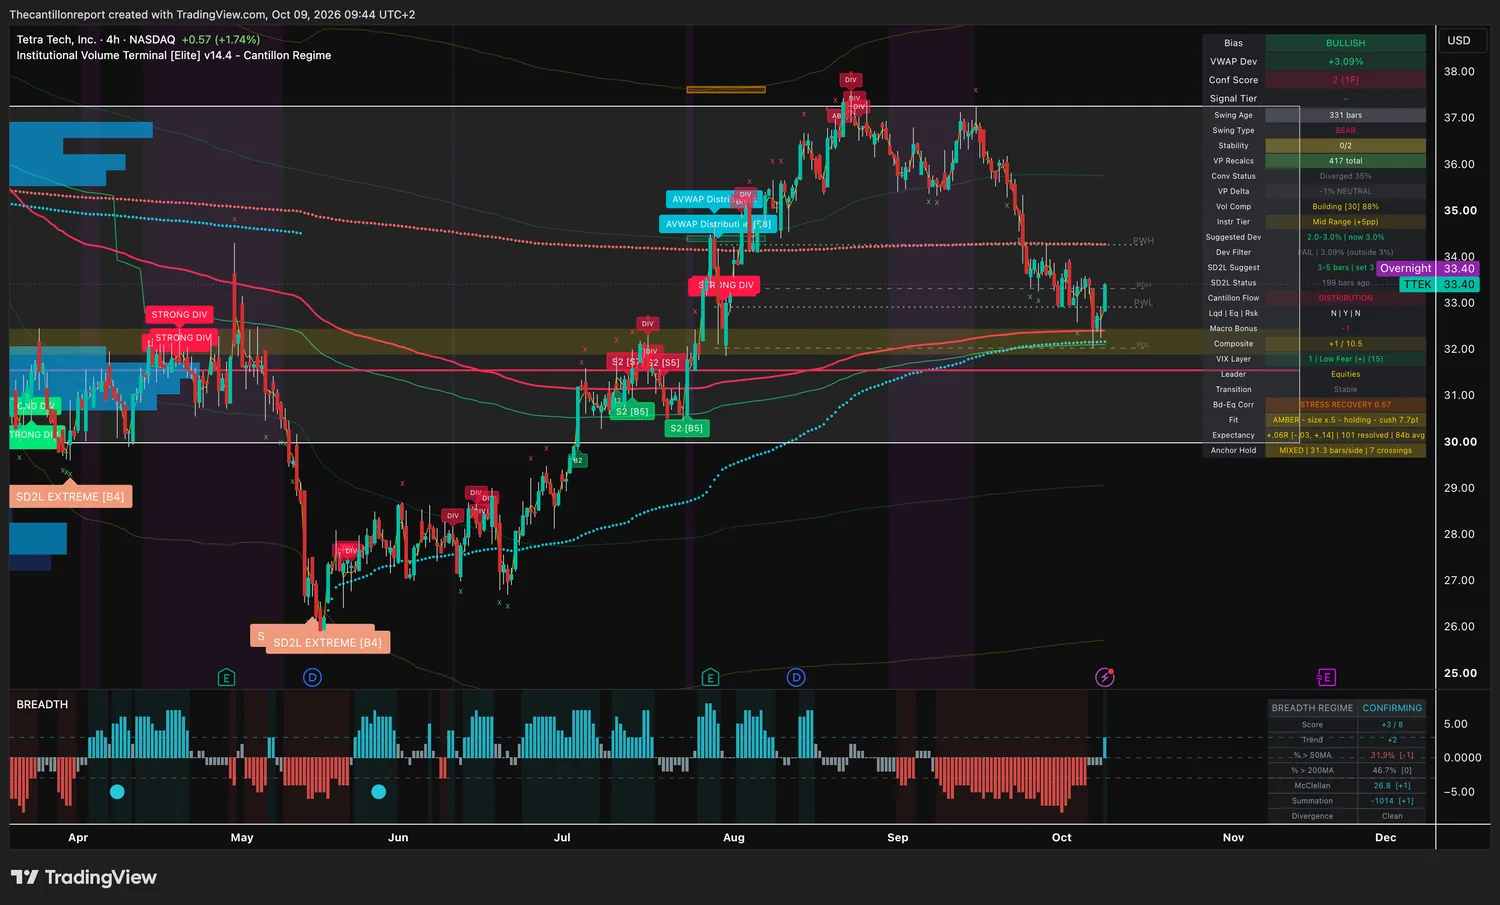
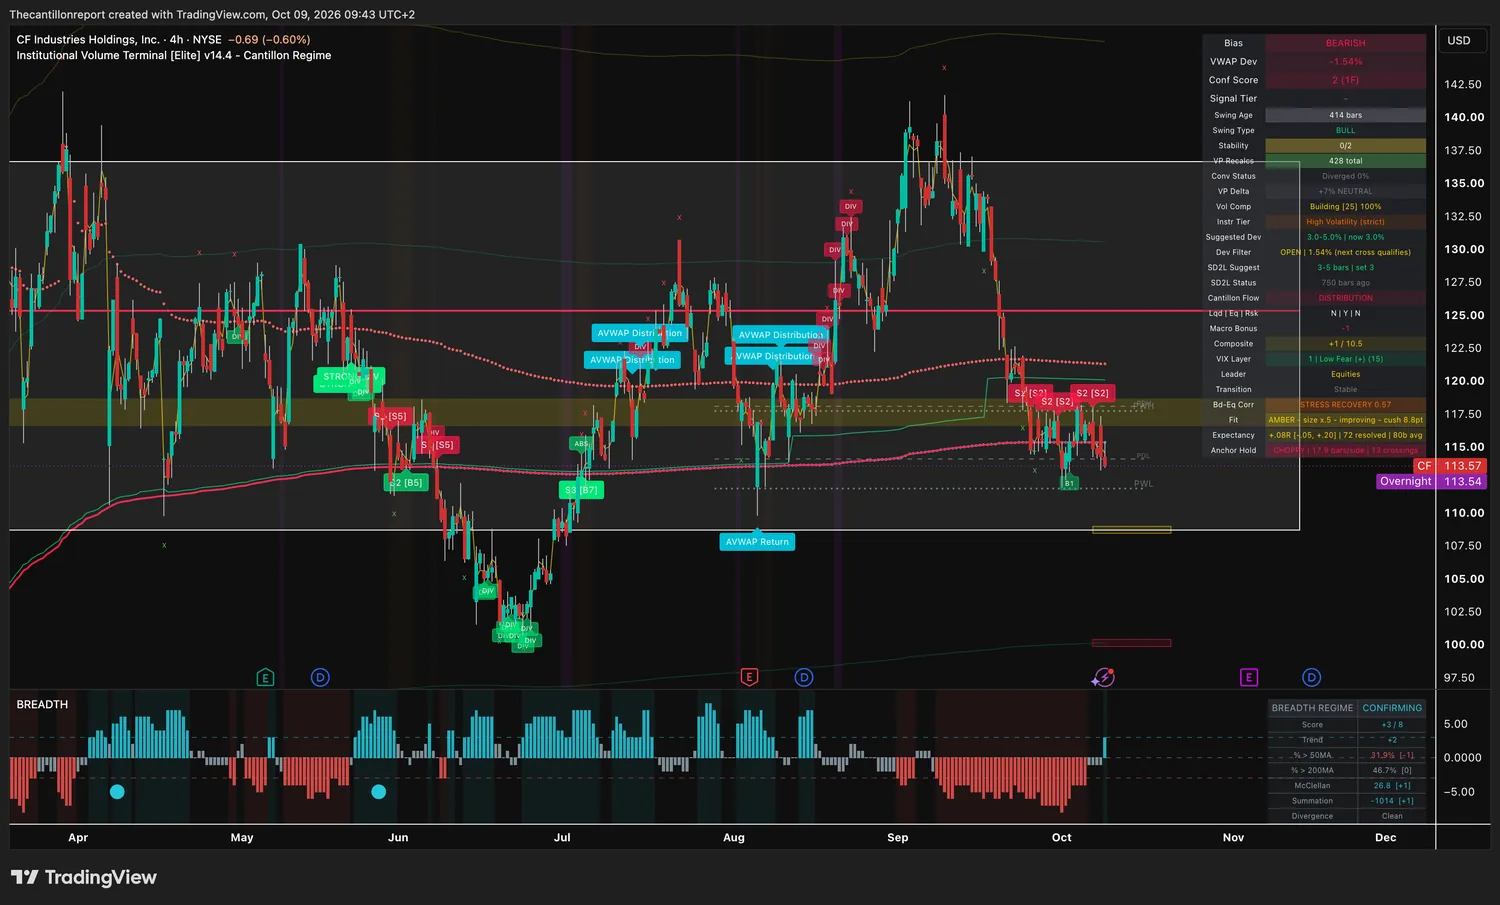
Five charts printed within half a percent of their cost line before the bell, and not one of them is a trade until the session closes a four-hour bar. Tetra Tech sits three cents above its long window on an amber light. CF Industries is the short. The number is $33.37.
| Buy | TTEK long, half size, at $33.37 or lower, once the first four-hour bar after the open closes above its cost line. Amber light, 101 finished signals. |
| Sell | CF short, half size, on the first four-hour close under $115.35. Range wound to 100%, light improving. |
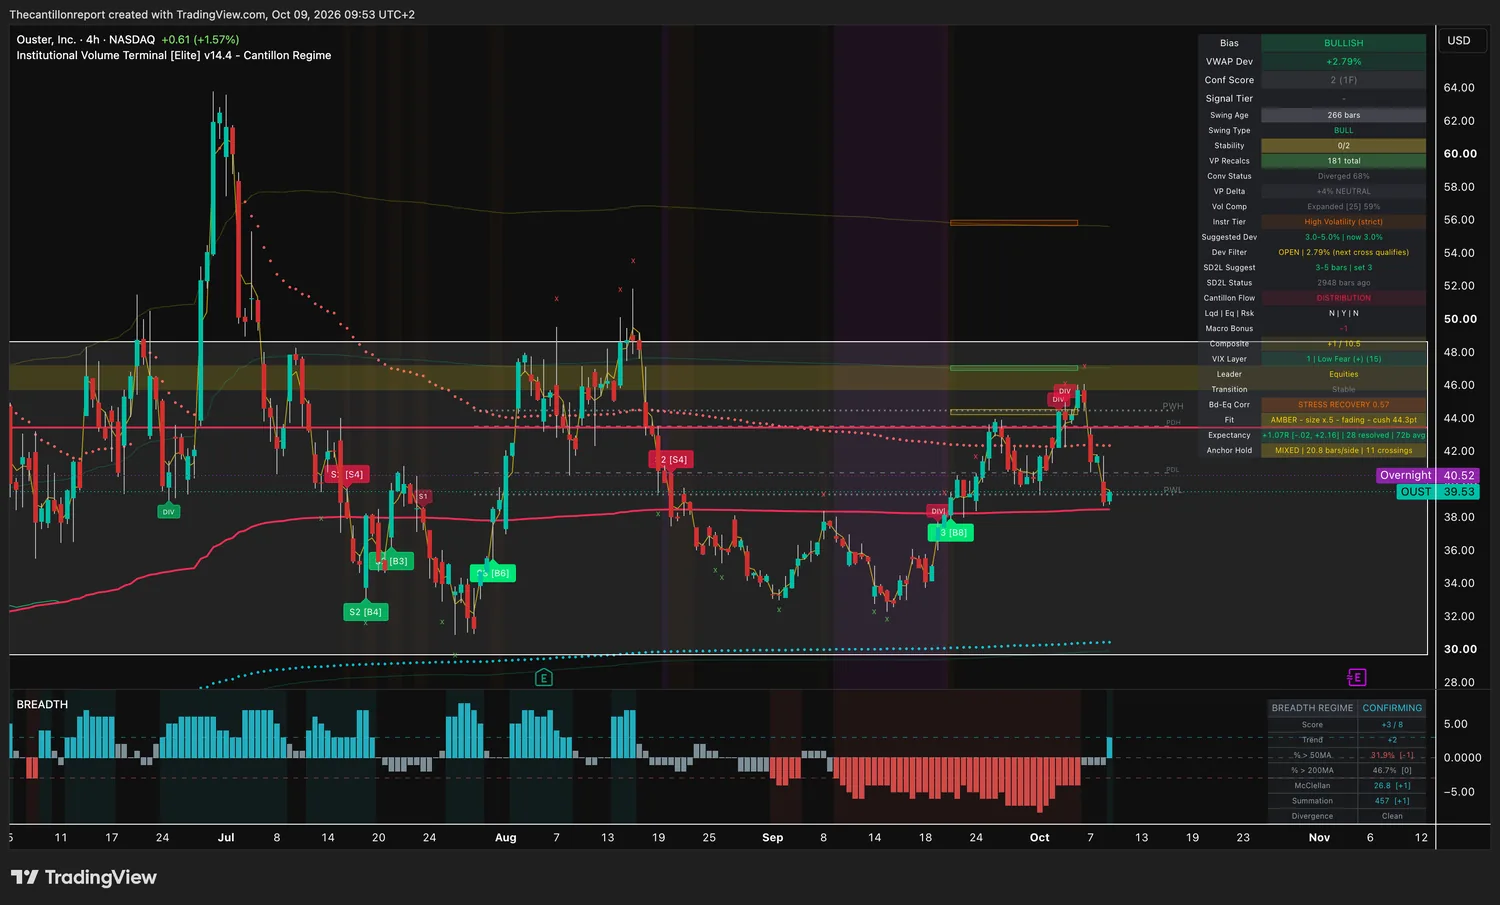
| Wait | OUST long, half. The best record on the scan, but the overnight bid lifted it out of its window. Buy only back under $39.61. |
| Wait | MELI, RXRX, NTR and VST, all on their cost lines before the bell. A pre-market print wobbling around a line decides nothing. DG's short waits on the same close. |
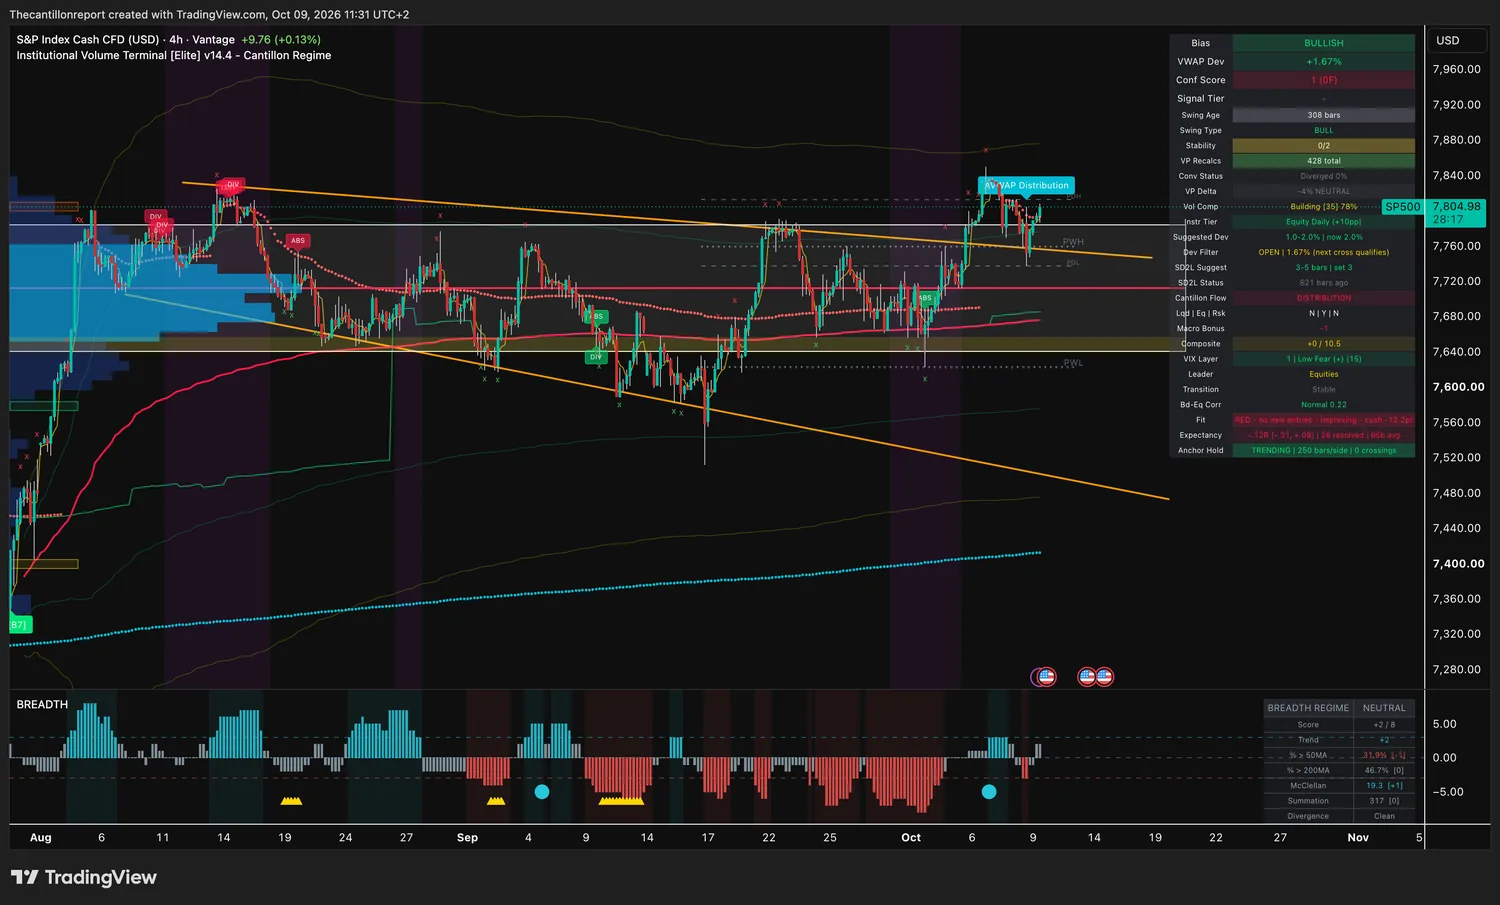
| Skip | The indices. All four read Distribution under a red light. |
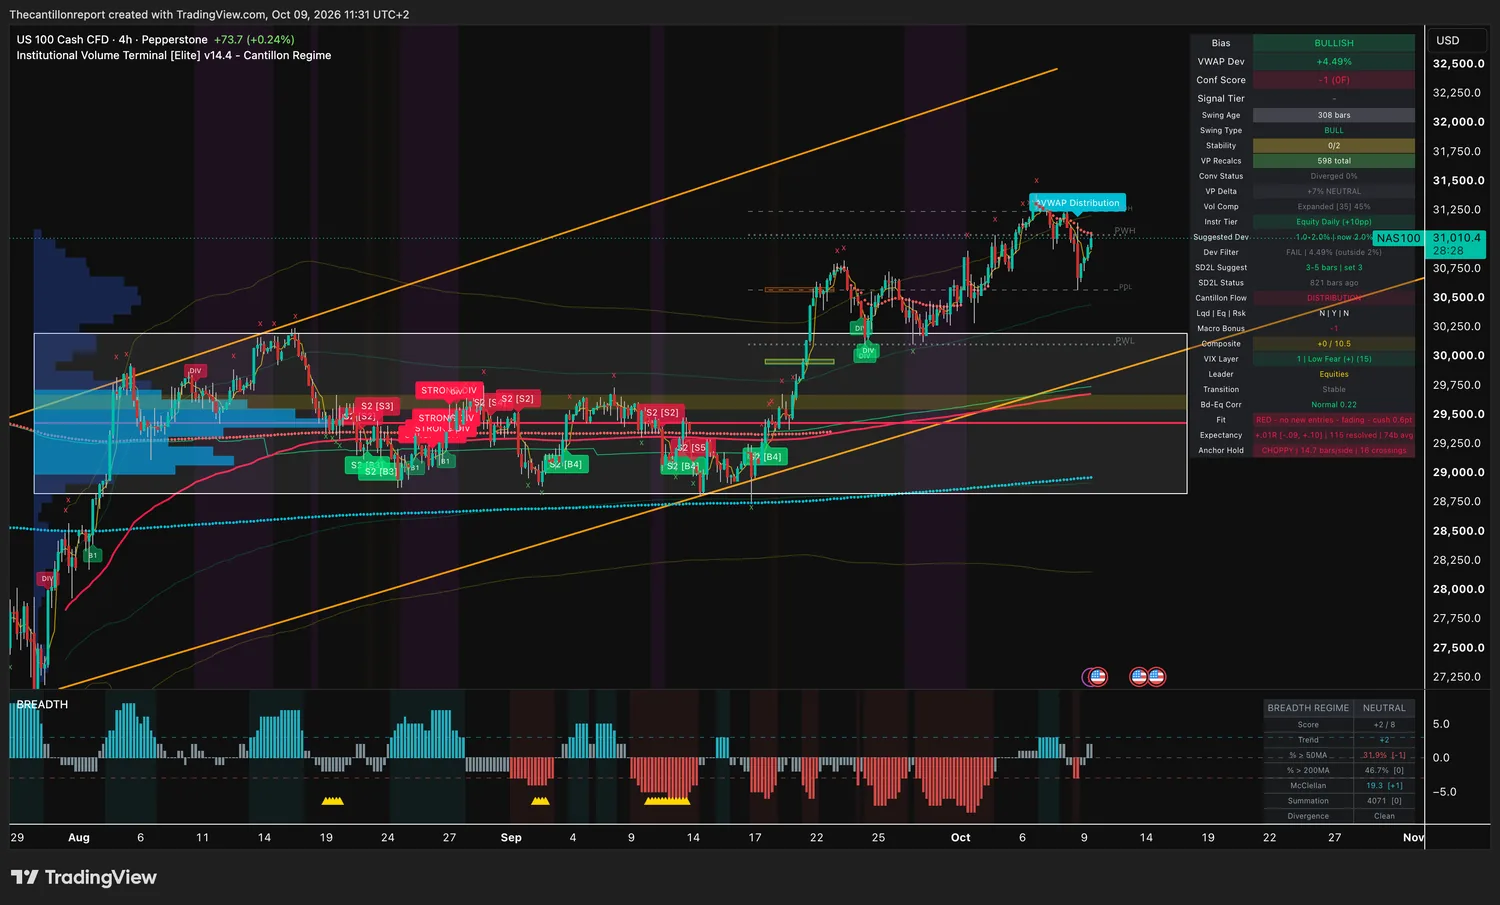
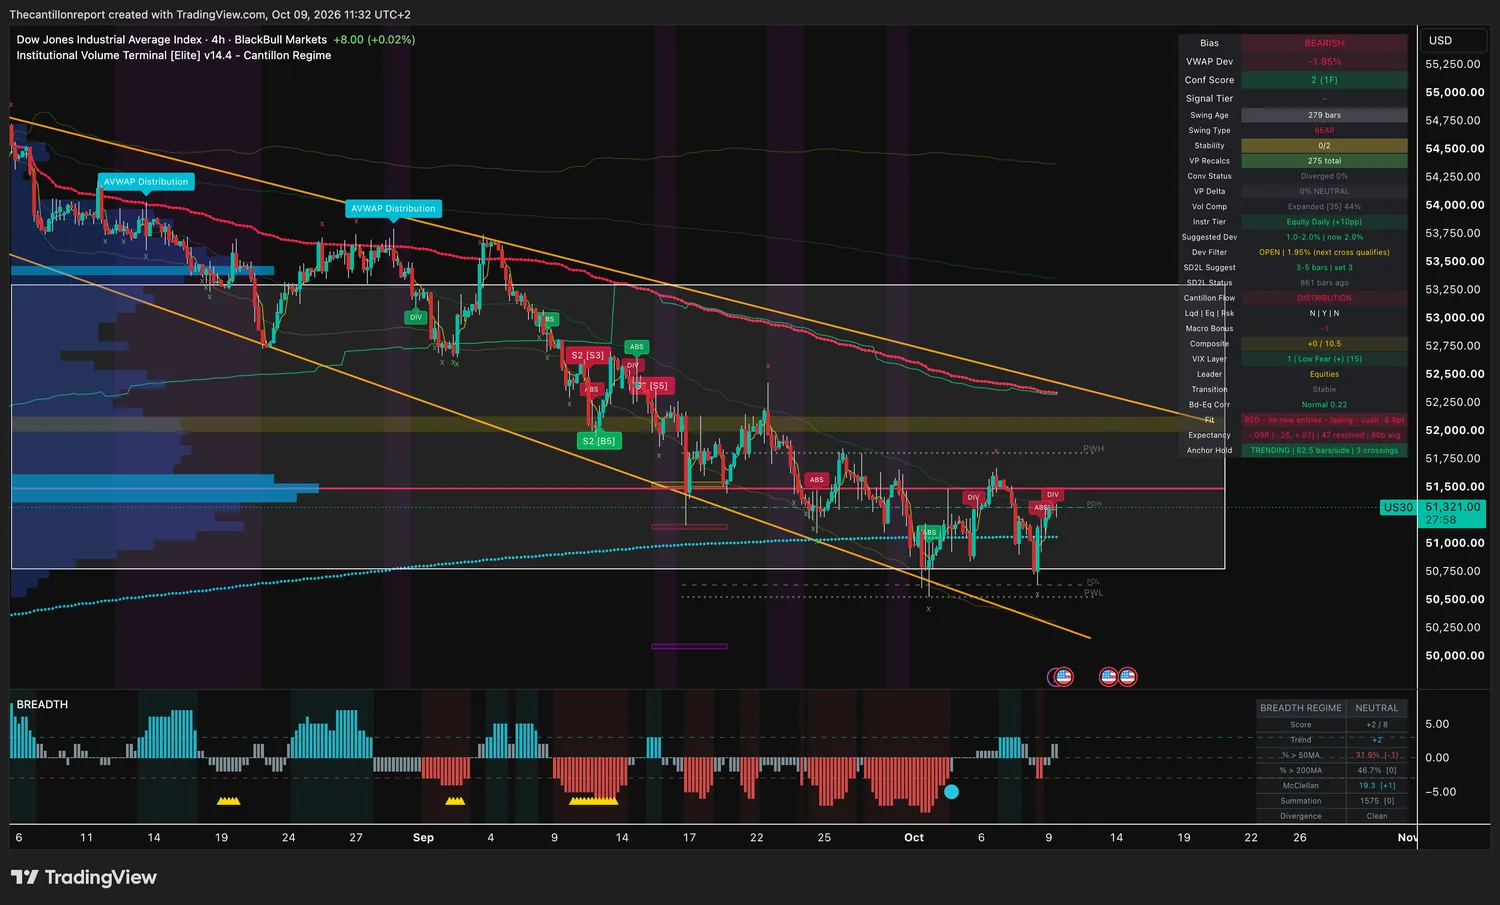
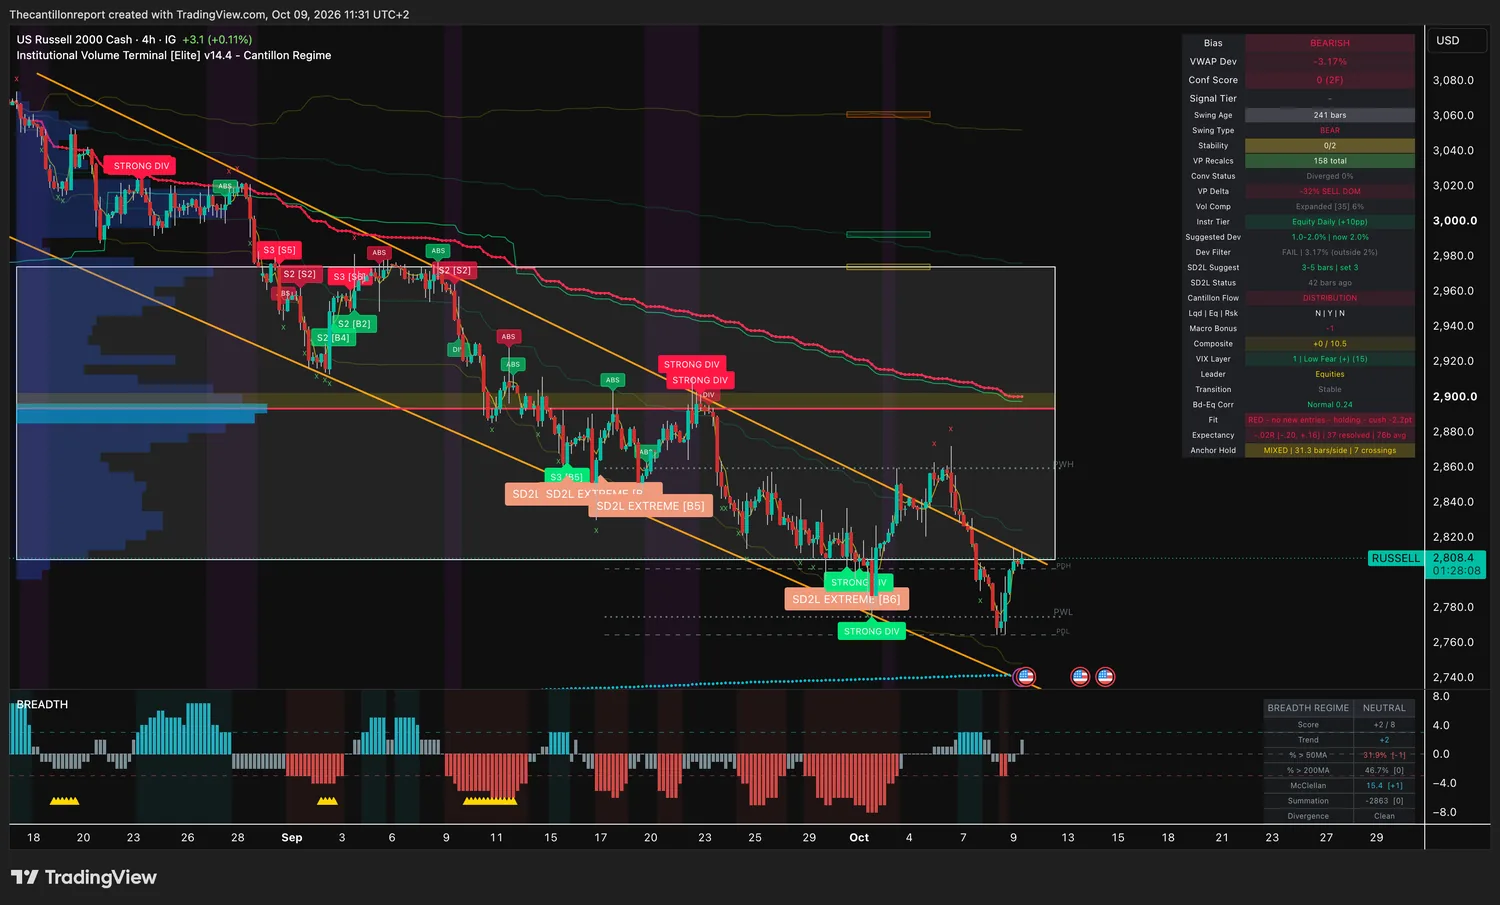
A report that OpenAI's annualised revenue runs about $20 billion below what investors had pencilled in hit the chip names on Thursday. The semiconductor index fell as much as 4% intraday. Micron lost more than 5%, and Arm, Intel and Marvell more than 6%. So the Nasdaq closed down 1.25% while the Dow finished up 0.10%, and that split is drawn on the index charts below.
- Yields Came Off The High The 10-year touched 5.35% and closed at 5.23%, after Fed Governor Waller said further hikes do not need to come at back-to-back meetings.
- No Strike Before November Trump said the US will not attack Iran before the November 3 midterms, and Brent slipped from above $104 to about $103.
Yesterday only the overnight index charts read Distribution. This morning every chart does. Bitcoin's slide switched risk appetite off on the stock charts too, and strength fell to +1 of 10.5 from +4. Bonds and stocks move together at 0.57 on single stocks, well over the 0.35 line, but only 0.22 on the index charts. Everything on the Board is half size.
Better than the regime. The broad-market panel on the stock charts reads Confirming, +3 of 8, back from Neutral −1 on Thursday. 31.9% of stocks sit above their 50-day average, up from 28.3%, and 46.7% above their 200-day, up from 45.1%. The McClellan oscillator swung to +26.8 from −36.4. Our own breadth engine, run at 02:31 CEST, agrees: an advance/decline ratio of 1.96 and a McClellan of +26.0. One good day of breadth does not turn the regime.
| Index | The line | What it means this morning |
|---|---|---|
| S&P 500 CFD 7,804.98 | Inside | 1.67% over its 7,676.8 cost line, inside the 2% window. Red, improving, −.12R over 26 signals. Confirmation 1 on no frames. A fair price with nothing behind it. |
| Nasdaq 100 CFD 31,010.4 | Extended | 4.49% over its cost line, more than twice its window, after the chip sell-off. Red and fading, +.01R over 115. Crossed its line 16 times. |
| Dow CFD 51,321 | Inside, short side | 1.95% under its 52,341.7 cost line, back inside the window from 2.70% under yesterday. Red and fading, −.09R over 47. |
| Russell 2000 CFD 2,808.4 | Lost it | Up 30.3 points from yesterday's 2,778.1 and still 3.17% under its 2,900.3 line. Sellers on 32% of the volume. Red, holding, −.02R over 37. |
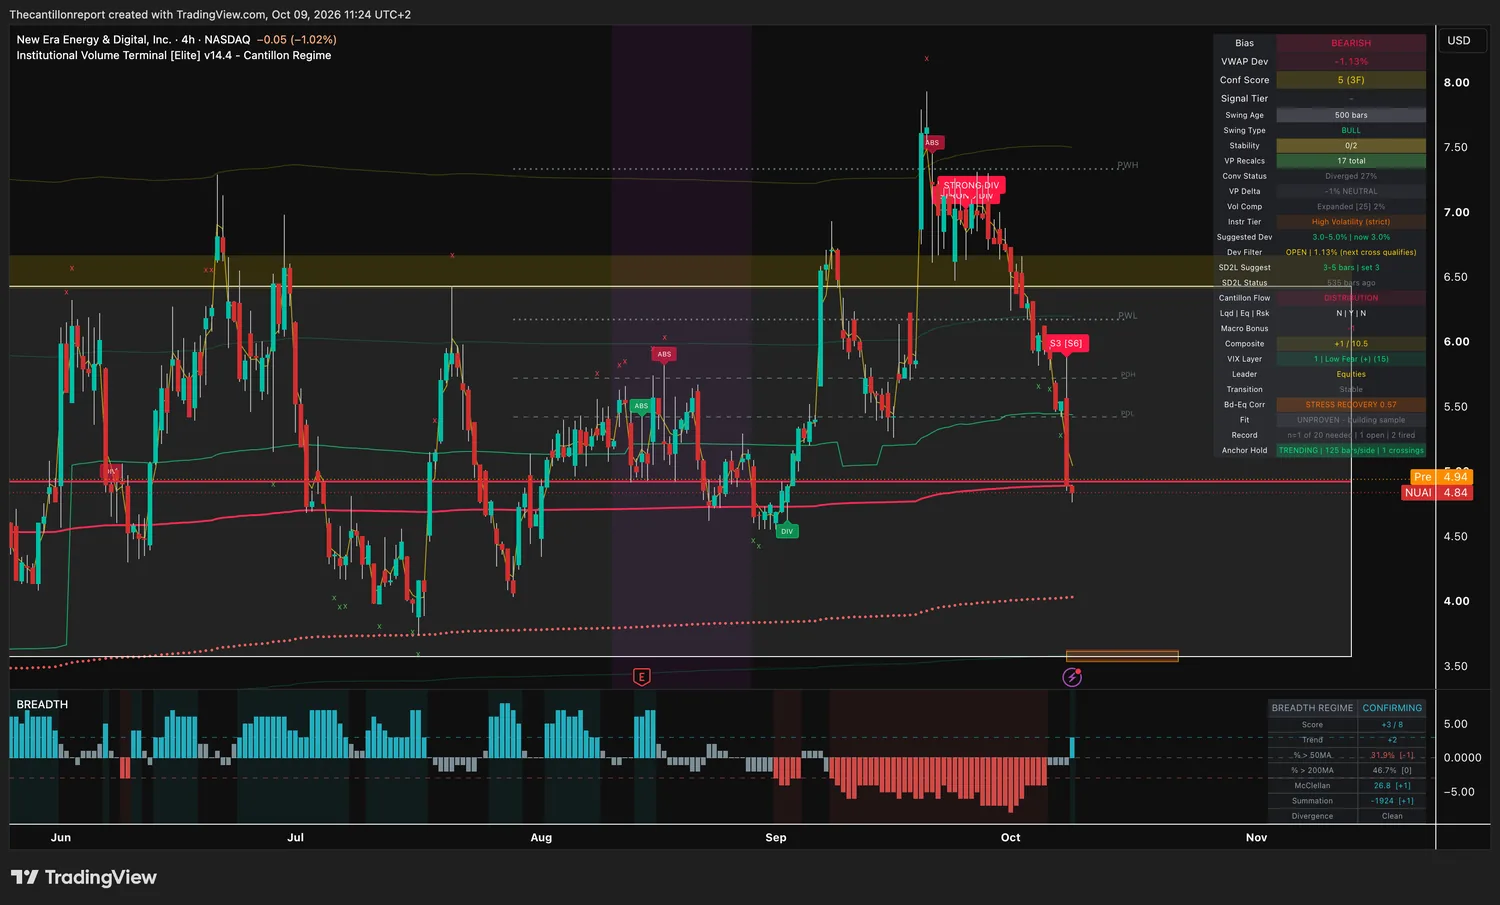
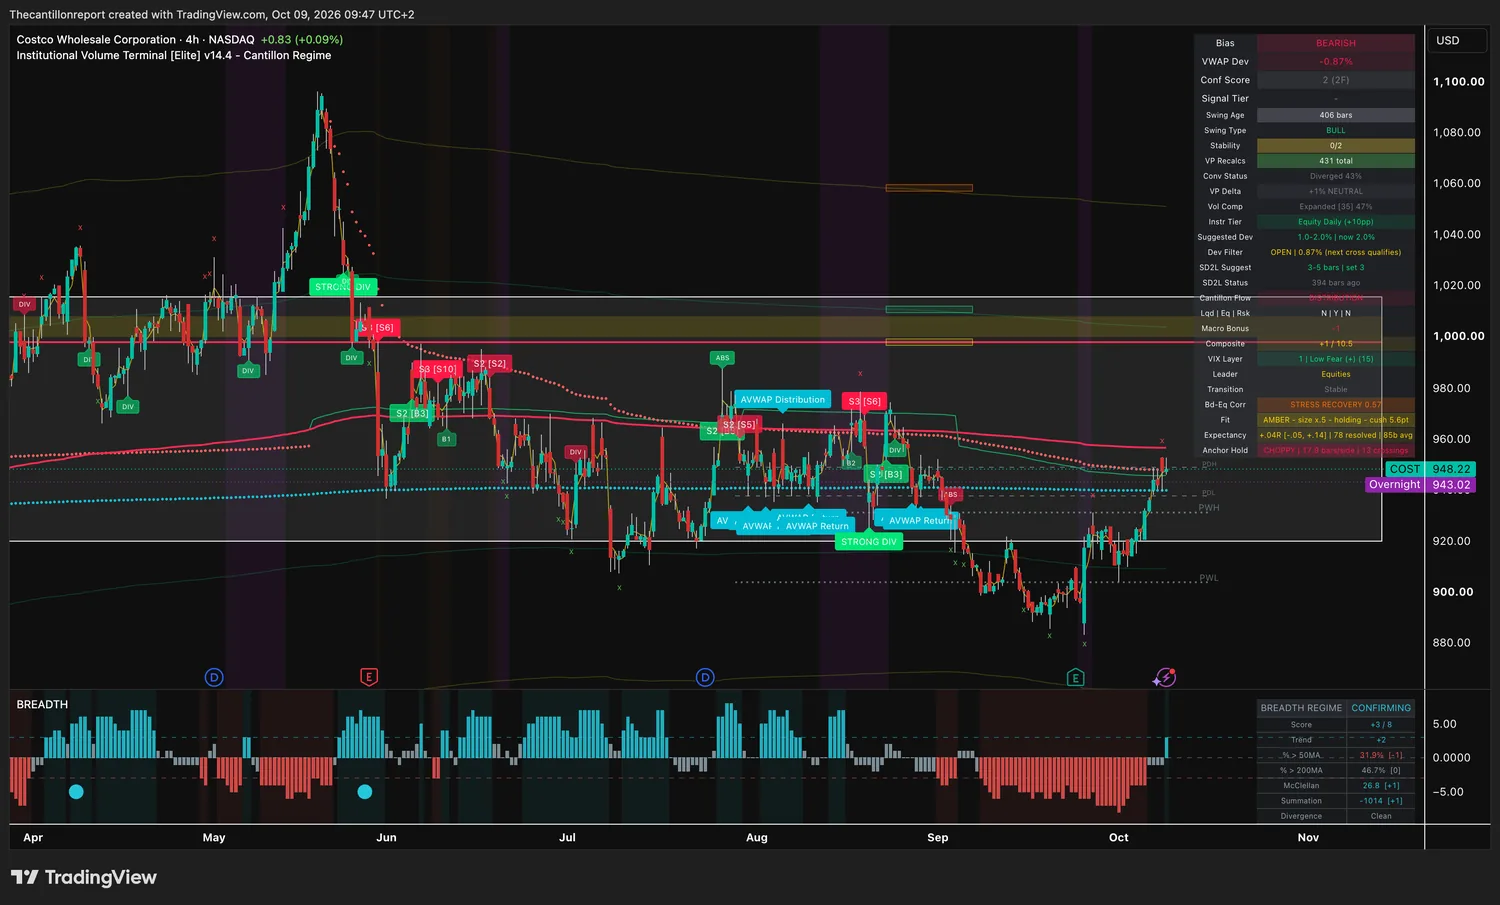
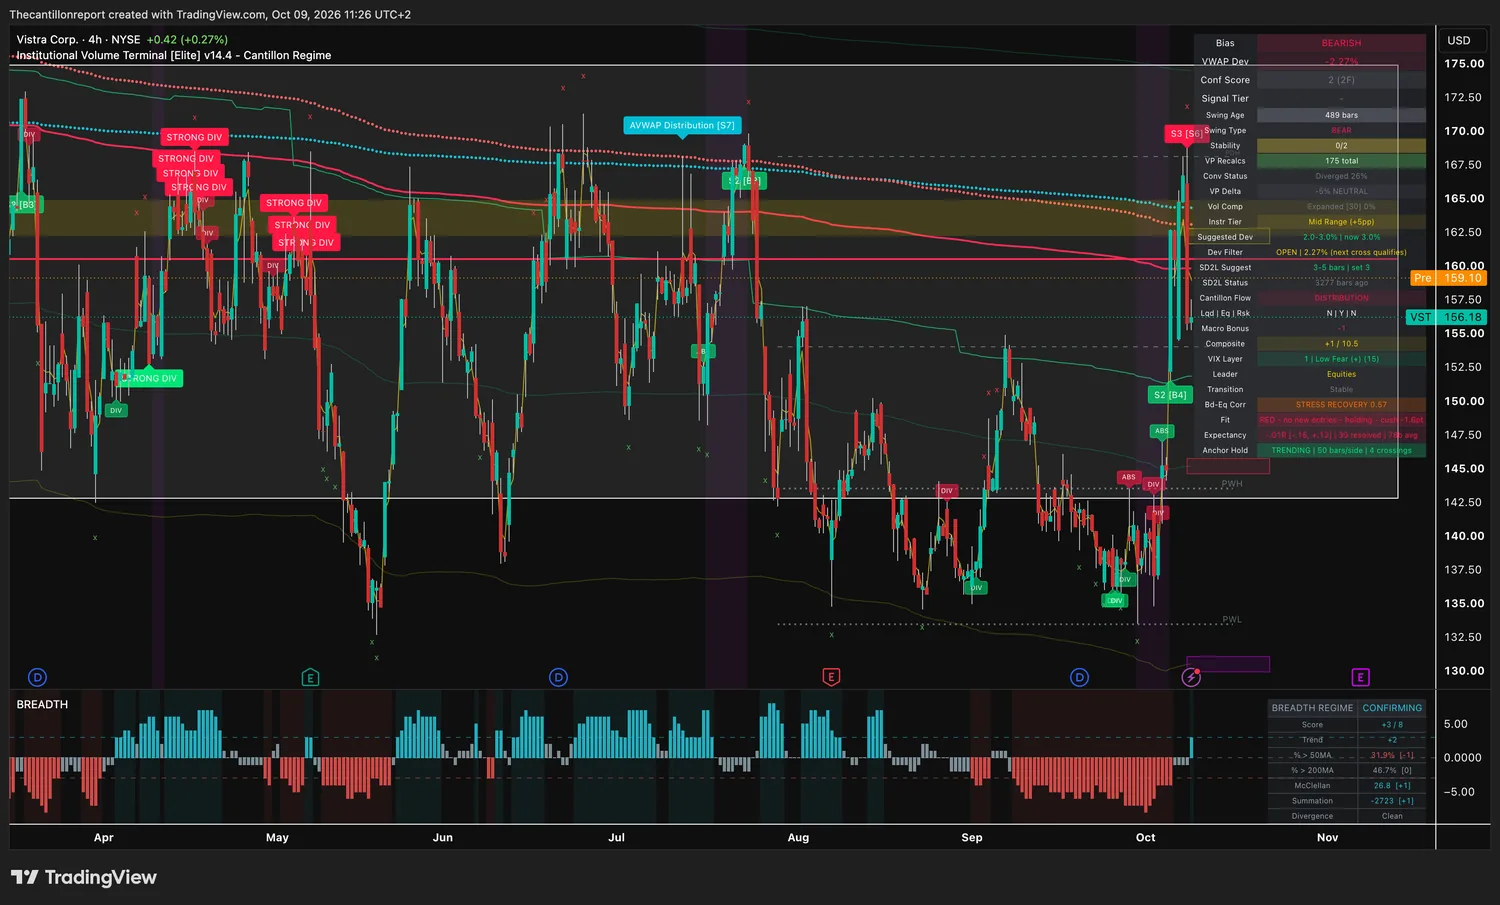
Sixteen stocks on this scan carry a pre-market or overnight print. Five of them sit within half a percent of their cost line: MercadoLibre 0.12% under, Recursion 0.18% under, Nutrien 0.26% over, Vistra 0.44% under and Dollar General 0.48% under. NUAI closed Thursday under its line and printed 0.91% over it before the bell.
Price drifting across a cost line in a thin pre-market tape is not a decision. So nothing on this page triggers on a pre-market print. Every entry and every exit below is judged on the first four-hour close after the 15:30 CEST open. Same side of the line as Thursday's close: trade as written. Other side: wait for the next close.
| # | Ticker | Dir | Why it is on this list | Size |
|---|---|---|---|---|
| 1 | TTEK | Long | Slid from $37 to its cost line, bounced off it in Thursday's session, and is wound 88%Conf 2 / 1 frame · building 88% · +.06R over 101 signals, range −.03 to +.14 · amber, holding, 7.7-point cushion | Half |
| 2 | CF | Short | Under its cost line for a week, with the range wound as tight as the terminal measures and the light improvingConf 2 / 1 frame · building 100% · +.08R over 72 signals, range −.05 to +.20 · amber, improving, 8.8-point cushion | Half |
| 3 | OUST | Long | The best record on the scan, pulled back from $46 toward its line. The overnight bid lifted it out of the window, so the entry is a dipConf 2 / 1 frame · expanded 59% · +1.07R over 28 signals, range −.02 to +2.16 · amber, fading, 44.3-point cushion | Half |
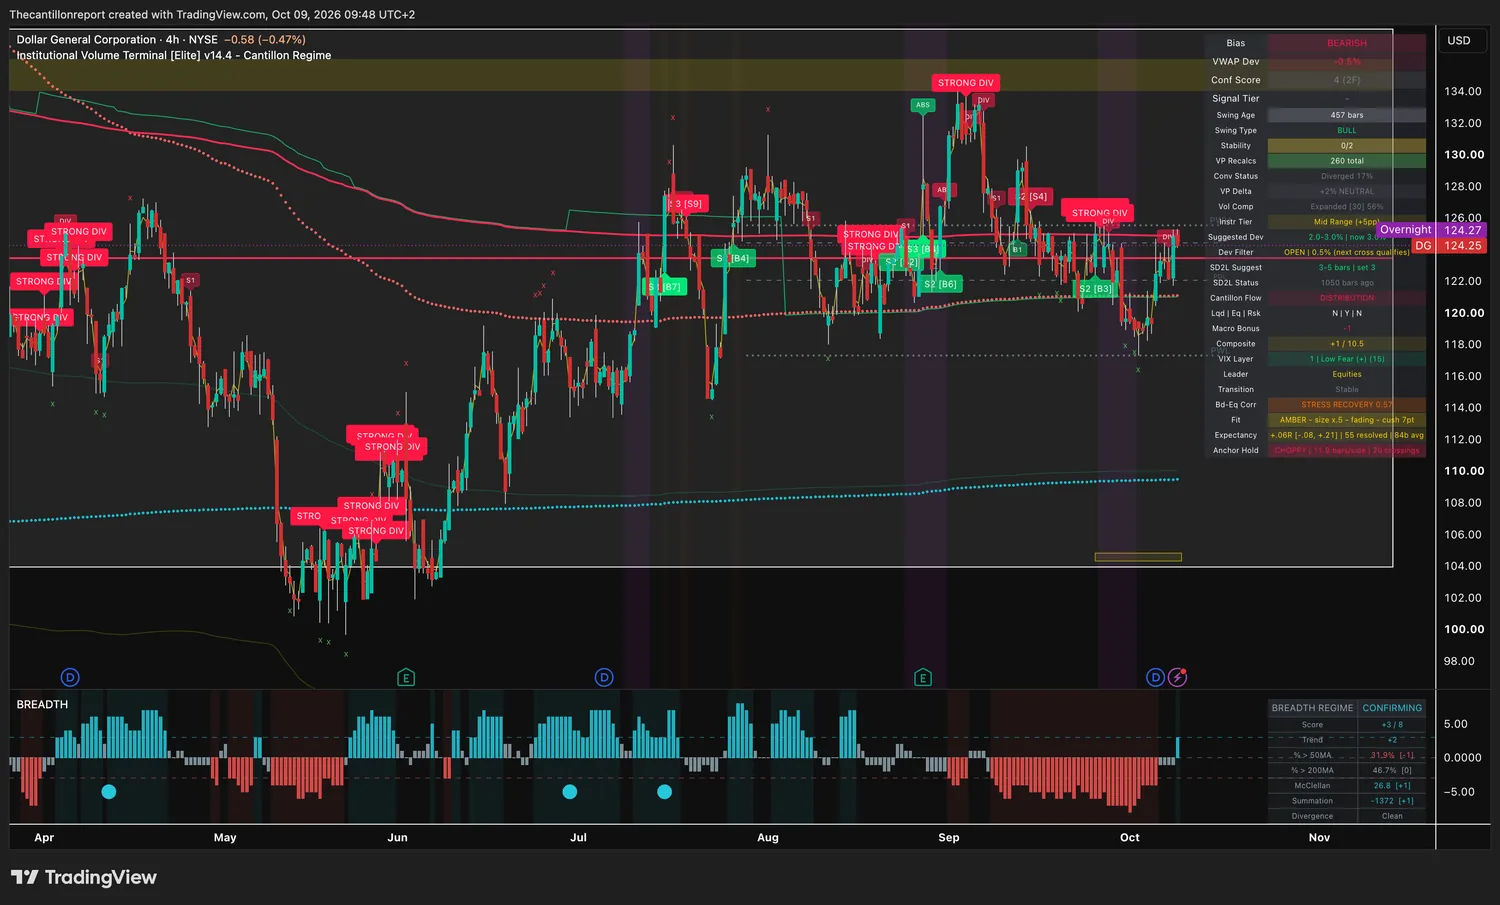
| 4 | DG | Short | Held from Thursday. Still under its cost line before the bell, and agreement rose from one frame to twoConf 4 / 2 frames · expanded 56% · +.06R over 55 signals, range −.08 to +.21 · amber, fading, 7-point cushion | Half |
| 5 | NUAI | Short | A tier 3 sell fired on the slide from $6, with three timeframes agreeing. But it printed over its line before the bell, so it ranks fifthConf 5 / 3 frames · expanded 2% · record: 1 of 20 signals, no rate · no light yet | Half |
| 6 | COST | Short | Rallied $70 off the late-September low straight into its cost line and stalled thereConf 2 / 2 frames · expanded 47% · +.04R over 78 signals, range −.05 to +.14 · amber, holding, 5.6-point cushion | Half |
| # | Name | Side | Entry (distance · price) | Trigger | Get out at | Size |
|---|---|---|---|---|---|---|
| 1 | TTEK | Long | +3.09% · $33.40 band $32.40–$33.37 | 4h close above $32.40 after the open, filled at $33.37 or lower | $31.80 | Half |
| 2 | CF | Short | −1.54% · $113.57 band $115.35–$111.89 | First 4h close after the open under $115.35 | $117.60 | Half |
| 3 | OUST | Long | +2.79% · $39.53 band $38.46–$39.61 · overnight $40.52 | Back inside the band, then a 4h close above $38.46 | $37.50 | Half |
| 4 | DG | Short | −0.50% · $124.25 band $124.87–$121.13 | First 4h close after the open under $124.87 | $126.20 | Half |
| 5 | NUAI | Short | −1.13% · $4.84 band $4.90–$4.75 · pre-market $4.94 | First 4h close after the open under $4.90 | $5.15 | Half |
| 6 | COST | Short | −0.87% · $948.22 band $956.54–$937.41 · pre-market $943.02 | First 4h close after the open under $956.54 | $965.00 | Half |
This one is free. The other four this week were not.
Every level, every execution block and all 21 terminal captures, with nothing held back and no gate anywhere on the page. Monday through Thursday the entry levels sit behind the member wall. Every Friday the whole thing ships open.
What you are doing: buying an engineering consultancy that fell 12% from its September high and bounced off the price large money paid, once the regular session confirms the bounce.
What you are doing: selling a fertiliser maker that lost its cost line a week ago, on a fully wound range, if the session closes its first bar on the short side.
What you are doing: buying the scan's best record on a pullback to the price large money paid, not at the overnight price.
Tetra Tech closed Thursday at $33.40, three cents over the top of its entry window, and printed the same before the bell. At $33.37 or lower the long qualifies, as long as the first four-hour close after the open holds above the cost line. A close under $31.80 takes it off the Board.
| Name | Distance from cost | Comes back at | Why it is not a trade |
|---|---|---|---|
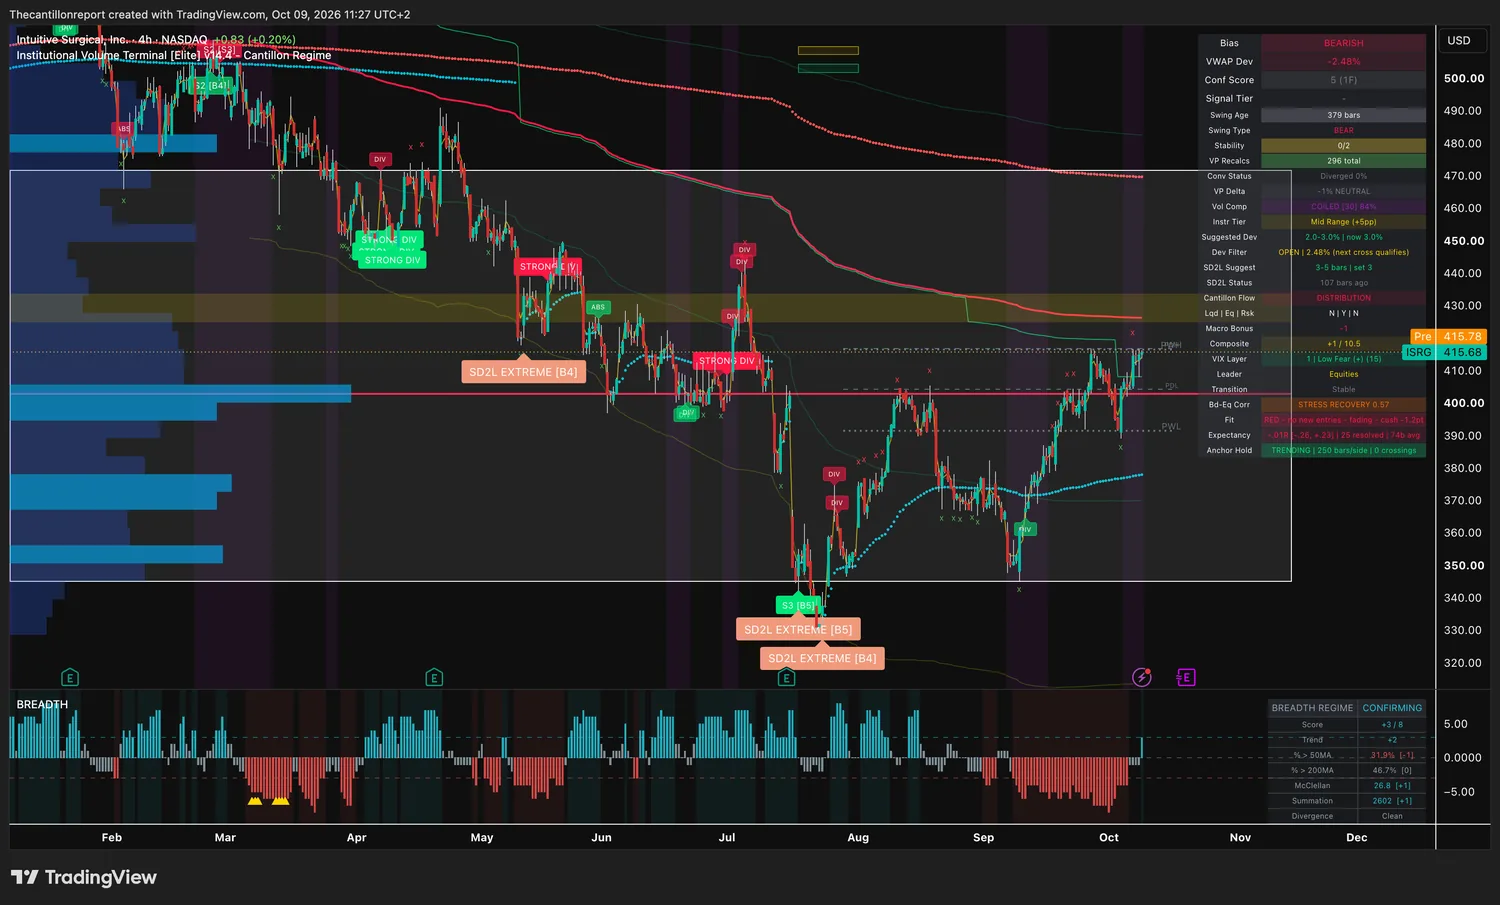
| ISRG | −2.48% | Window open, $413.46 edge | Coiled 84% with confirmation 5, but red and fading, −.01R over 25. It is rallying into its $426.25 line from below. Selling before it rejects sells the rally. |
| VST | −2.27%, pre −0.44% | Window open | Tier 3 sell fired at the $170 spike. Red, holding, −.01R over 39. Pre-market climbed back to the $159.81 line. |
| RXRX | −1.67%, pre −0.18% | Window open | Confirmation 4 on one frame, 9 of 20 signals. Pre-market sits on the $4.02 line. The close decides. |
| MELI | −0.21%, pre −0.12% | Window open | On its $1,859.54 line with a red, fading light, −.12R over 43 and a cushion of −11.1 points. |
| NTR | +0.27%, pre +0.26% | Window open | Wound 100% on its $69.72 line, confirmation 4. Red, holding, −.02R over 26. |
| SPGI | −1.94% | Window open, $398.38 edge | Rallying into its $410.70 line from below. Red, holding, −.12R over 71. |
| SPOT | +2.66% | Window open, $528.38 edge | Near the top of its window on confirmation 2, with 15 of 20 signals. Wait for a dip toward $512.99. |
| JPM | +2.91% | $328.52 | Out of its window again after one day inside. Red, fading, .00R over 95. Earnings are marked for next week. |
| BRK.B | +2.99% | $506.21 | Broke out of a 95% coil and ran past its window. Red, fading, +.03R over 83, line crossed 15 times. |
| BITB | +1.97%, overnight +2.91% | Window open | Confirmation 0. Three of 20 signals. Nothing agrees. |
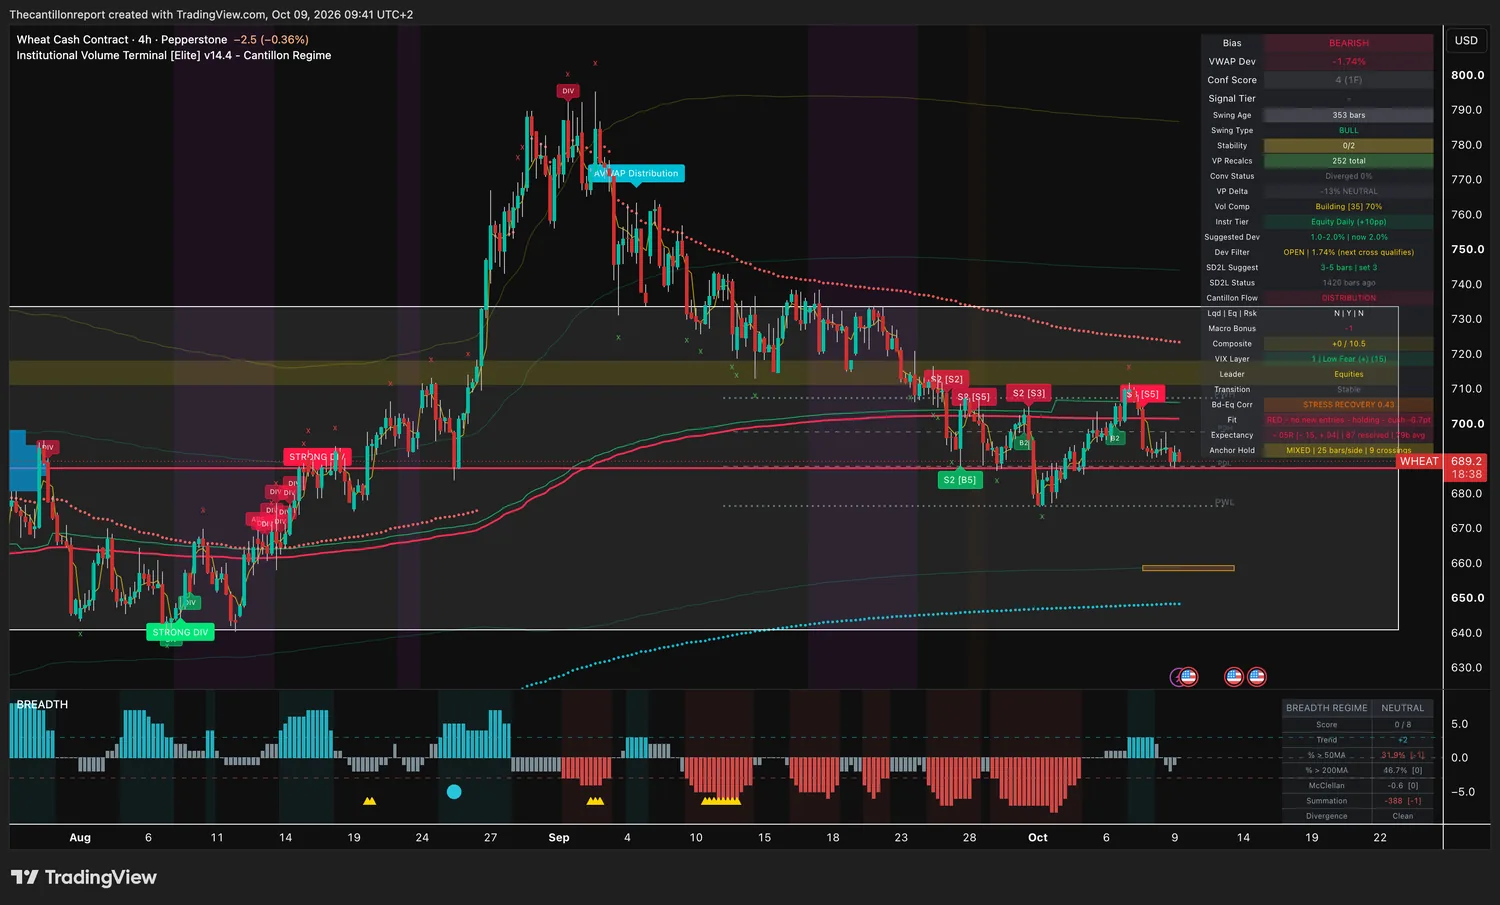
| WHEAT | −1.74% | Window open, 687.38 edge | Red, holding, −.05R over 87. Four sell signals since late September and no follow-through. |
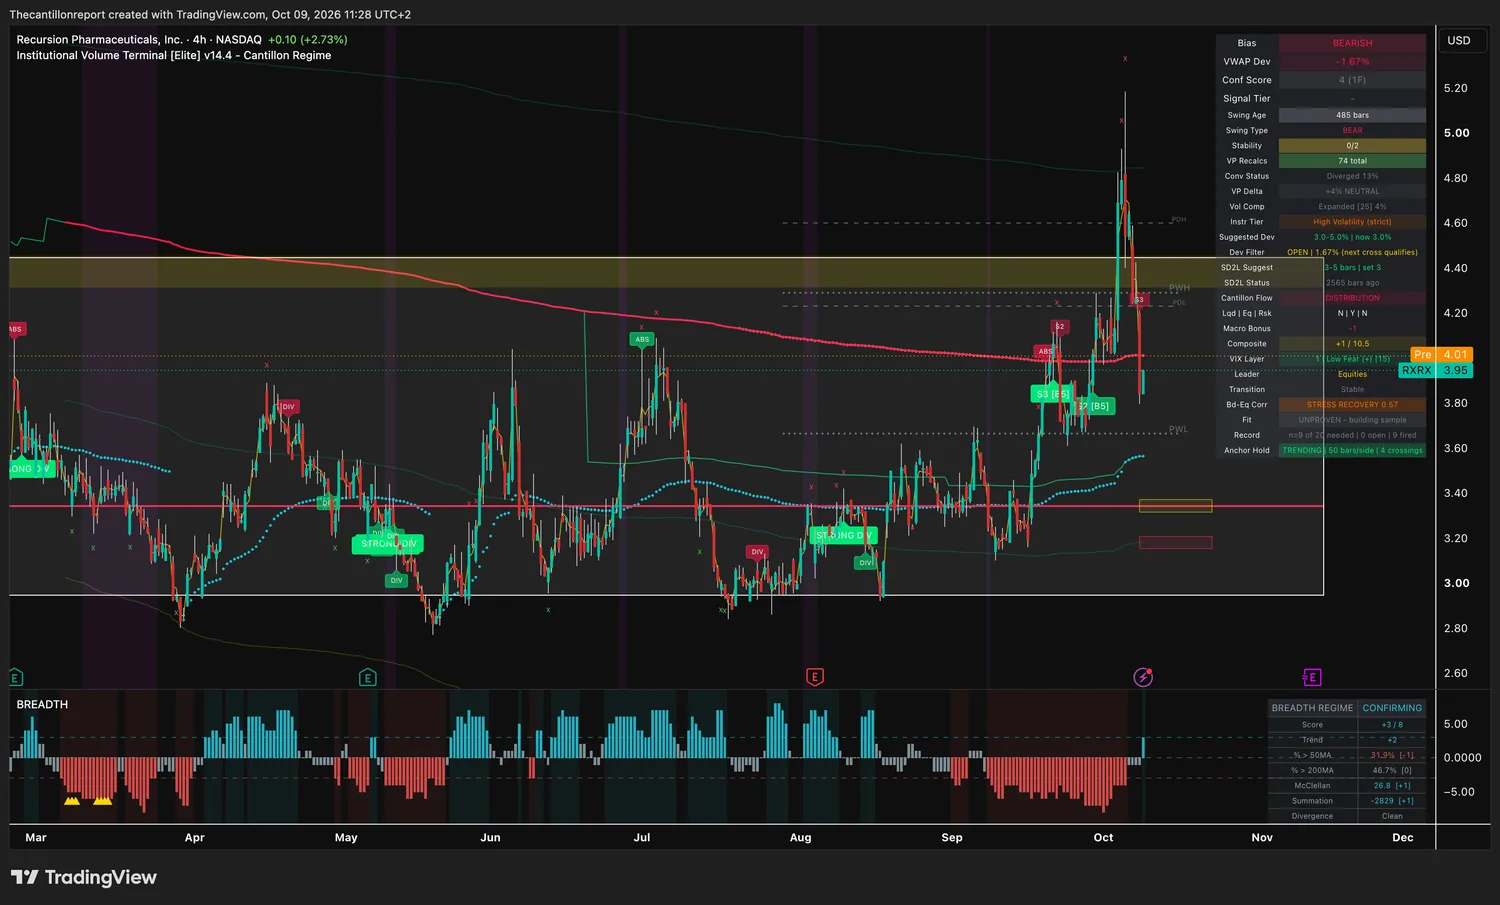
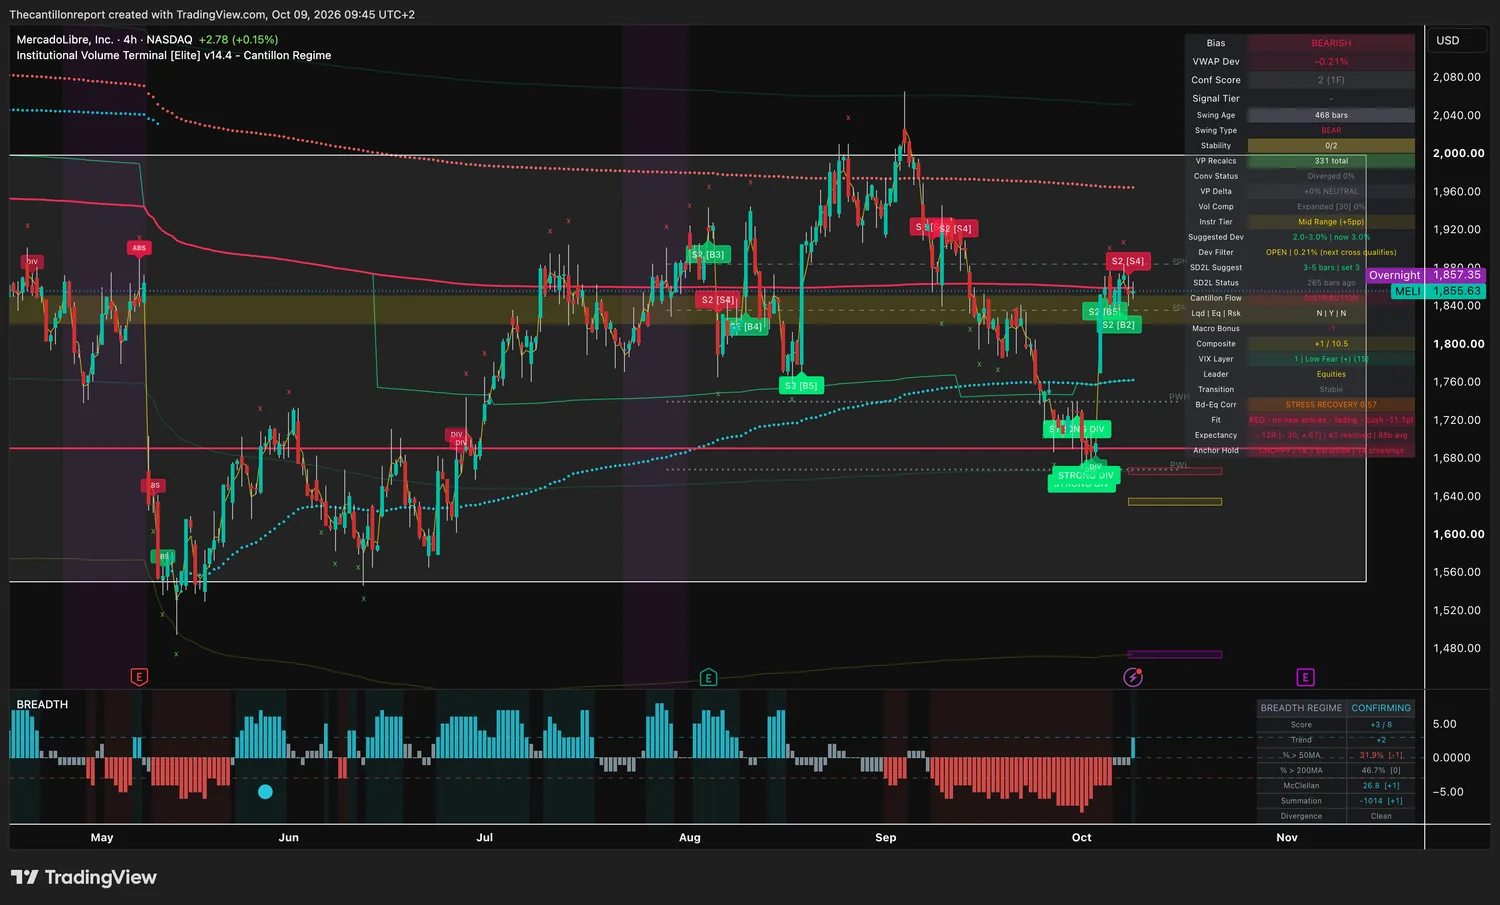
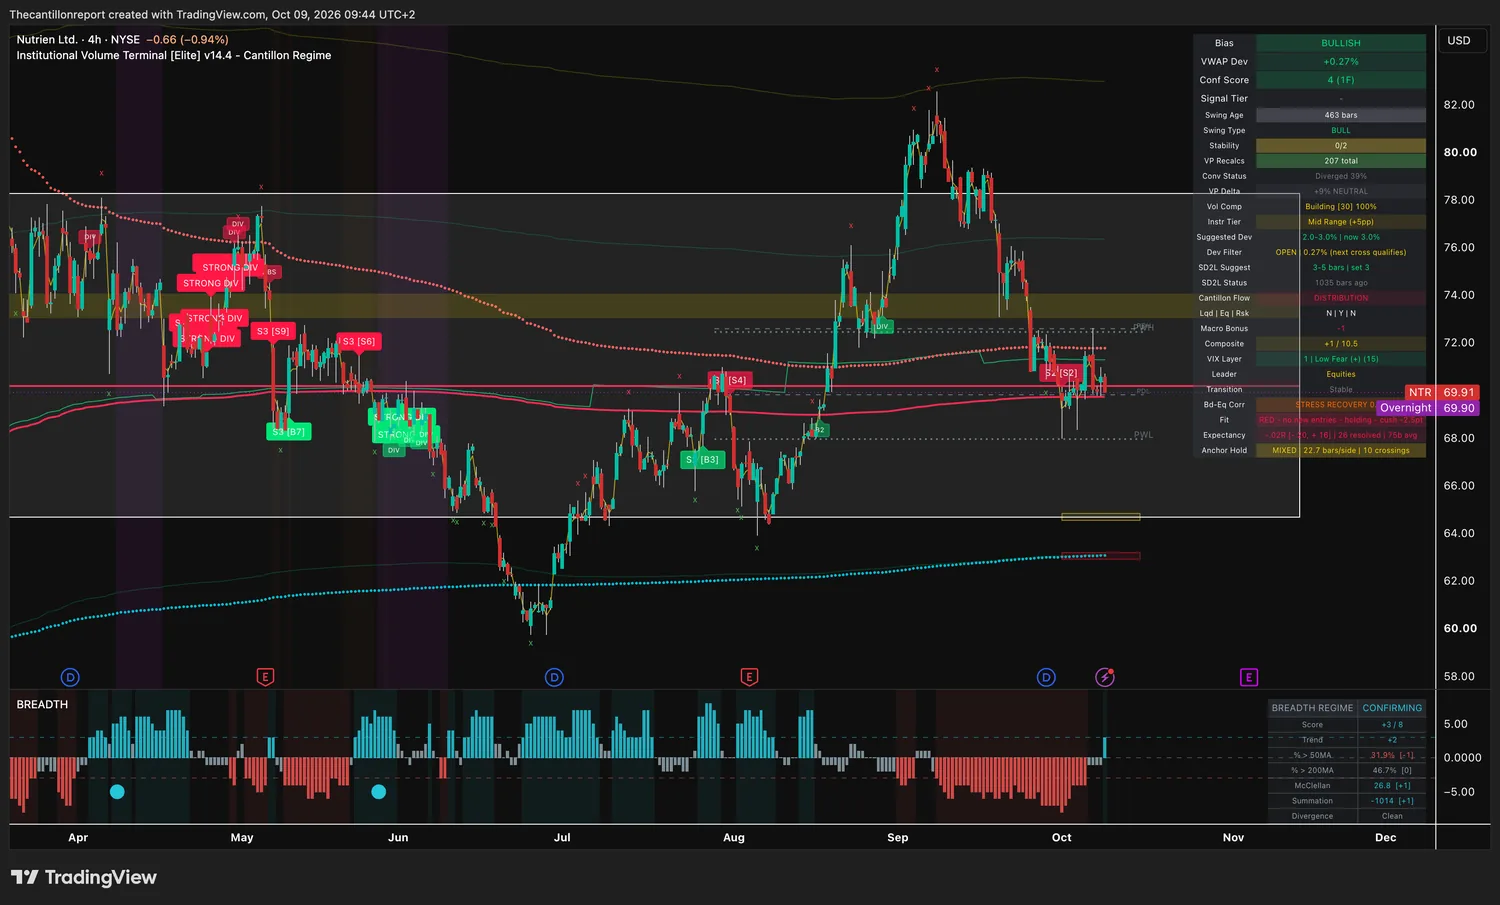
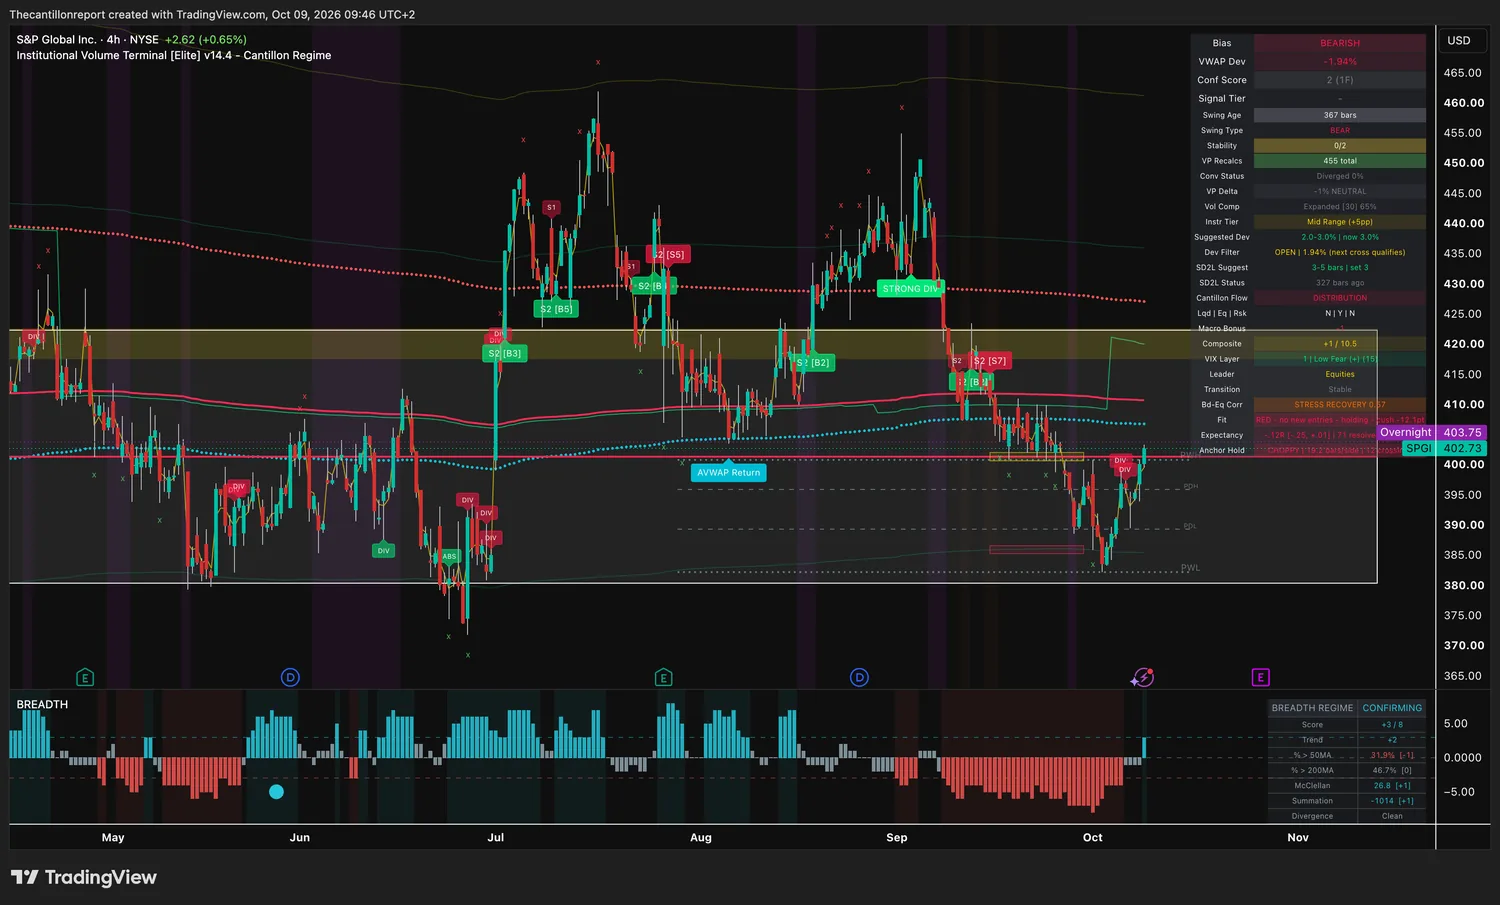
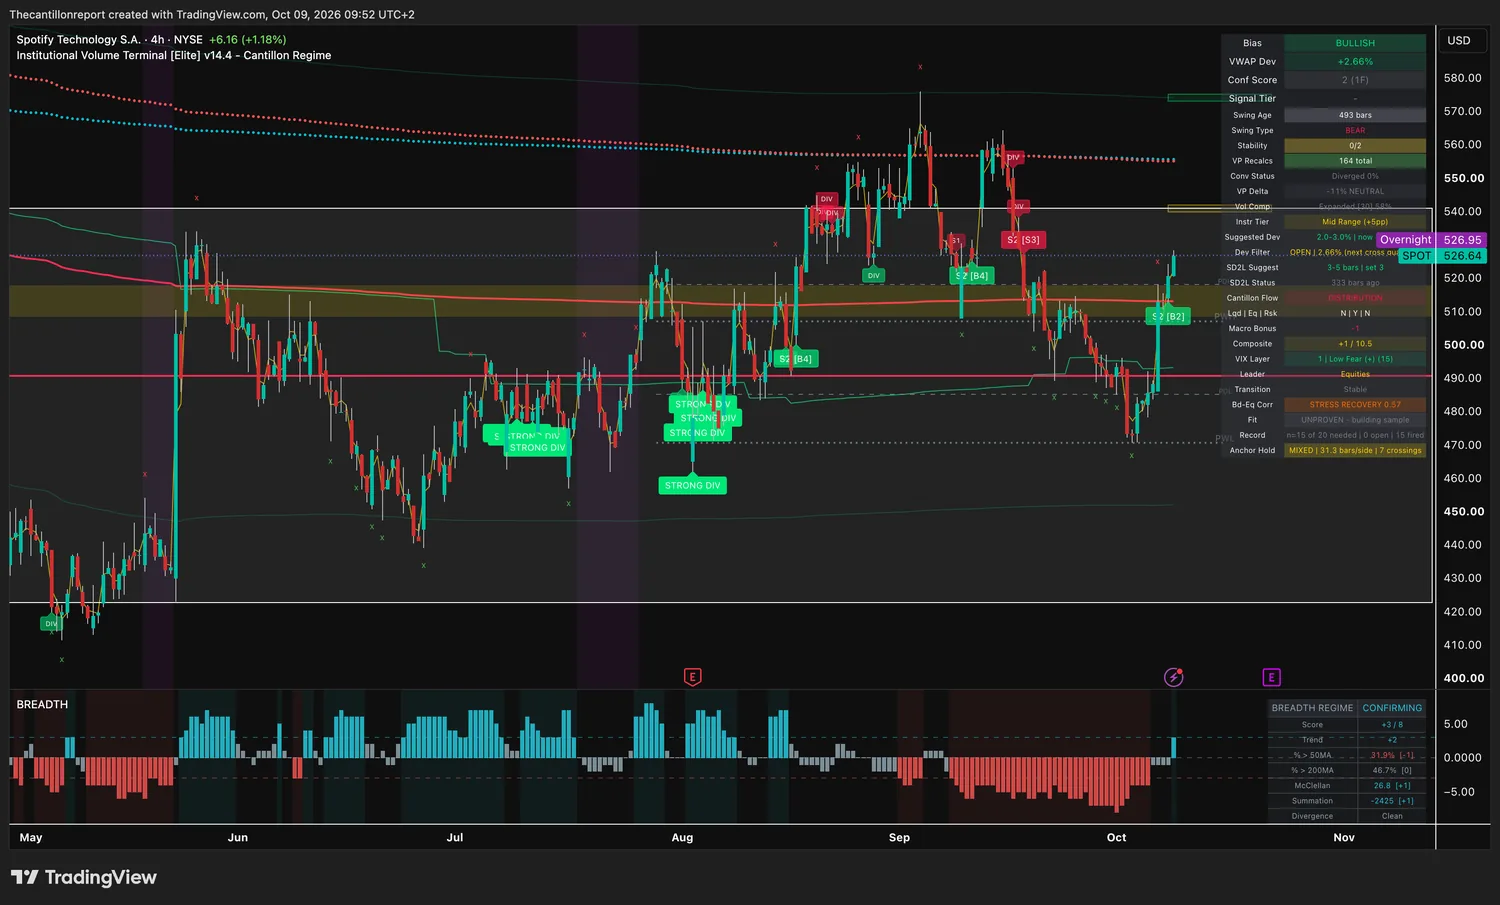
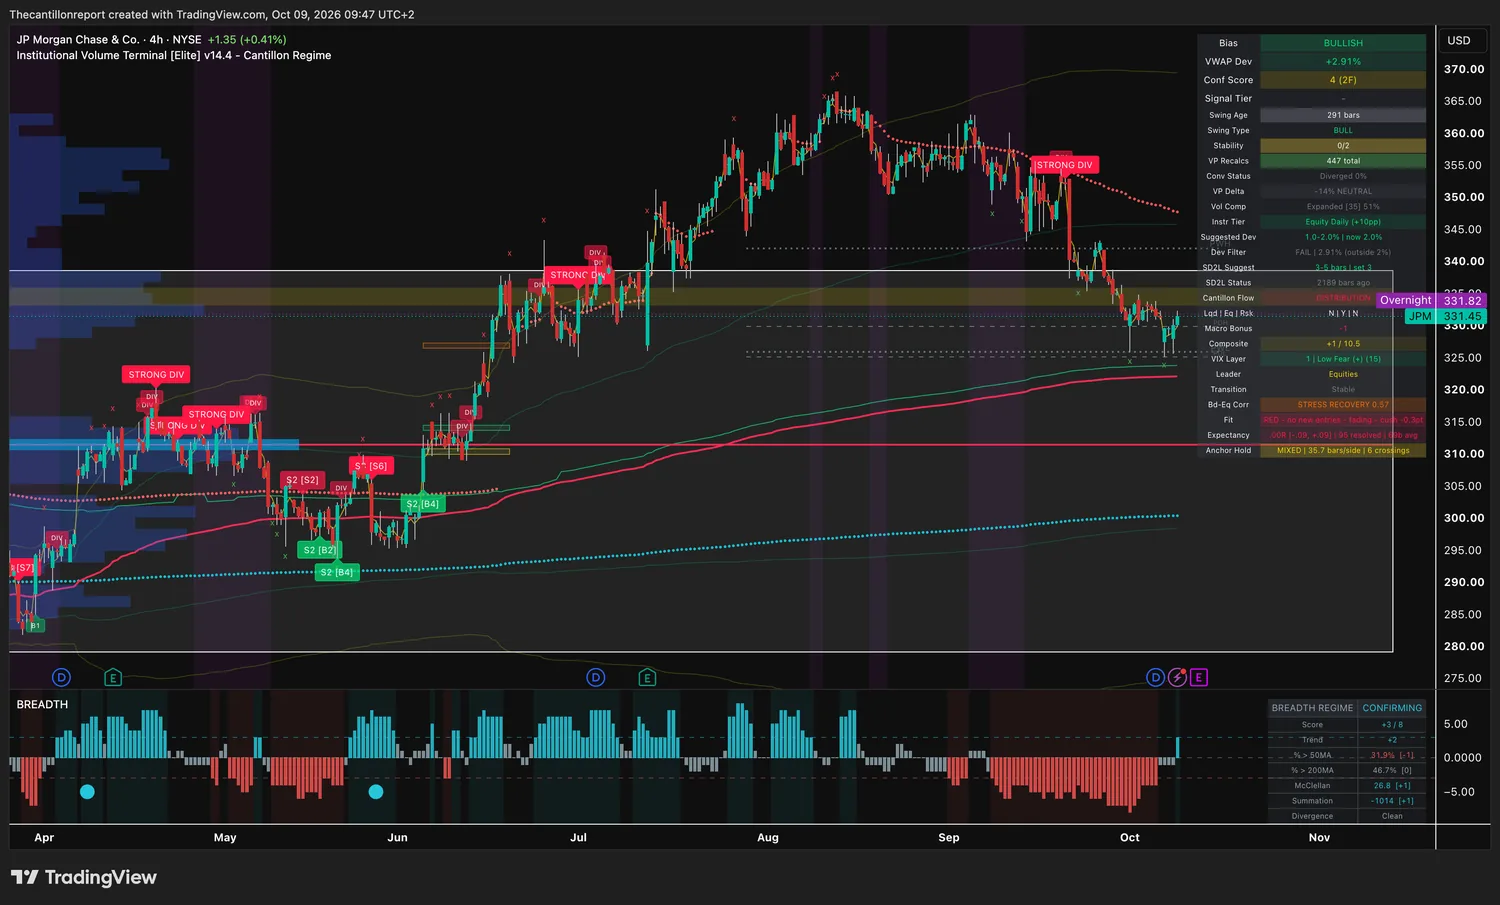
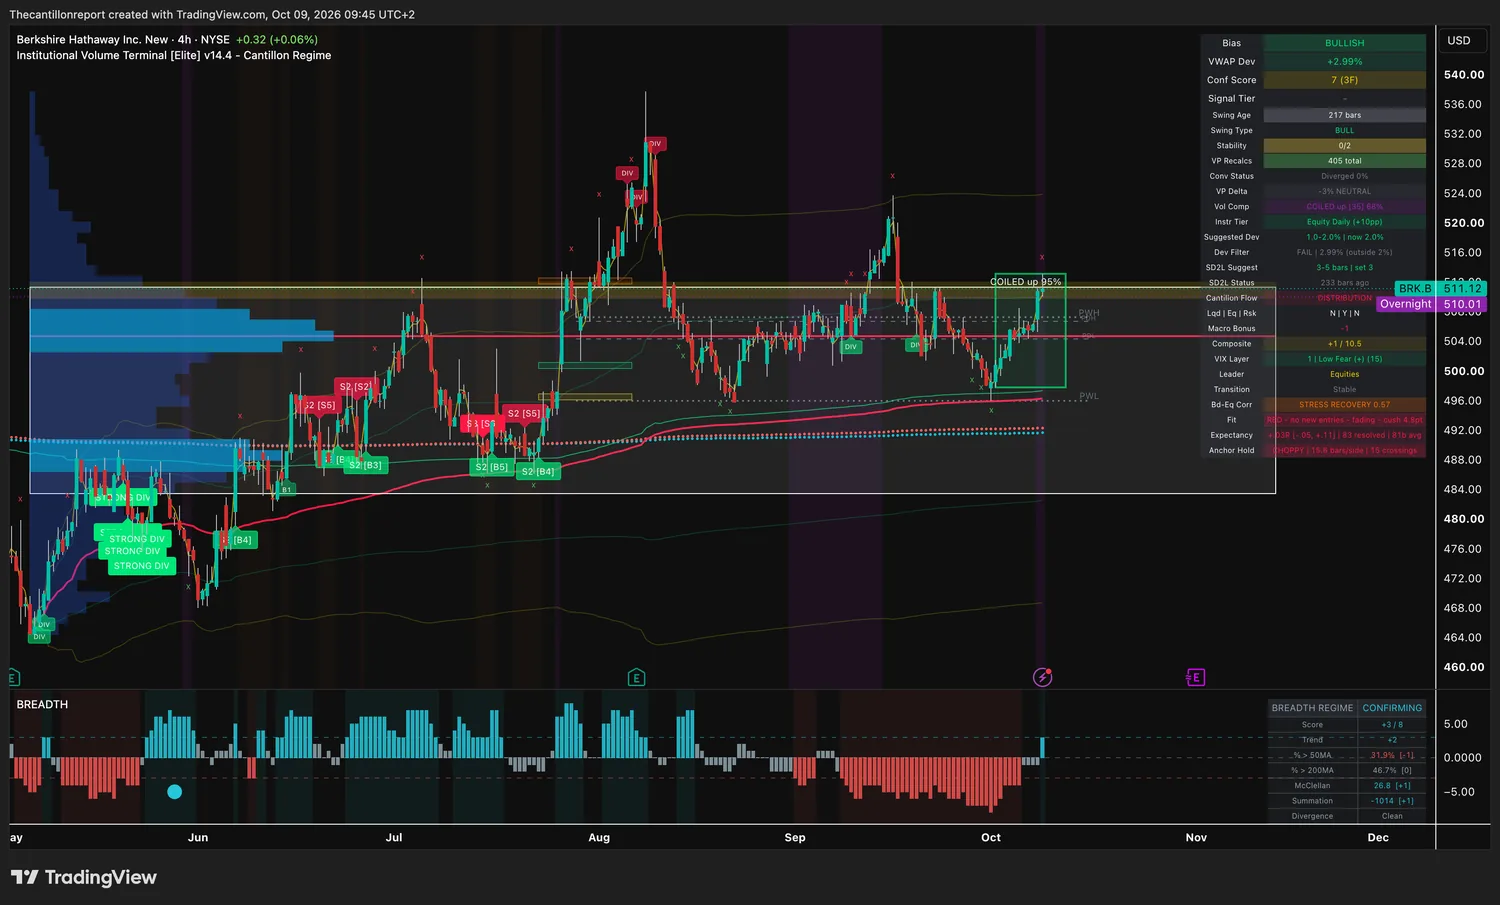
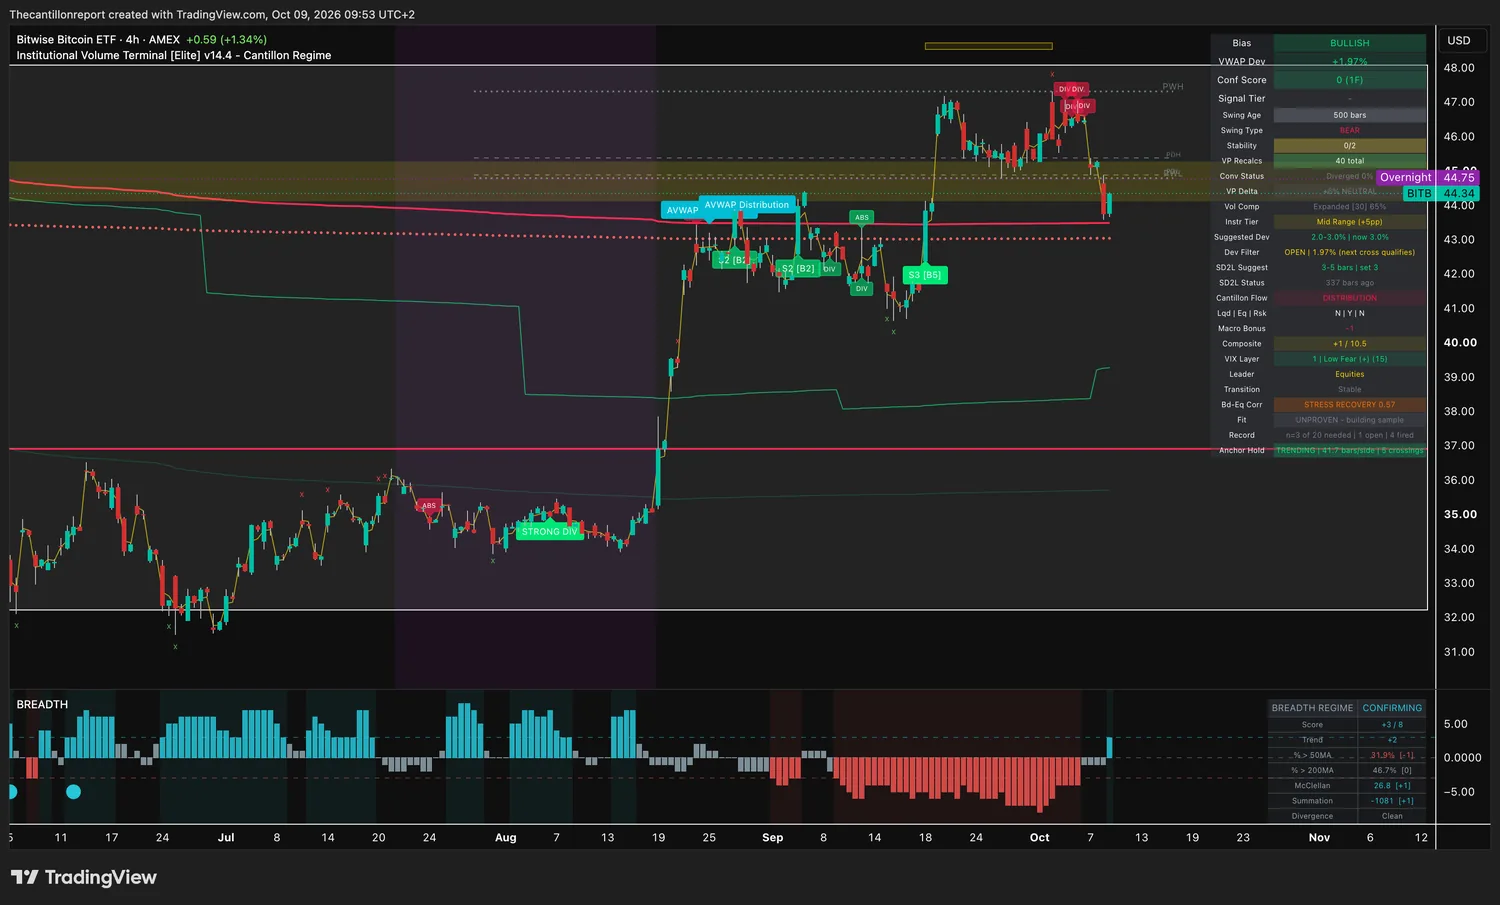
Cost line (the anchor) · the volume-weighted price large money actually paid over the current swing. Everything in this brief is measured as distance from it. Buy near it and you are paying what they paid. Buy far above it and you are paying their profit. Entry window · how far from the cost line a new entry can still be sensibly priced. Inside it, the entry is fairly priced. Past it, the move has already run and you wait for a pullback. Compression · how tightly the range has wound, from 0 to 100%. High means the next move should be a big one. It says nothing about direction, and it never overrides a shut window. Confirmation · how many independent readings agree, and across how many timeframes. Higher on both counts is better. Record · the average result per signal in units of risk, where being stopped out is exactly −1.00. Always published with the number of finished signals behind it, and measured over the same history the settings were chosen on. Below 20 finished signals no rate is published. A short record is not a verdict on the chart, only on what can be measured yet. Trend light · green means full size, amber means half, red means no new entry however good the chart looks. A chart with no light yet, because its record is still being built, is sized at half.
Readings captured Friday 9 October 2026 between 09:41 and 11:32 CEST from the IVT v14.4 terminal, on four-hour bars that had not yet closed. Prices marked pre-market or overnight are extended-hours prints. US exchanges open at 15:30 CEST. Cost lines and window edges are derived from the terminal's published percentage distances. Index levels are CFD feeds and differ from the cash index.
Records are in-sample and forecast nothing. No rate is published on fewer than twenty finished signals, and the sample size is printed beside every one.
Charts are unmodified terminal captures provided for reference, not as entry instructions. Educational content only. Not financial advice. Past results do not predict future ones.