The Only Short Is A Bond Proxy.
Two trades pass every check this morning, both at half size: American Water Works short and Walt Disney long. A water utility trades like a bond, and the 10-year yield has just closed at a 19-year high. Every index carries a red light that blocks new entries, and the S&P 500 has to fall back to 7,694 before one is even allowed.
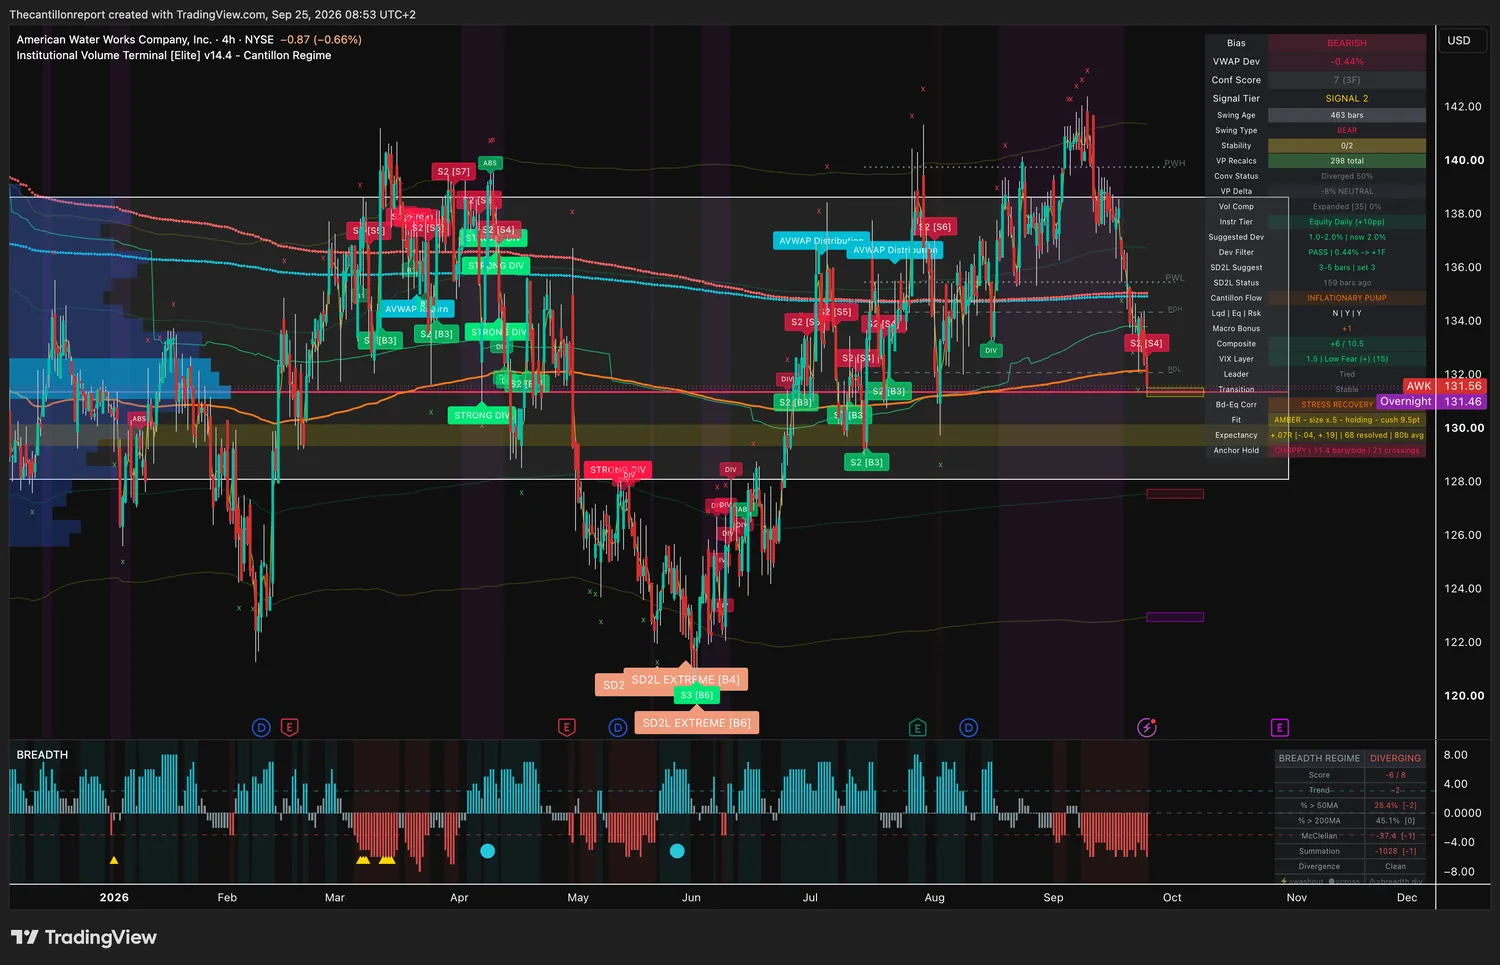
| Sell | AWK, half size. The only chart where the entry signal has printed and the light is not red. Window $129.50 to $132.14, last $131.56. |
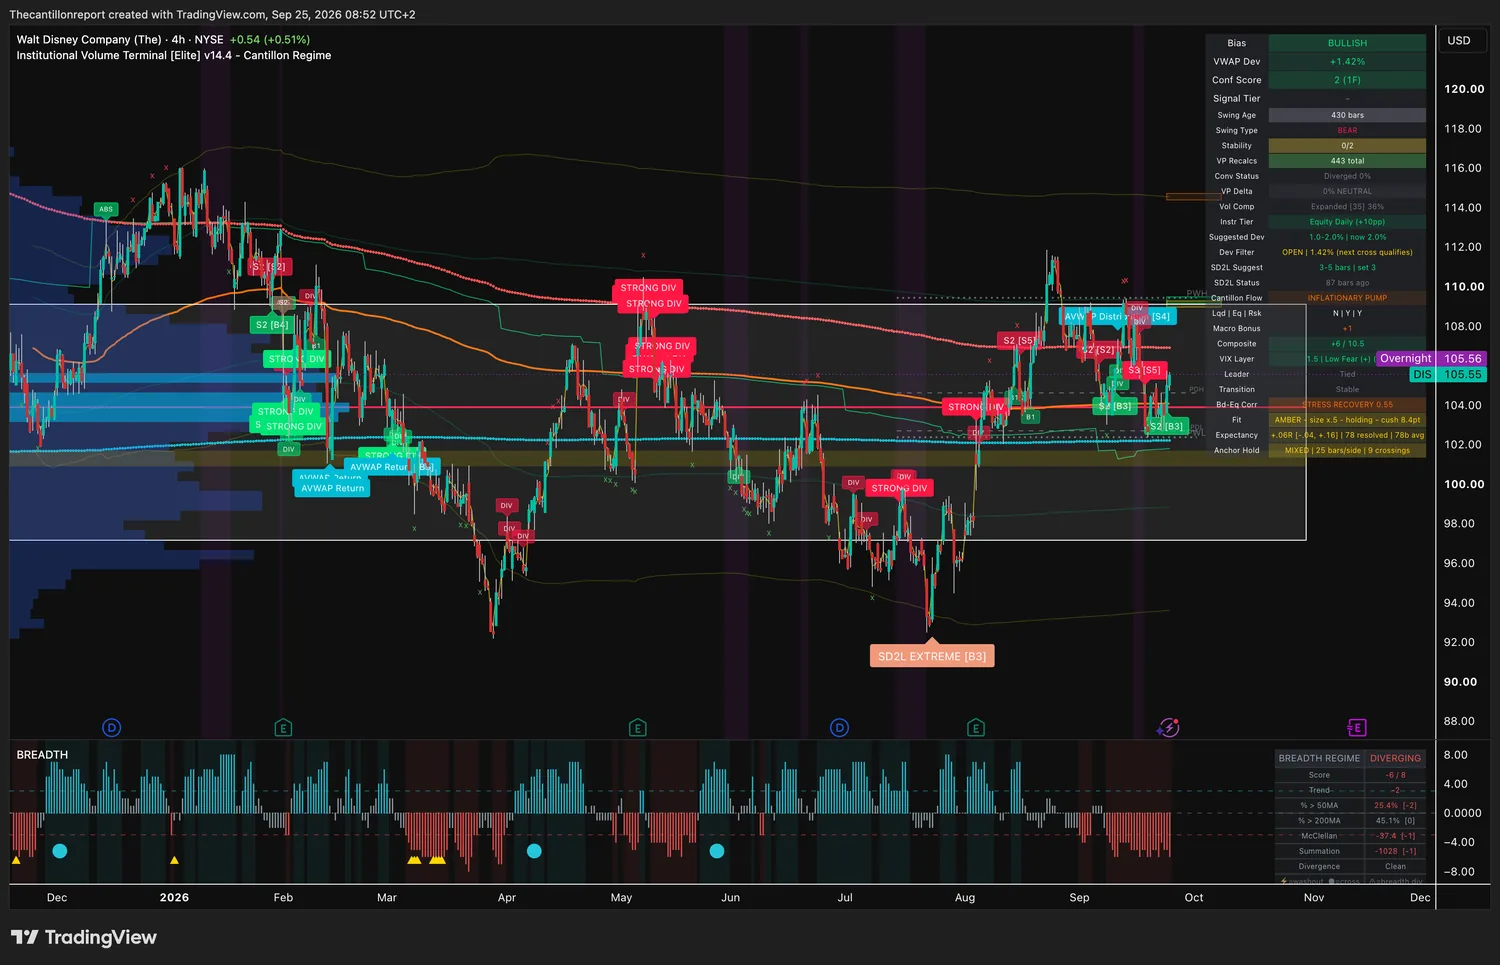
| Buy | DIS, half size. Window $104.08 to $106.16, last $105.56, so 60 cents of room. The daily bars agree with the four-hour chart. |
| Wait | PATH and VLTO. Both are flagged by the scan and neither has a record yet, at 17 and 7 finished signals against the 20 a record needs. VLTO is also 89 cents outside its window. |
| Avoid | CDE, the strongest short the scan grades, and all four indices. Every one carries a red light. |
| Skip | CGNX and CECO. The charts lean bullish, the scan's cross points down, and both lights are red. |
The 10-year Treasury yield closed Thursday at 5.19%, its highest since 2007, and the 30-year touched 5.43%, a level last seen in 2004. Two more Fed officials leaned hawkish: New York's John Williams called another hike by year-end reasonable, and Philadelphia's Anna Paulson said some modest further tightening may be warranted. Traders now price about a 70% chance of an October hike, and stocks still closed almost flat, with the S&P 500 down 0.07%.
- Oil Holds Near $105 Brent closed at 104.70 and WTI at 93.12 as talk of a phased US and Iran deal to reopen the Strait of Hormuz ran into reports of commercial ships being struck in it.
- Two Single-Stock Shocks MGM Resorts fell about 10% after Barry Diller withdrew an $18 billion takeover proposal, and Oracle dropped more than 6% after telling the developers of its New Mexico data center it was invoking force majeure.
Two legs of three are on, stocks and risk. Bonds are off, and the 10-year is why. That gap is the whole meaning of an inflationary pump: the rally is real and the funding under it is not. Strength slipped from +8 to +6 since yesterday and the tailwind from +2 to +1. Bonds and stocks are moving together, at a correlation of 0.72 on the index captures and 0.55 on the stock captures, so a bond hedge gives no cover to any trade on this page.
| Book | Reading | What it means this morning |
|---|---|---|
| Large-cap indices SP500, NAS100 | Bullish, 2.4 to 4.1% over cost, both shut, red-lit | The S&P is 30 points outside its entry band and the Nasdaq 620. A pullback into the band is needed, and with a red light it is still not enough. |
| Dow and small caps US30, RUSSELL | Bearish, red-lit, snapback live on the Russell | The Dow sits 37 points above the floor of its band. The Russell is 51 points below its own, with an oversold snapback signal already flagged, so a bounce is the live risk. |
| Single names Seven charts | Split: two half sizes, two unproven, three red | Only Disney and American Water Works clear every check. PATH and VLTO have no record yet. CDE, CGNX and CECO are red-lit. |
Our own 74-name coverage universe has 44.6% of names above their 50-day average and 47.3% above the 200-day. The McClellan reading, which tracks advancing names against declining ones, slid to −35.4 from −25.8 at Wednesday's close, and the day's net is −8 with 33 names advancing. The terminal's wider panel is harsher, at 25.4% above the 50-day against 28.8% yesterday. The dashboard does flag breadth improving against price, which is the one soft spot in a thin picture and the reason the Dow and small caps are not simply written off.
Six names have a side worth writing down and two carry a size, both half. Yesterday American Water Works and Disney sat under Looked At And Left Alone because the chart and the scan disagreed on direction. Overnight both charts flipped to the scan's side.
| # | Name | Side | Entry · trigger · get out | Why it is on this list | Size |
|---|---|---|---|---|---|
| 1 | AWK American Water Works | Short | −0.44% · $131.56 window $129.50–$132.14 already printed · 2.06 of room · out $143.43 |
The only chart where the entry signal has already printed under a light that is not red, and it sits on a utility, the kind of stock that trades against bond yields.Record +.07R on 68 signals, band −.04 to +.19 · light amber, size x.5, holding, 9.5-point cushion · confirmation 7 across 3 timeframes · signal tier 2 | Half |
| 2 | DIS Walt Disney | Long | +1.42% · $105.56 window $104.08–$106.16 daily cross printed · 60 cents of room · out $100.05 |
The only bullish chart with an open window and a light that is not red, with the scan's daily cross pointing the same way. The four-hour chart has not printed a tier of its own and the confirmation is thin.Record +.06R on 78 signals, band −.04 to +.16 · light amber, size x.5, holding, 8.4-point cushion · confirmation 2 across 1 timeframe · multi-bar structure still bear | Half |
| 3 | PATH UiPath | Short | −1.48% · $12.60 window $12.41–$12.79 19 cents of room · out $15.61 |
Bearish with both scan timeframes pointing down and 19 cents of window left. It carries no size because the record is not built yet.Record 17 of the 20 needed, 1 open, 18 fired · no light, sample still building · confirmation 4 across 2 timeframes · compression expanded 66% | None |
| 4 | VLTO Veralto | Long | Shut by 89 cents · $96.19 ceiling $95.30, cost line $93.43 comes back at $95.30 |
The broadest confirmation in the scan and a tight coil, priced just outside the band where anyone could buy it fairly. Coiling says a large move is coming and says nothing about which way.Record 7 of the 20 needed, 0 open, 7 fired · no light, sample still building · confirmation 10 across 3 timeframes · compression coiled 92% | None |
| 5 | CDE Coeur Mining | Short | −2.09% · $18.95 window $18.77–$19.35 18 cents of room · out $22.18 |
The strongest short the scan grades, tier 3 on six agreeing factors, and a red light that blocks it whatever the grade says.Record −.05R on 57 signals, band −.15 to +.05 · light red, no new entries, improving, −8.2-point cushion · confirmation 6 across 1 timeframe · compression building 79% | None |
| 6 | US30 Dow Jones Industrial Average | Short | −1.93% · 51,431 window 51,394–52,443 37 points of room |
The only index whose bias and window point the same way, sitting a few dozen points above the floor under a red light that is fading.Record −.10R on 46 signals, band −.26 to +.07 · light red, no new entries, fading, −9.9-point cushion · confirmation 3 across 1 timeframe · compression expanded 23% | None |
The S&P 500 cash index sits at 7,723.70, 2.40% above its cost line of 7,543. The top of its entry band is 7,694, 30 points under the price, so a dip of 0.4% puts it back inside. Yesterday the same test needed a 9-point dip. That is necessary and not sufficient: the trend light is red and improving, with a cushion of −12.2, and the record behind it is −.12R on 26 finished signals. Confirmation reads 1 across no timeframes.
You can check this one against the tape yourself by the close, which is why nothing on this page sits behind a gate today.
This one is free. The other four this week were not.
Every level, every execution block and all eleven terminal captures, with nothing held back and no gate anywhere on the page. Monday through Thursday the entry levels sit behind the member wall. Every Friday the whole thing ships open.
What you are doing: selling a water utility that has slipped under the price large money paid for it, with the 10-year still climbing. Half size, because the trend light is amber.
What you are doing: buying Disney 1.42% above the price large money paid, inside the window, on a daily cross the scan flagged this morning. Half size, and no chasing.
| Name | Distance from cost | Comes back at | Why it is not a trade |
|---|---|---|---|
| CGNX | +1.11% | Window open, ceiling $58.82 | Bullish on the chart while the scan's cross points down, so the two disagree. Red light, and a record of −.06R over 60 signals. |
| CECO | +2.53% | Window open, 33 cents left | Same disagreement: bullish chart, downward cross on the scan. The light is red and fading and the record is flat at 0.0R over 47 signals. |
| NAS100 | +4.11% | 29,993 | The only coil on an index, building at 80%, priced 620 points outside its band. Red light, and the deepest record here is +.01R over 114 signals, which is zero. |
| SP500 | +2.40% | 7,694 | Thirty points outside its band with the thinnest published record on the page, −.12R over 26 signals. The full read is in The One Number. |
| RUSSELL | −3.71% | 2,899 | The only live snapback signal in the scan, fired after price pushed through the lower band. The light is red and holding, and the band that would let anyone price a trade is 51 points overhead. |
The remaining nine captures, unmodified. Every panel prints the same regime block, Inflationary Pump at +6 of 10.5, so the differences between them are the names and not the market.
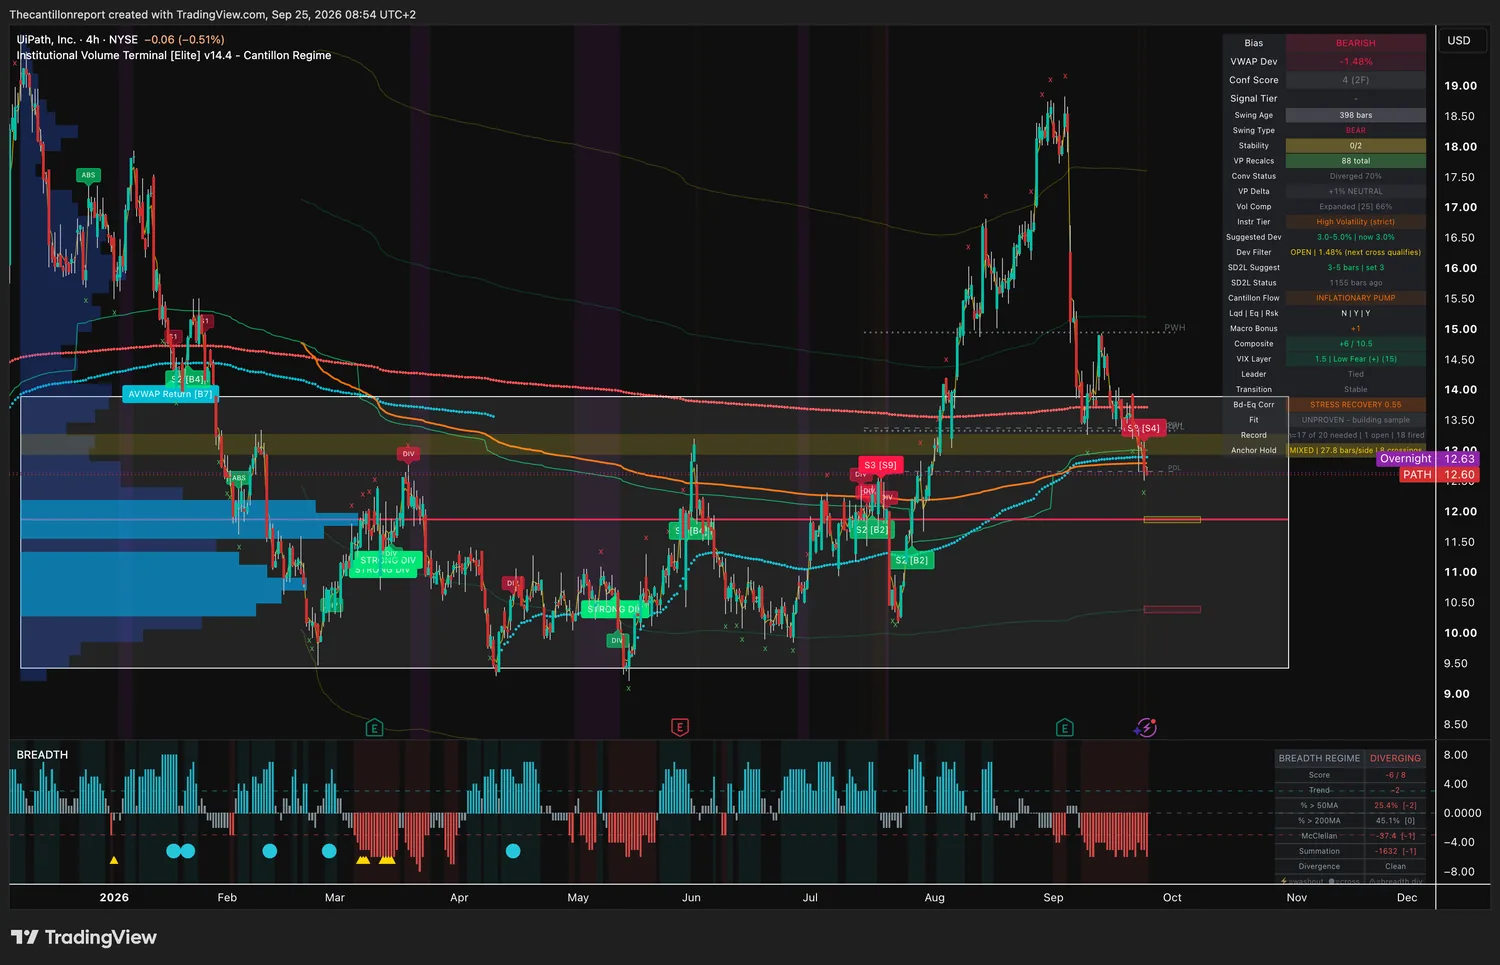
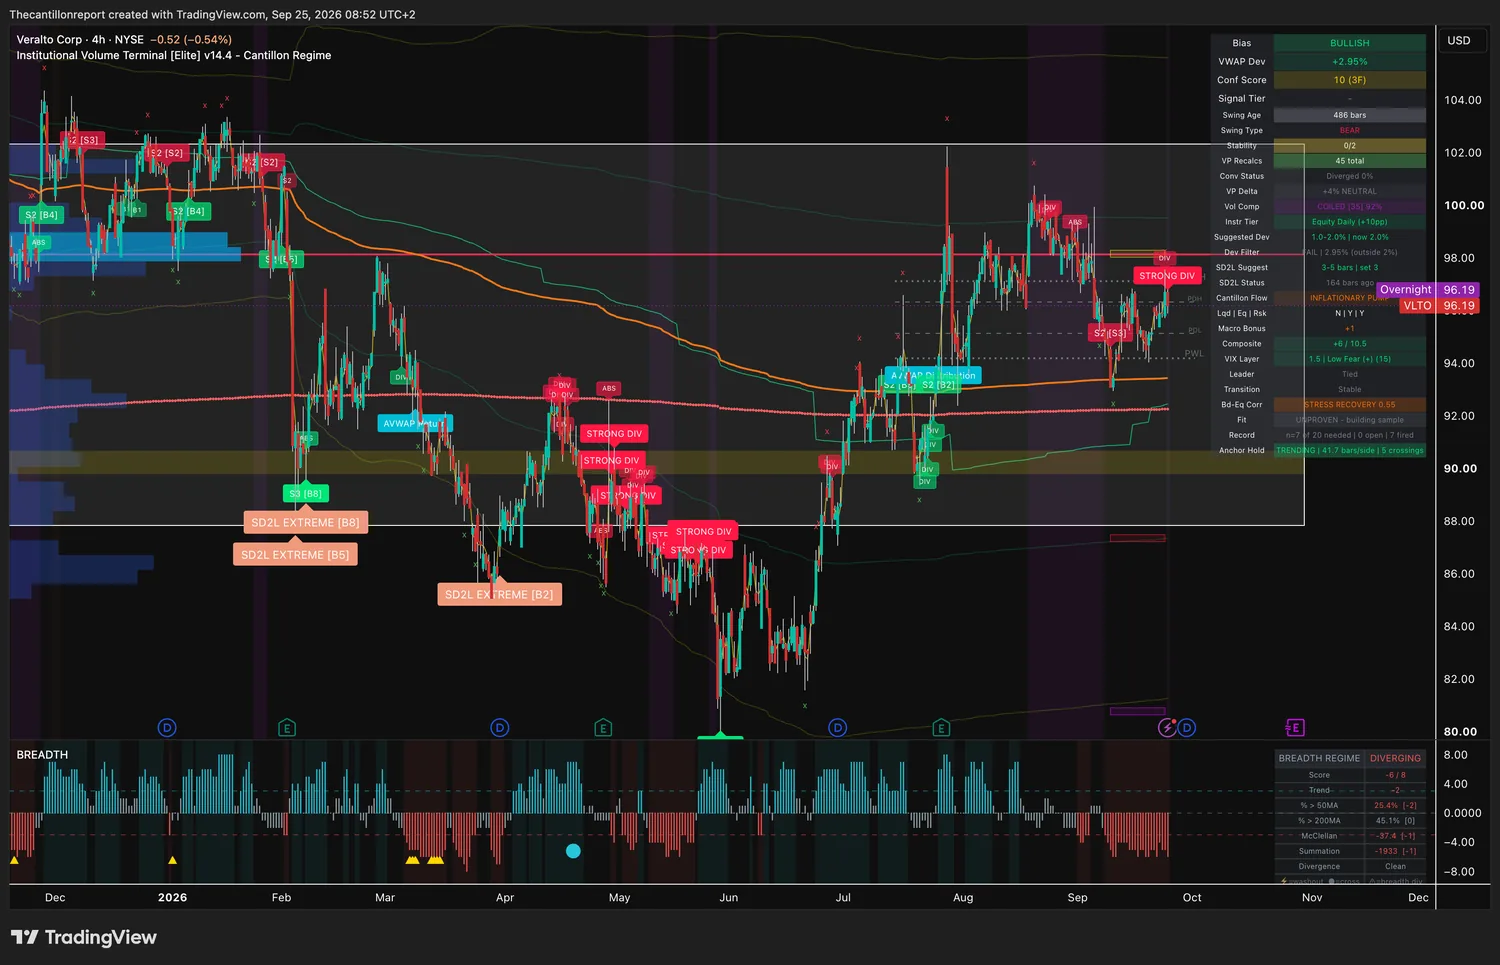
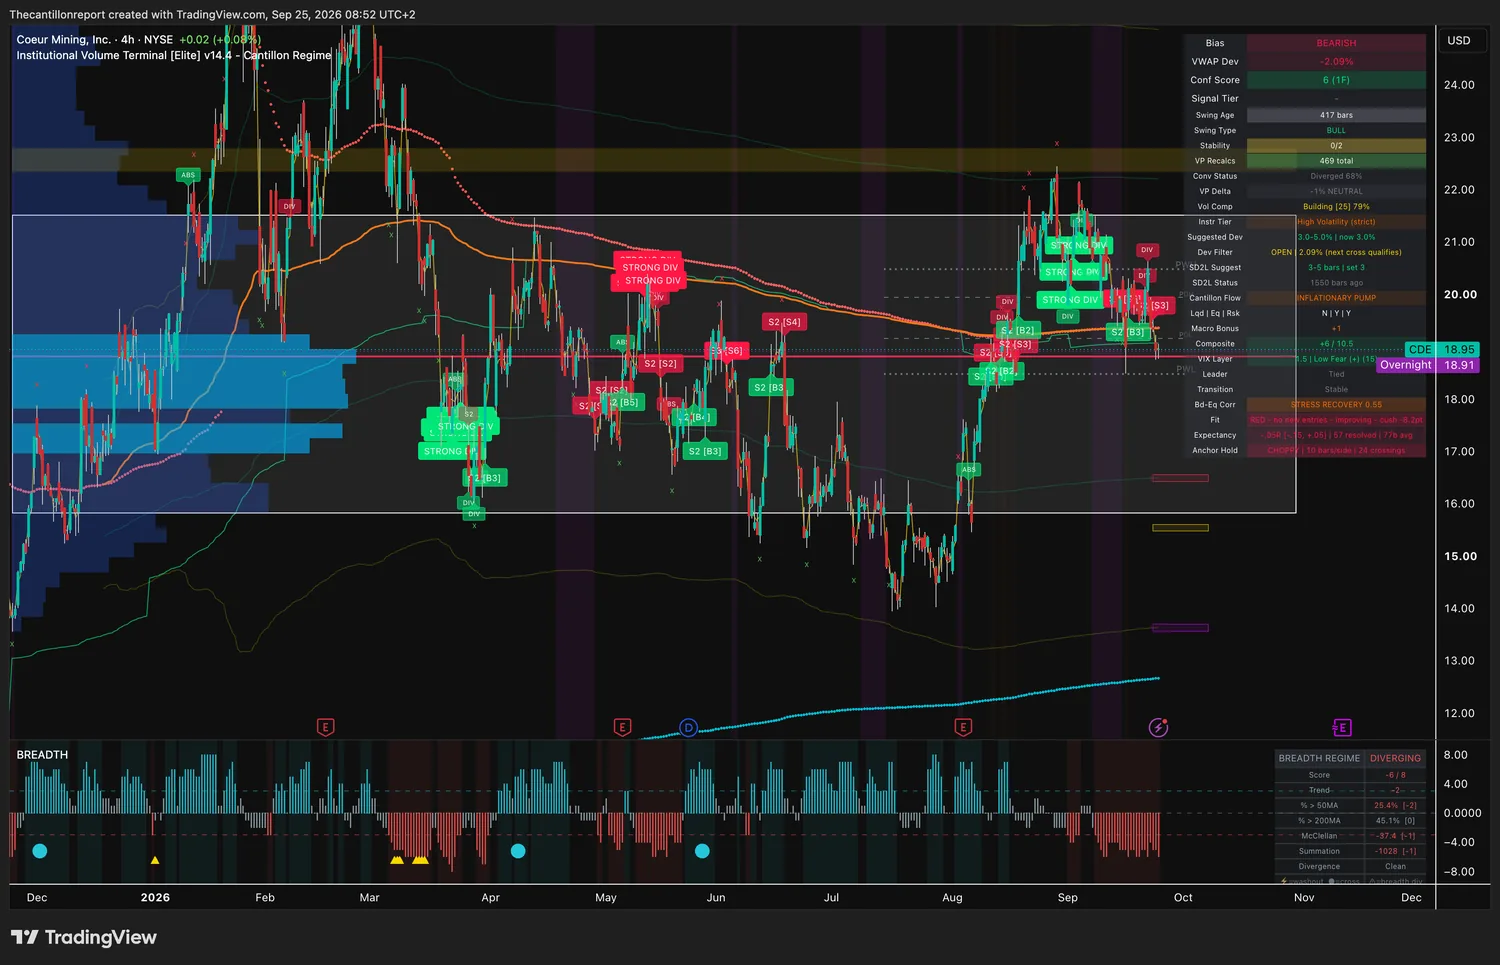
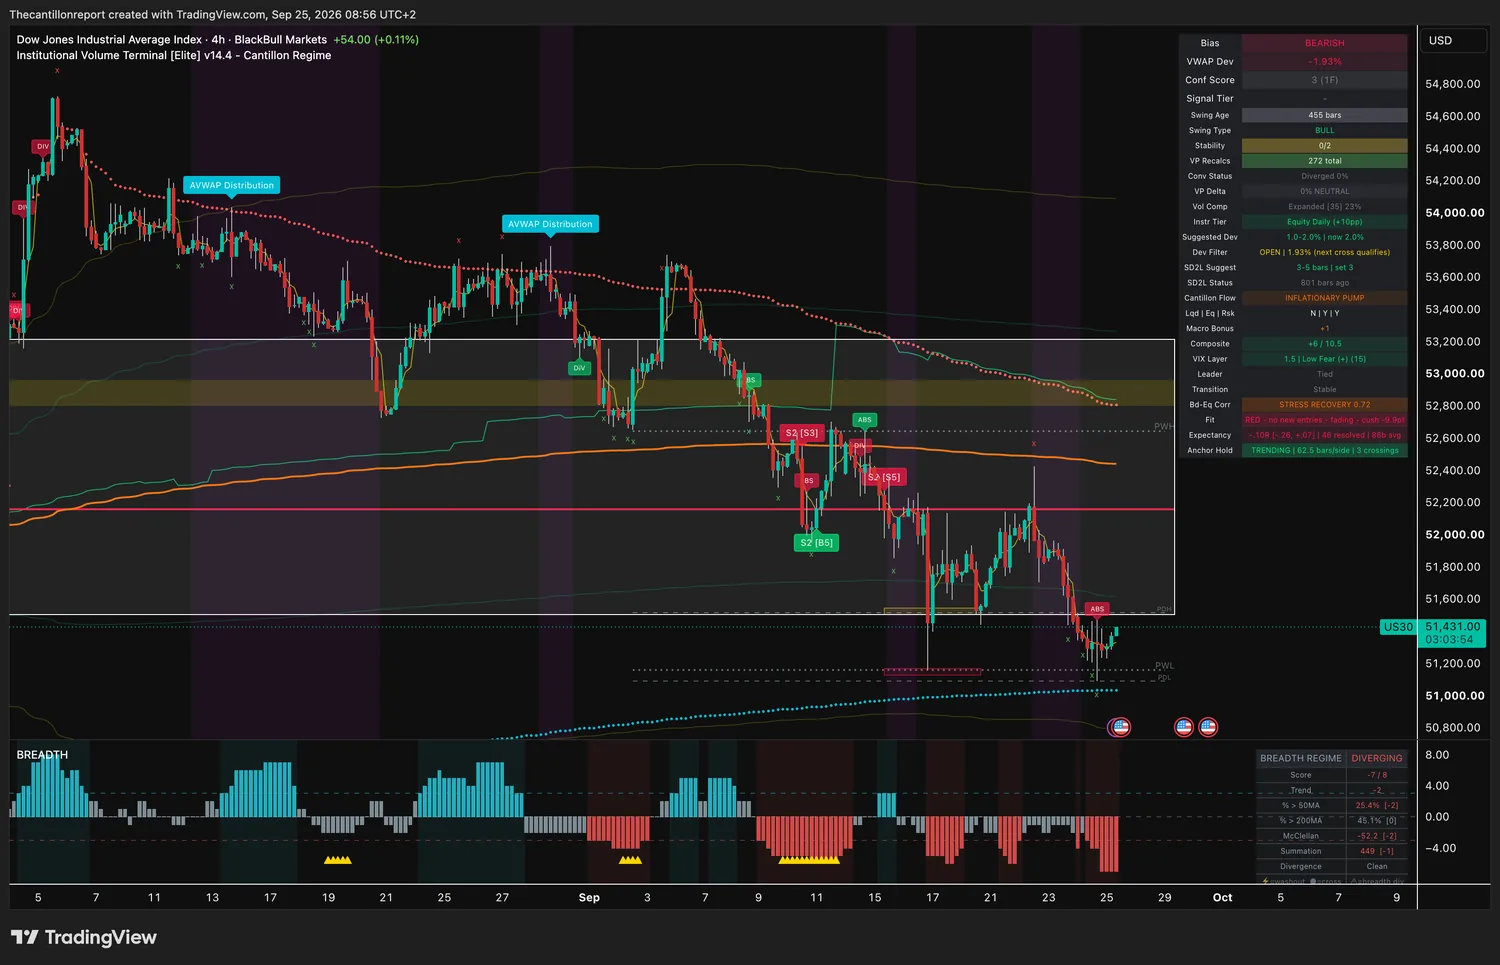
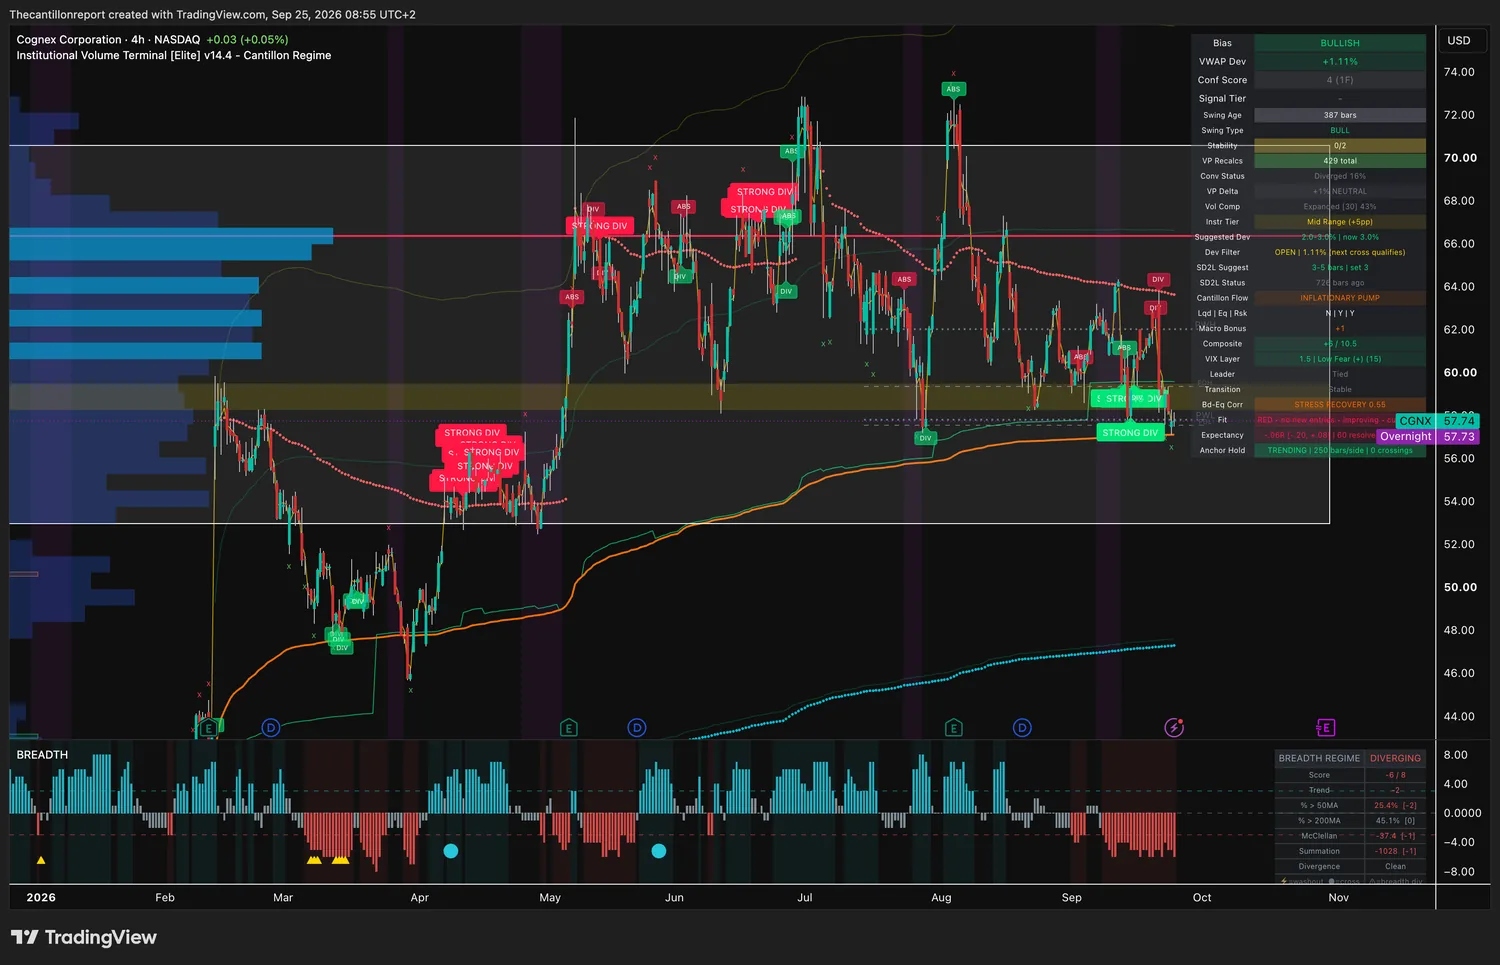
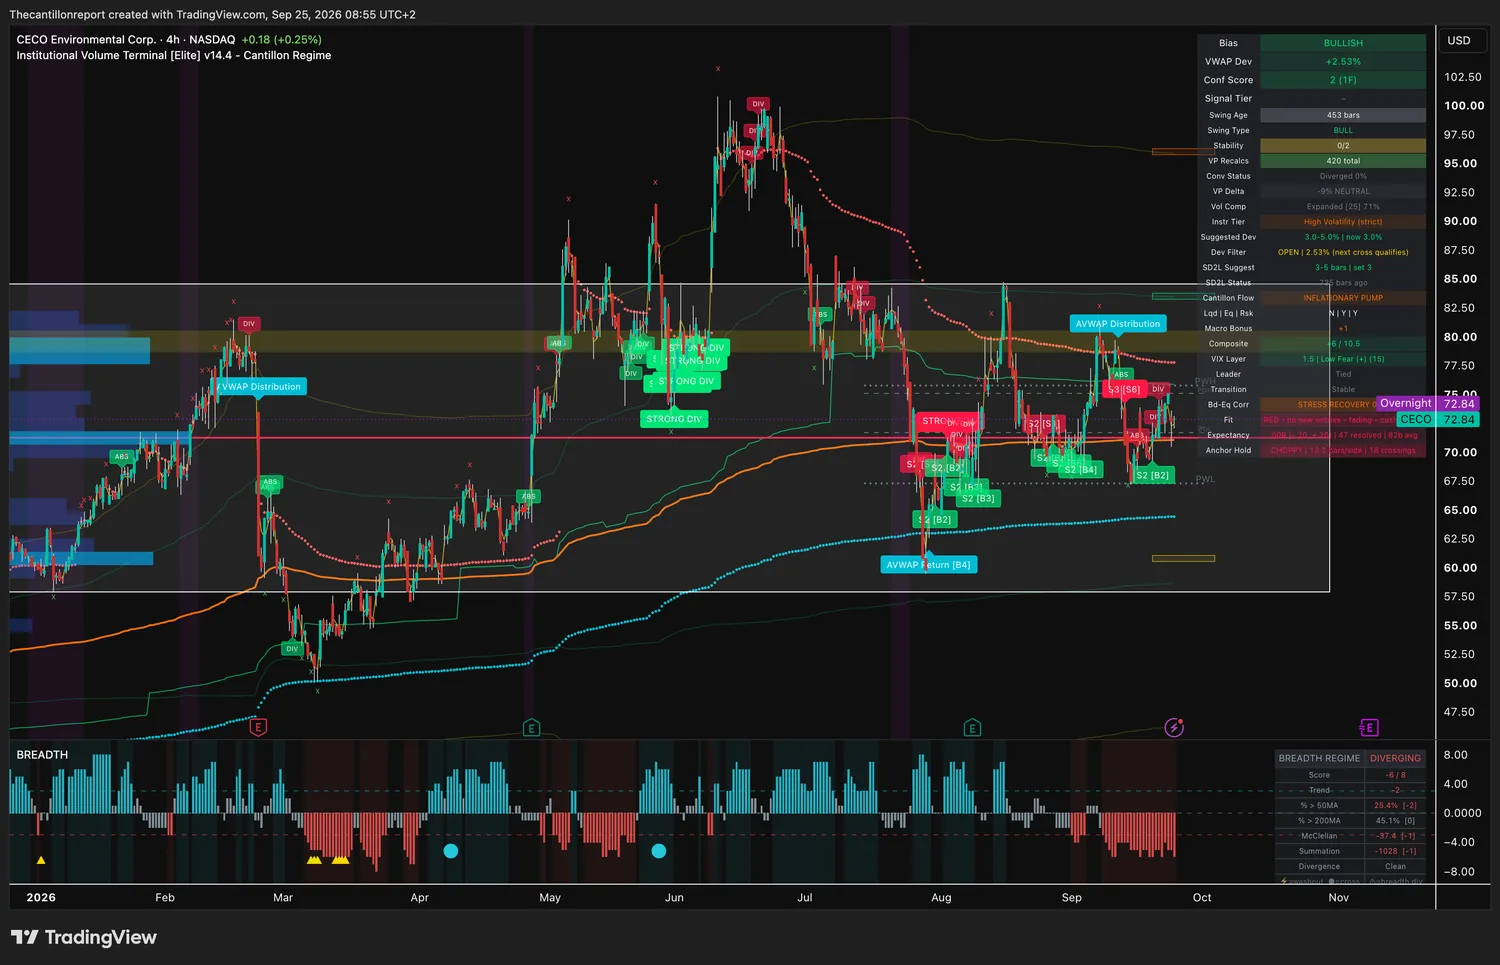
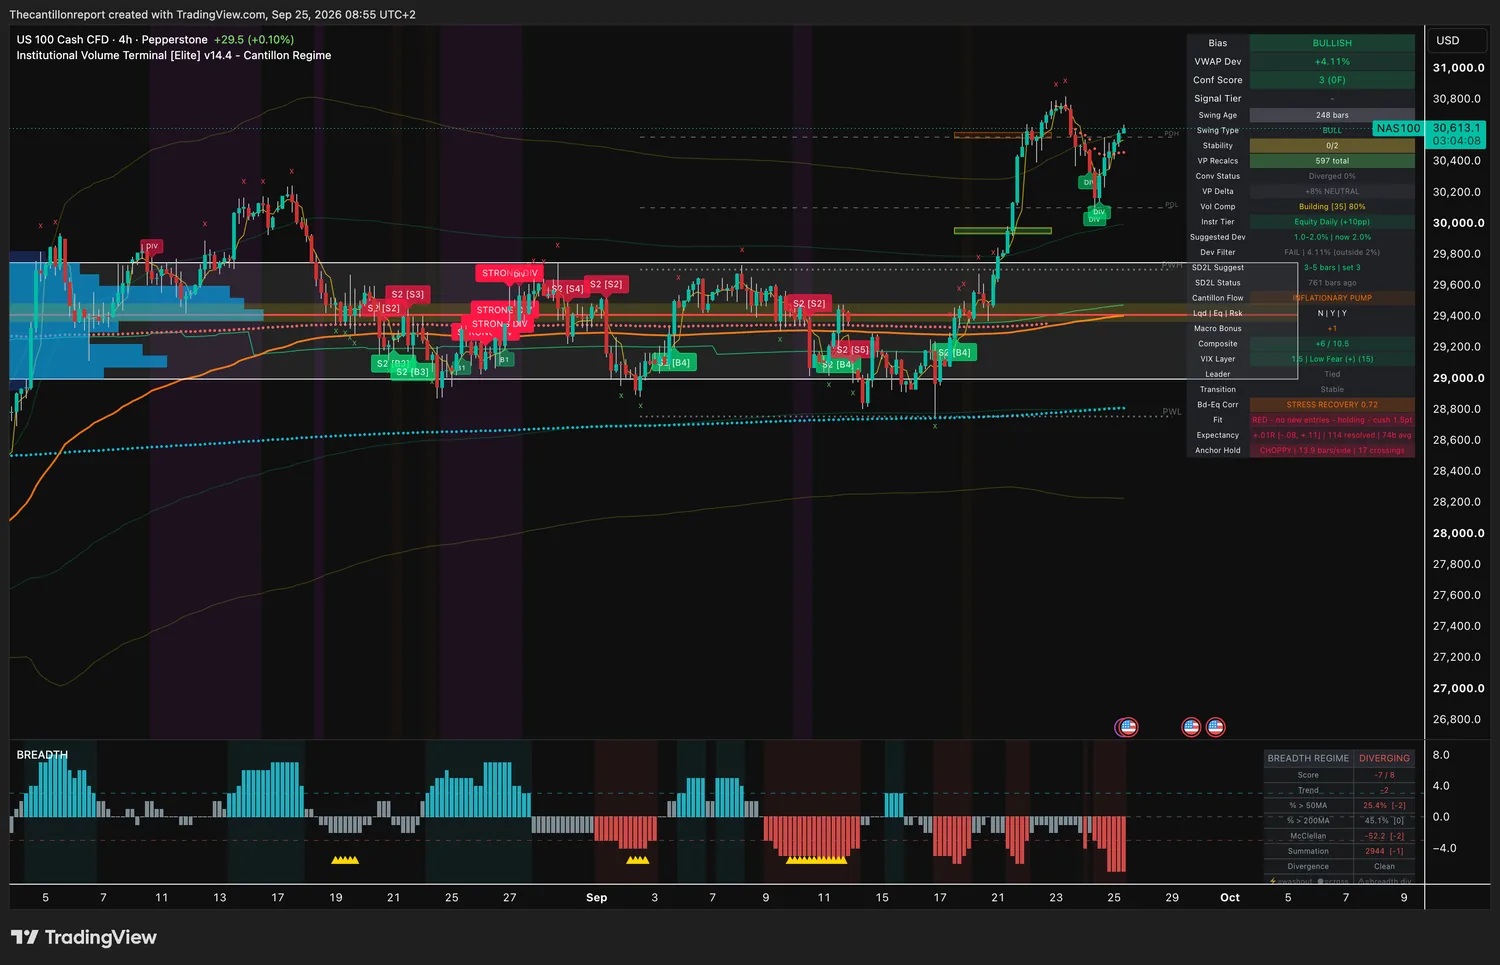
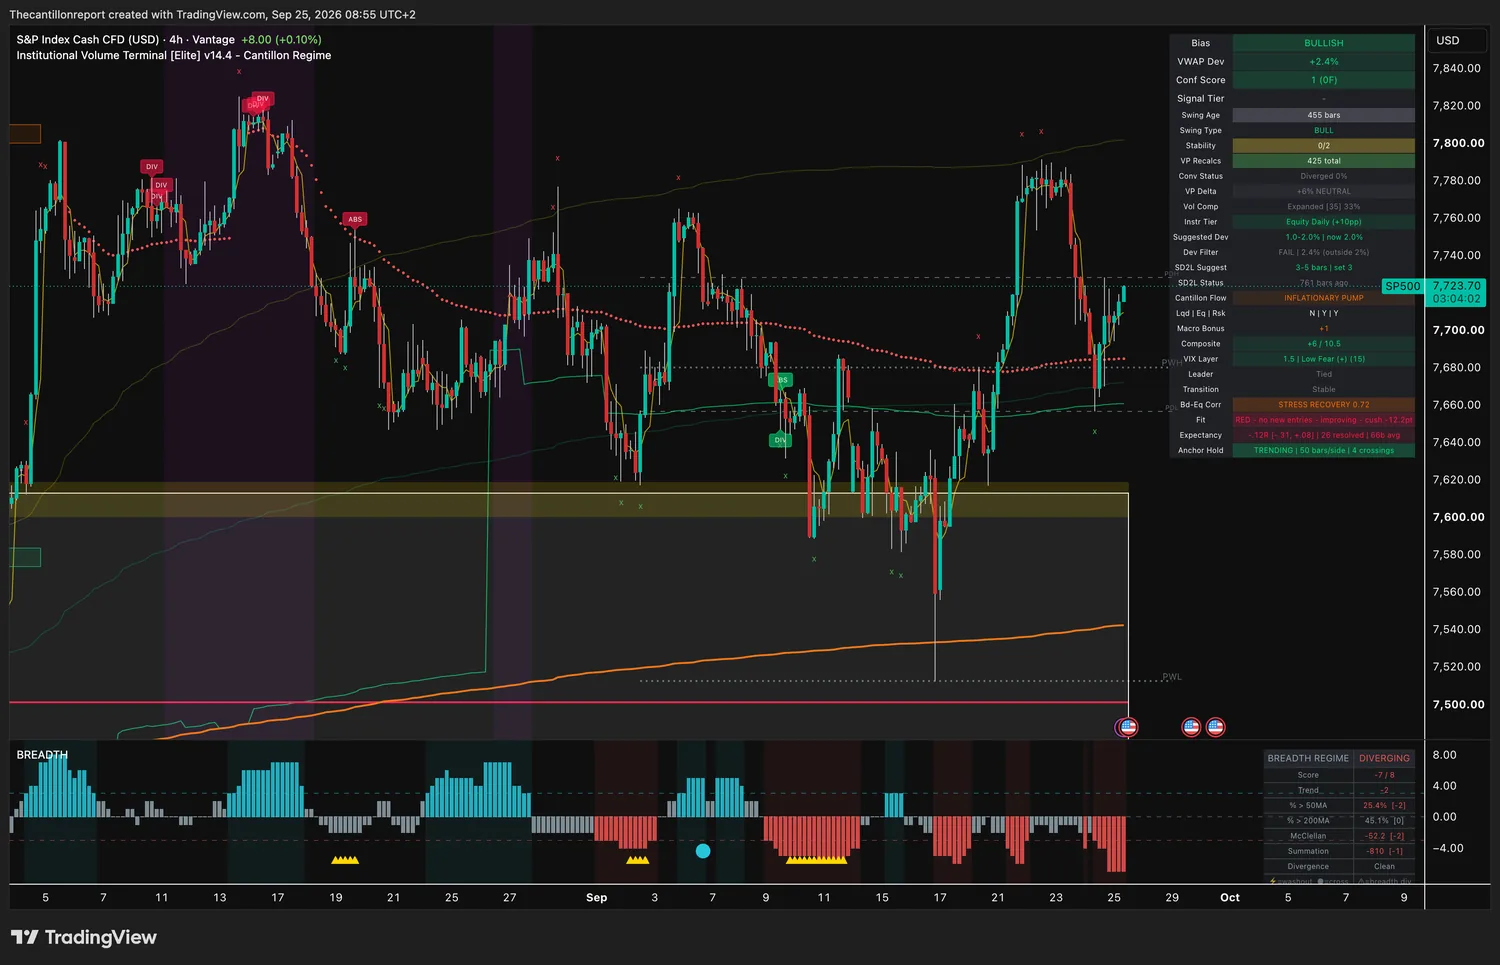
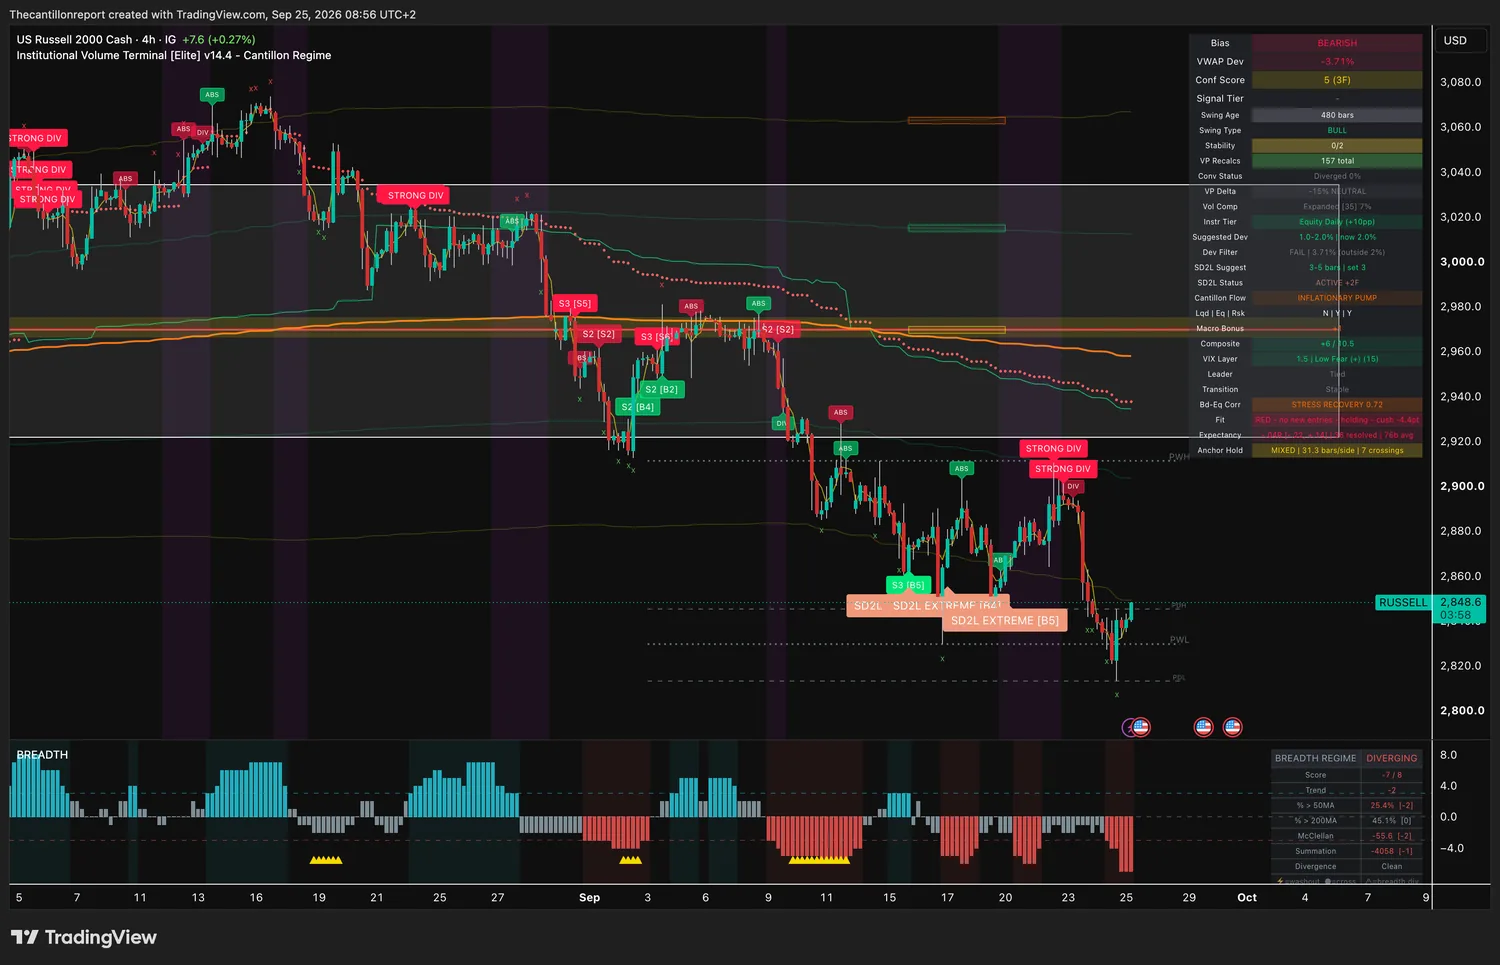
Cost line (the anchor) · the volume-weighted price large money actually paid over the current swing. Everything in this brief is measured as distance from it. Buy near it and you are paying what they paid. Buy far above it and you are paying their profit. Entry band · how far from the cost line a new entry can still be sensibly priced. Inside it, the entry is fairly priced. Past it, the move has already run and you wait for a pullback. Compression · how tightly the range has wound, from 0 to 100%. High means the next move should be a big one. It says nothing about direction, and it never overrides a shut entry band. Confirmation · how many independent readings agree, and across how many timeframes. Higher on both counts is better. Two timeframes at 6 beats one timeframe at 8. Record · the average result per signal in units of risk, where being stopped out is exactly −1.00. Always published with the number of finished signals behind it. It is measured over the same history the settings were chosen on, so read it as a description of the past and not a forecast. Below 20 finished signals no rate is published at all. Trend light · green means full size, amber means half, red means no new entry however good the chart looks. The cushion is how close the light is to changing.
Readings captured Friday 25 September 2026 between 08:52 and 08:56 CEST from the IVT v14.4 terminal, on four-hour bars that had not yet closed. US exchanges open at 15:30 CEST, so no trigger on a US-listed chart can fire before then. Cost lines and window edges are derived from the terminal's published percentage distances, accurate to the nearest cent or index point. Index levels come from CFD feeds and will differ from your futures contract. Get-out levels come from the scan's four-hour series and may differ slightly from your own charting platform.
Records are in-sample and forecast nothing. No rate is published on fewer than twenty finished signals, and the sample size is printed beside every one. Cognex and CECO Environmental are held out of the book because the terminal's bias and the scan's directional cross disagree. Check each company's earnings date before you trade it.
Charts are unmodified terminal captures provided for reference, not as entry instructions. Educational content only. Not financial advice. Past results do not predict future ones.