Strategy Inc (NASDAQ: MSTR)
Bitcoin Treasury × Software Platform × Capital Structure Analysis — Capitulation Update
Executive Summary
Strategy Inc closed July 2, 2026 at $93.39 — a fresh 52-week low. The lower-timeframe terminal answered immediately: SD2L EXTREME fired, now reading ACTIVE with +2 bullish factors. The tape has already responded — the daily bar closed +7.43% off the low, the weekly bar is +13.46%, and pre-market trades $98.45, a further +5.4% above the close. This is the sharpest snapback signature MSTR has produced since the November 2025 cycle low.
Every timeframe still reads BEARISH bias with the Dev Filter failing hard — Weekly at -41.67%, Daily at -62.56% below AVWAP. Cantillon Flow reads DISTRIBUTION with Composite pinned at +0/9 across every read. Broad market breadth, meanwhile, reads CONFIRMING — this is not a market-wide flush, it is idiosyncratic to MSTR.
The Weekly Picture
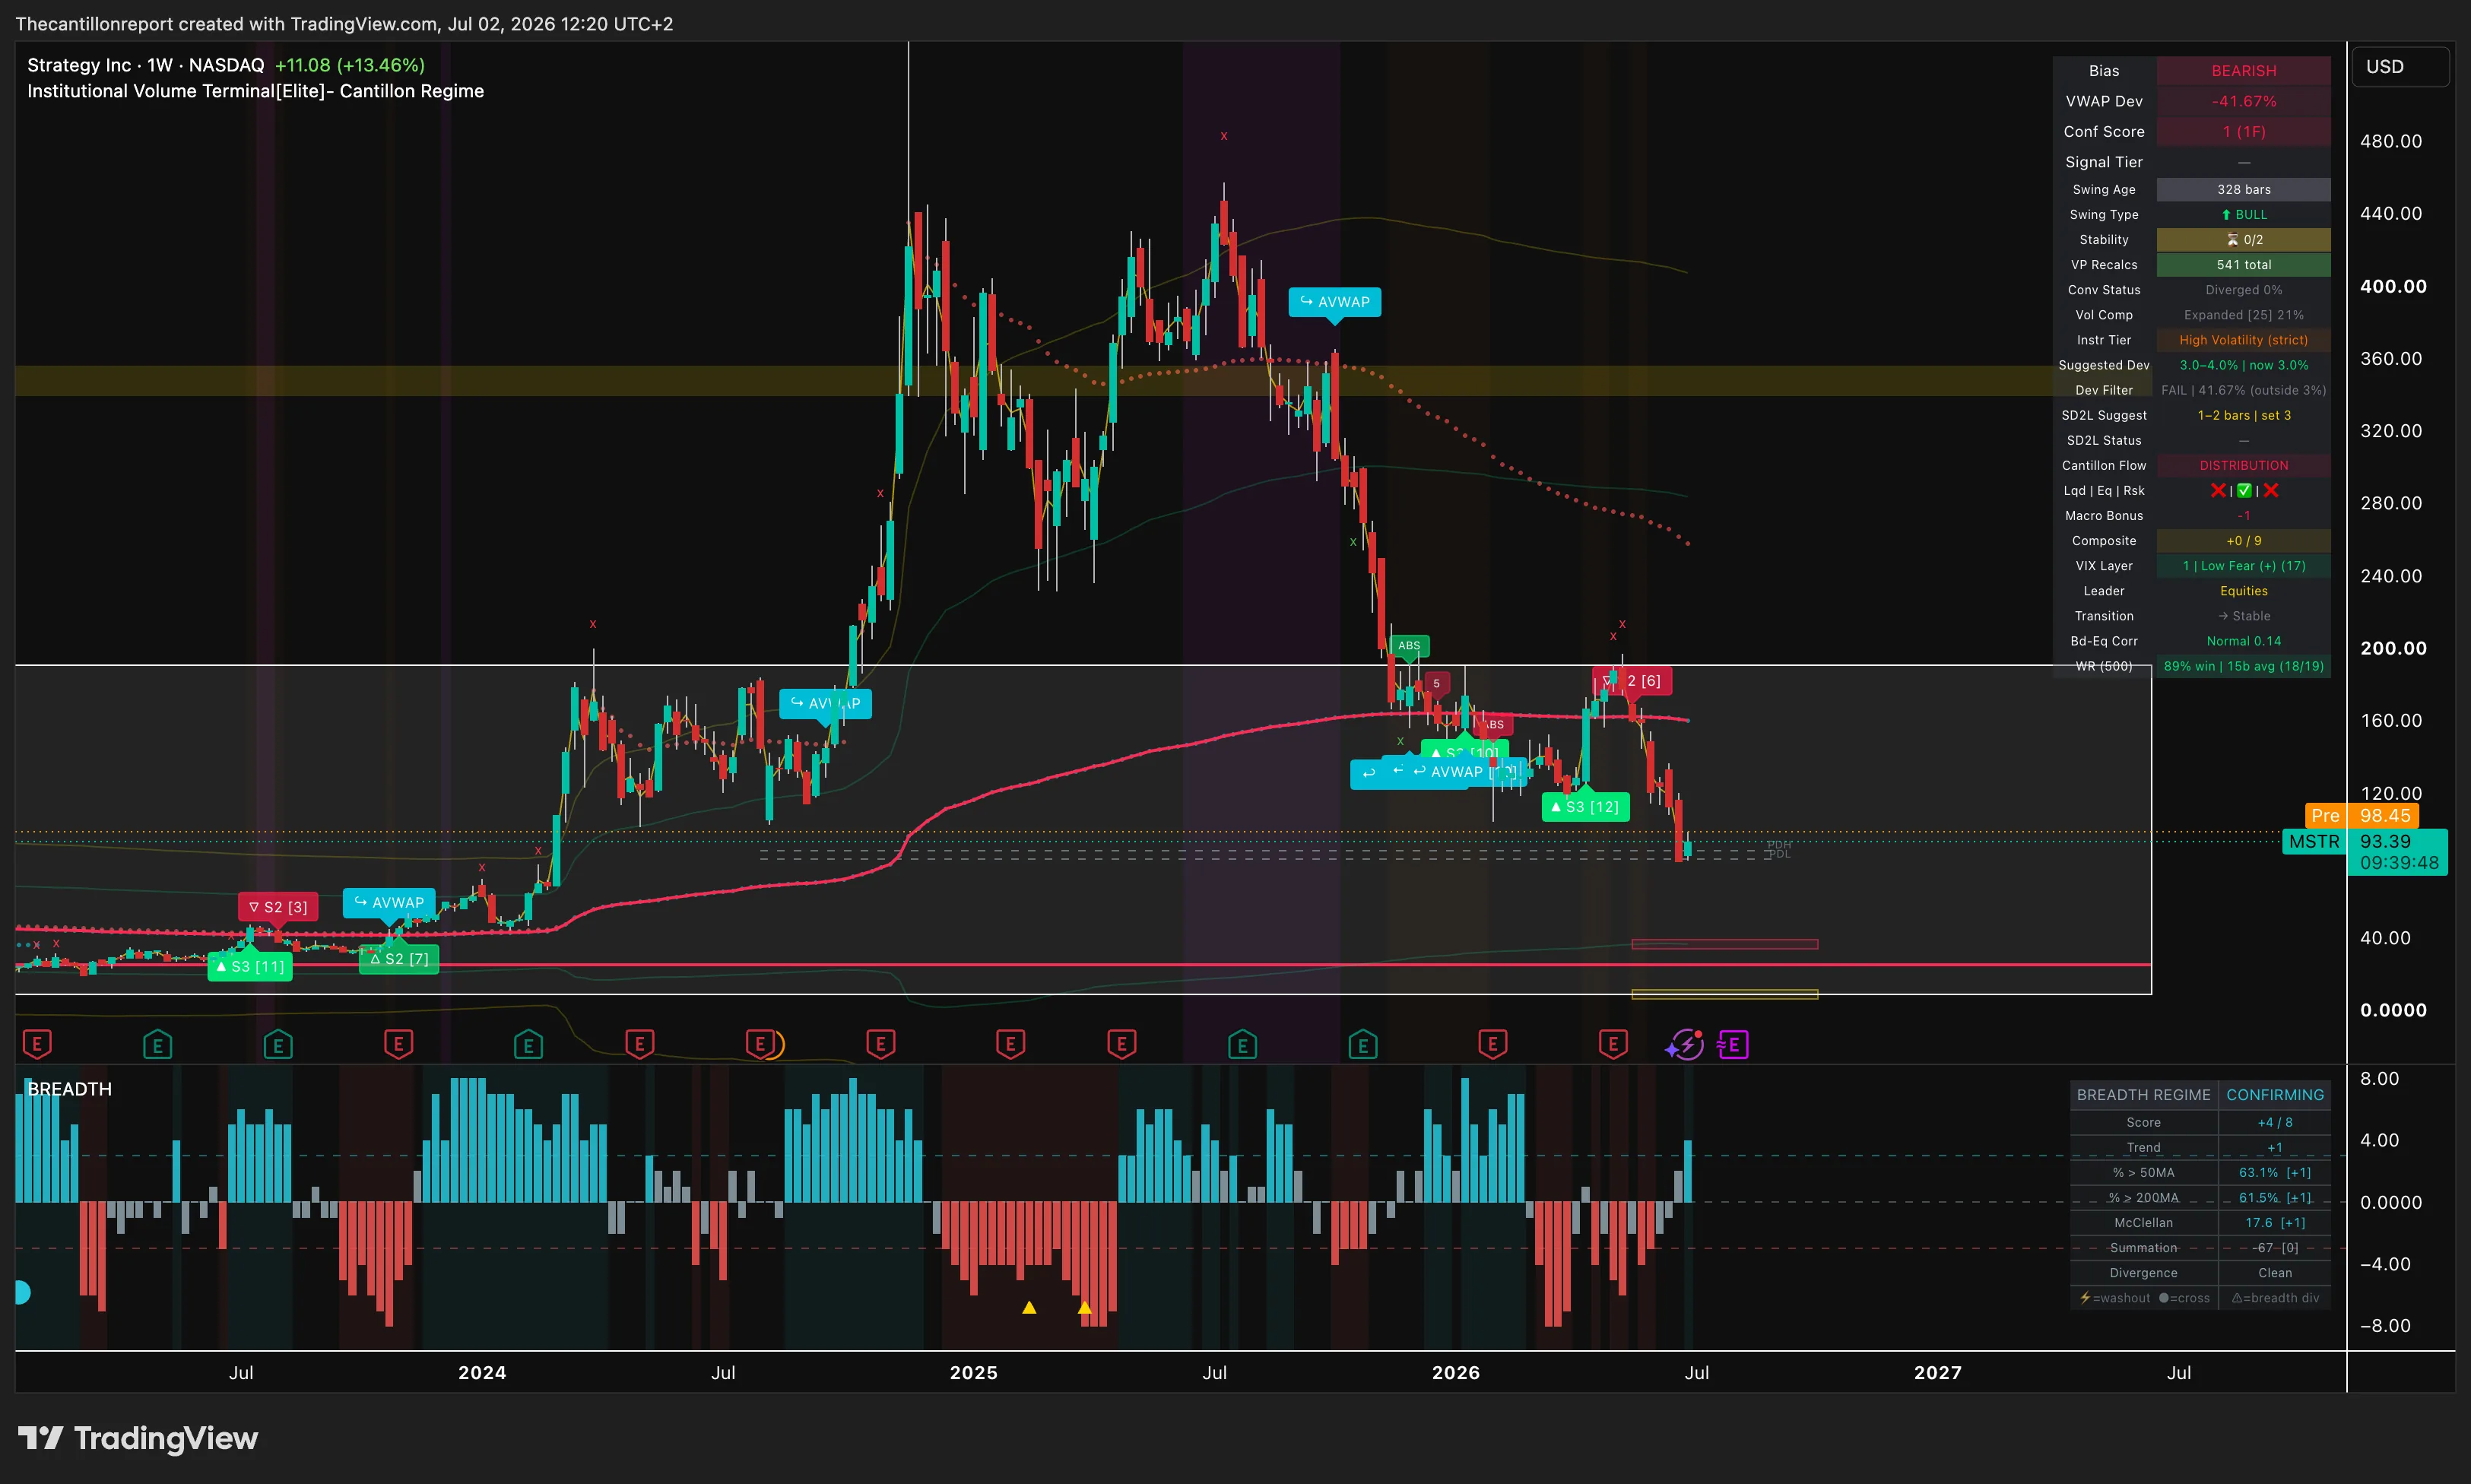
| IVT Parameter (Weekly) | Reading |
|---|---|
| Bias | BEARISH |
| VWAP Deviation | -41.67% |
| Cantillon Flow | DISTRIBUTION |
| Composite | +0 / 9 |
| WR (500) | 89% win | 15b avg (18/19) |
| Breadth Regime | CONFIRMING (+4/8) |
The weekly WR (500) of 89% is the highest win-rate reading on the entire MSTR dataset — the aggregate track record of every signal tier fired on this timeframe, not the SD2L-specific number. It is context for the framework's overall edge on this name, not a promise for today's bounce. The signal actually in play right now — SD2L Extreme — has its own, materially different track record on MSTR specifically. That number, along with the daily and lower-timeframe dashboards, the full fundamental picture, and the position management levels, is inside the full report.
The daily terminal tells a sharper story: VWAP deviation of -62.56% against a still-falling AVWAP, a Bond-Equity correlation flag unique to this timeframe, and the exact zone where SD2L Extreme printed and fired. MSTR's own historical win rate on this specific signal is...
Full Analysis Reserved for Elite Annual
The complete MSTR report includes the daily and lower-timeframe dashboards, MSTR's exact SD2L Extreme win rate, the full BTC treasury and mNAV analysis, bull/bear risk architecture, and the IVT position management levels — entry zone, invalidation, and resistance shelves.